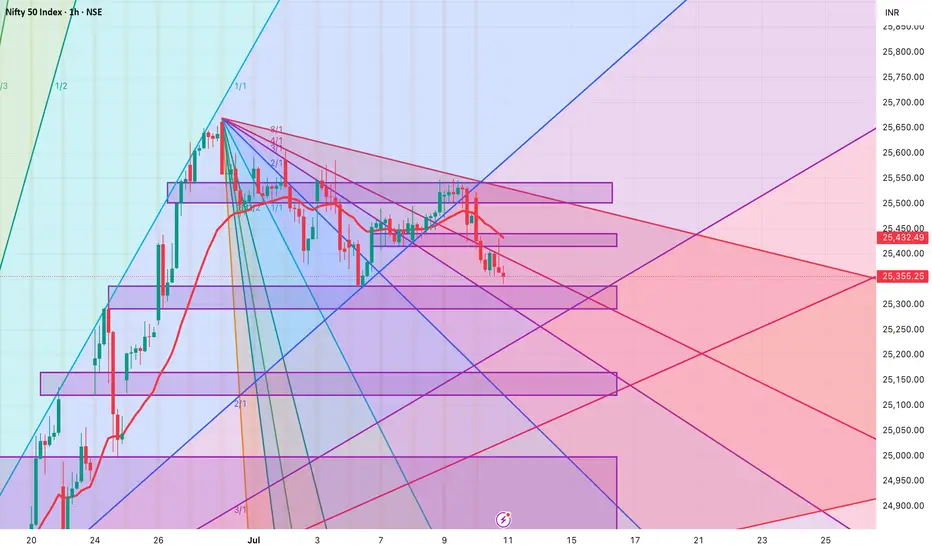
Nifty has taken support at 25K but can the support hold?Nifty today took a meaningful support at 25001 and bounced close to 25082. However ending the was in the negative by 67.55 points. RSI today went as low as 13.52 indication of oversold market. IT was a major drag after result that market did not like.
Now the resistances in front of Nifty are at 25106, Father Line Resistance at 25106, 25234, Mother Line Resistance at 25297, 25403 and finally 25543. Supports for Nifty remain at 25K, 24866 Chanel Bottom support and finally 24752. Below 24752 Bears can totally take control of the market if we reach there.
Things are in balance right now with Mid-cap, Small-cap starting to see some buying. If IT can hold the levels we will see growth from here. If IT index further caves in and other indices do not support we can see a down side. Shadow of the candle right now is neutral to negative.
Disclaimer: The above information is provided for educational purpose, analysis and paper trading only. Please don't treat this as a buy or sell recommendation for the stock or index. The Techno-Funda analysis is based on data that is more than 3 months old. Supports and Resistances are determined by historic past peaks and Valley in the chart. Many other indicators and patterns like EMA, RSI, MACD, Volumes, Fibonacci, parallel channel etc. use historic data which is 3 months or older cyclical points. There is no guarantee they will work in future as markets are highly volatile and swings in prices are also due to macro and micro factors based on actions taken by the company as well as region and global events. Equity investment is subject to risks. I or my clients or family members might have positions in the stocks that we mention in our educational posts. We will not be responsible for any Profit or loss that may occur due to any financial decision taken based on any data provided in this message. Do consult your investment advisor before taking any financial decisions. Stop losses should be an important part of any investment in equity.
NIFTY trade ideas
NIFTY50.....Are you crazy?Hello Traders,
with an "over-night" delay (for which I apologize), here is a brand-new analysis for NIFTY50!
The N50 has dropped, 'caused by the announced Tariffs for the "BRICS" countries.
The "Orange-man" who took residential at Pennsylvania Avenue at DC announced again tariffs at a record high for the BRICS-countries! Anyway! One step forward, one step back! This is clown's business!
The chart analysis:
N50 dropped to a low @ 25001.95 this morning. Here, a buy-signal occurred that would be activated @ 25109 points. Stop-loss must be set @25100!
The multi-week target, I have announced some weeks ago, are still valid.
While price break below the rising trend-line, connecting the high @25116 and 25222 a first target would be exactly at the level of 25350 (+/-) depending on when and if it will be touched!
In fact, the wave pattern could be also a wave 2, difficult to count, but still possible.
It needs a decline below 23246 points to eliminate this count!
While markets are unpredictable, 'caused by the US tariffs politics, it is very difficult to forecast the moves.
Probably one got argument would be, to pause the trading and wait til markets get less volatile.
That's it for today.
Have a great week.....
Ruebennase
Please ask or comment as appropriate.
Trade on this analysis at your own risk.
Nifty holds important support zone.Nifty Analysis:
Support and Upside Targets
Market Recap
- Opening: Nifty opened flat, showing little directional bias at the start.
- Intraday Move: The index was dragged down towards the important support zone of 25,050–25,000
- Bounce: From this support zone, Nifty rebounded and managed to close above 25,080.
Technical Outlook:
Key Support Zone
- Support Range: 25,050–25,000
Significance: This zone has acted as a strong support, with buyers stepping in to defend it.
- Implication: As long as Nifty sustains above this zone, the short-term trend remains positive.
Upside Targets
If Nifty holds above the support:
- Immediate Targets: 25,200 and 25,300 are the next levels to watch for upward momentum.
- Long-Term Targets: 25,500 and 25,700 remain the key targets if the bullish momentum continues.
Summary
- Bullish View: Sustaining above 25,000–25,050 support zone keeps the index in a positive bias.
- Bearish Risk: A decisive break below 25,000 could lead to further downside.
- Strategy: Traders may consider staying long as long as Nifty holds above the support zone, watching for the mentioned targets.
Note: Always use appropriate risk management and monitor for any changes in market sentiment or global cues that may impact index movement.
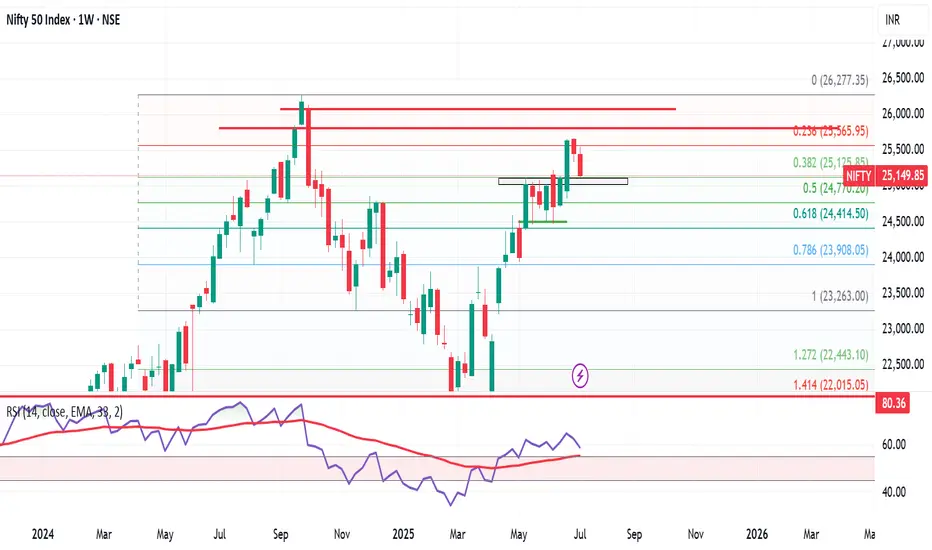
Nifty levels - Jul 15, 2025Nifty support and resistance levels are valuable tools for making informed trading decisions, specifically when combined with the analysis of 5-minute timeframe candlesticks and VWAP. By closely monitoring these levels and observing the price movements within this timeframe, traders can enhance the accuracy of their entry and exit points. It is important to bear in mind that support and resistance levels are not fixed, and they can change over time as market conditions evolve.
The dashed lines on the chart indicate the reaction levels, serving as additional points of significance to consider. Furthermore, take note of the response at the levels of the High, Low, and Close values from the day prior.
We hope you find this information beneficial in your trading endeavors.
* If you found the idea appealing, kindly tap the Boost icon located below the chart. We encourage you to share your thoughts and comments regarding it.
Wishing you success in your trading activities!

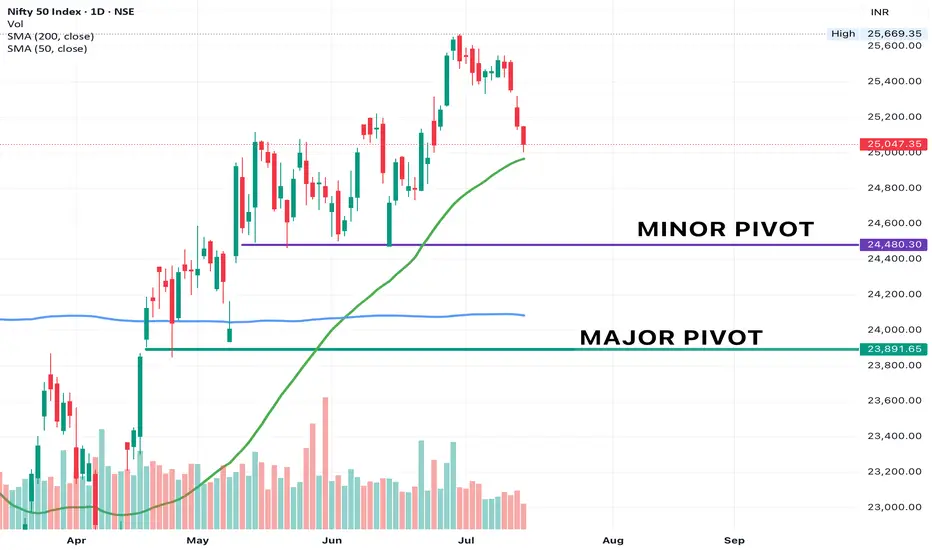
NIFTY Quick update - We are less than 3% away from the ATH. This is a healthy market pullback. 50 DMA is above 200 DMA and is trending up.
This could be a short term pivot and we can touch (or slightly undercut 50 DMA) and continue moving up. My portfolio is infact rising during this pullback - this implies the strongest stocks are actually still leading, there is no profit booking yet.
Use this time to cut out your underperforming stocks and add to your winners. Strongest Pockets in the markets - Finance, Banks, Capital Markets, Pharma, Infra/Realty.
Some pockets that are setting up - Metals, IT, Auto (dont expect outperformance here, markets have moved up while these are still setting up, so its a good chance they move in line with the markets, not much alpha here)
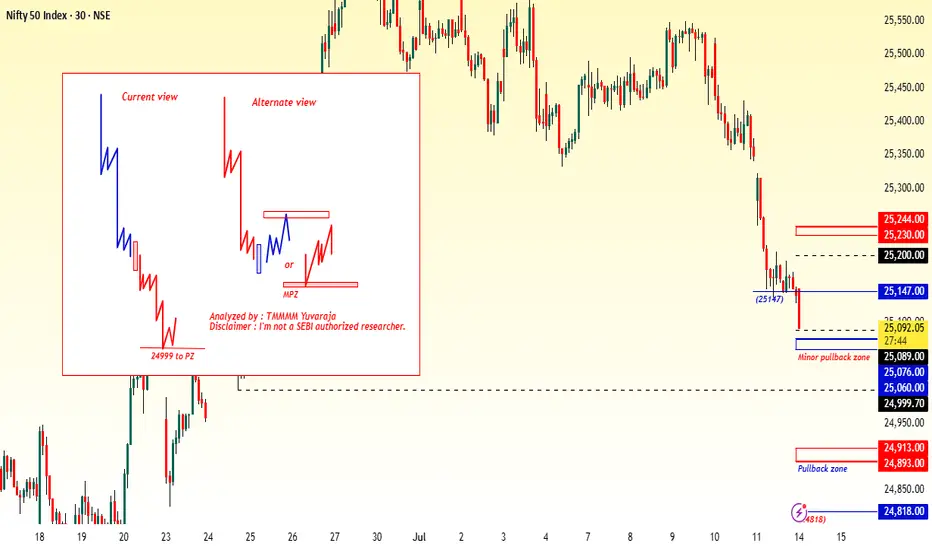
#Nifty directions and levels for July 14th:Good morning, Friends! 🌞
Here are the market directions and levels for July 14th:
The global market continues to maintain a moderately bearish sentiment, and our local market is also reflecting the same tone.
So, what can we expect today?
Current View:
Structurally, there has been strong selling pressure. So, if the market consolidates or breaks the support with a solid candle, we can expect the correction to continue.
Alternate View:
On the other hand, if the market finds support near the immediate support level or if the initial move takes a pullback, we can expect a maximum 38% to 50% pullback in the minor swing.
Even if that happens, the trend may still remain bearish in the lower time frame. So, if the market starts to reject around the 38% Fibonacci level on the upside, we can expect the downtrend to resume.
In simple terms, if a pullback occurs, we may see a range-bound market.
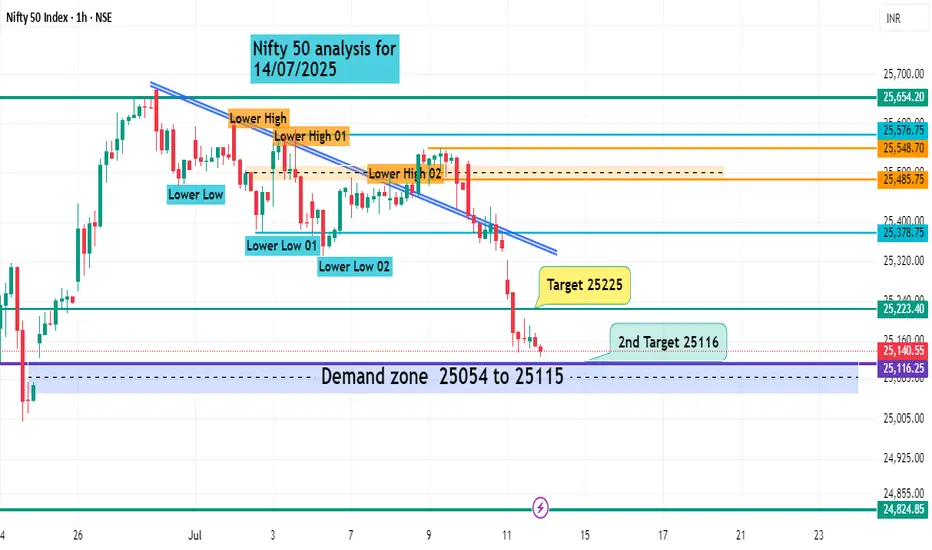
#NIFTY Intraday Support and Resistance Levels - 14/07/2025Nifty is expected to open slightly gap-down after consistent bearish momentum in the previous sessions. The index is hovering near 25140, and immediate support lies around the 25200 level. A breakdown below this level could lead to further downside pressure, with key support targets at 25150, 25100, and 25050.
If the index breaks and sustains below 24950, it may trigger a deeper correction toward the next support levels at 24850, 24800, and 24750. These zones should be watched closely for potential reversals or continuation of bearish momentum.
On the upside, any recovery and sustained move above the 25250 level may lead to a pullback rally. In that scenario, immediate resistance levels to watch would be 25350, 25400, and 25450+.
Intraday structure remains weak unless Nifty reclaims the 25250+ zone with strength. Price action near the 25200–25050 support range will be crucial in deciding the direction of the day.

Nifty 50 analysisYou can see that after June 30, the market is trending downwards, creating lower lows on the 1-hour chart. Our first target of 25225 has been achieved in the market. The second target will be 25116. There is a support zone visible in the market from 25056 to 25115. The market will attempt to reverse from here. If the market tries to fill the gap created on June 24, it may also try to fill the gap from June 23. Then our target liquidity zone will be 24824.
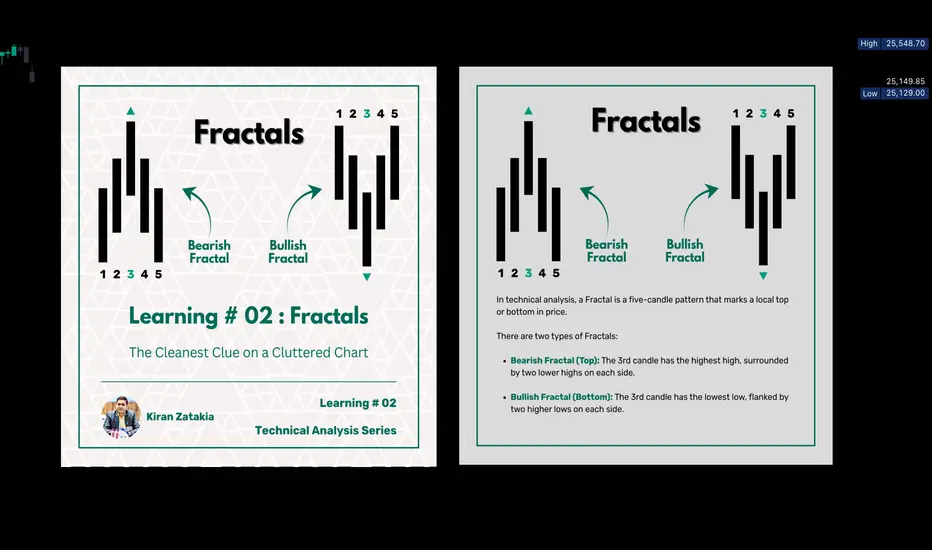
Learning#02 : Fractals⛰️ Learning#02 : Fractals
The Cleanest Clue on a Cluttered Chart
If you like clean charts and smart price behaviour, Fractals are one of those tools that give subtle but powerful signals. They’re not magic. They simply reflect what price is telling you—if you’re willing to listen.
Let’s unpack the concept and learn how to use Fractals like a pro.
🔍 What Is a Fractal in Trading?
In technical analysis, a Fractal is a five-candle pattern that marks a local top or bottom in price. It’s a pure price-action signal that doesn’t rely on lagging indicators.
There are two types of Fractals:
Bearish Fractal (Top): The 3rd candle has the highest high, surrounded by two lower highs on each side.
Bullish Fractal (Bottom): The 3rd candle has the lowest low, flanked by two higher lows on each side.
These formations are Price's way of saying: *"I tried to go further, but couldn't."
📊 What Do Fractals Indicate?
A shift in short-term control (bulls vs. bears)
Minor support or resistance zones
Useful markers for entries, exits, or trailing stop levels
They don't guarantee reversals but are excellent at highlighting where price momentum may pause, reverse, or build structure.
📈 How to Use Fractals – A Practical Guide
Let’s be clear: Fractals are not trade signals by themselves.
Instead, they work best when used in confluence with your strategy. Think of them as tools that:
Help confirm breakout levels
Refine pullback entries
Guide you in drawing cleaner trendlines, fib zones, and support/resistance levels
Assist in identifying swing highs and lows for Dow Theory-style trend analysis
🔗 Fractals + Strategy = Smart Trading
Whether you trade breakouts or mean reversion, Fractals help clarify:
Which highs or lows matter
Where to place stop losses with structure-based logic
How to trail SL as the trade progresses
They quietly organize your chart into readable, tradeable levels.
🚀 Practical Uses of Fractals
Fractals are the first tool I add to any chart—they instantly reveal structure and guide every step of my analysis.
1. Breakout Confirmation
Wait for a candle to close above a bullish fractal high or below a bearish fractal low.
Useful when the market is trending or forming structures like double bottoms/tops.
2. Pullback with Confirmation
Use the fractal zone as a short-term S/R level. If price returns and shows signs of rejection (like an inside bar, wick rejections, or low volume), consider entries based on confirmation.
Great in sideways or swing environments.
3. Trend Structure Validation
Fractals reveal clear pivot highs/lows, helping:
Confirm higher highs/higher lows
Mark structure for trendline drawing
Validate Fib levels or S/R zones
4. Trailing Stop Loss
Update your SL to trail behind the most recent opposite-side fractals.
In longs: SL below new bullish fractals
In shorts: SL above new bearish fractals
This lets you stay in the move while managing risk like a pro.
How it’s Look Like on Chart
snapshot
⚠️ Common Mistakes to Avoid
Trading every fractal blindly
Ignoring price context or trend
Relying on fractals in low-volume, choppy markets
📝 Final Thoughts
Fractals are like breadcrumbs left by price action. They quietly point to areas where the market faced resistance or found support. Alone, they’re not enough. But in the hands of a price-action trader, they’re incredibly useful.
Used alongside market structure, confirmation signals, and clean charting habits, Fractals become:
Trend identifiers
Entry enhancers
Stop loss trail markers
⭐ Bonus Tip
Next time you mark a level, Fibonacci or draw a trendline, check if a Fractal confirms it. You’ll be surprised how often it does.
Trade simple. Trade clean.
— Kiran Zatakia
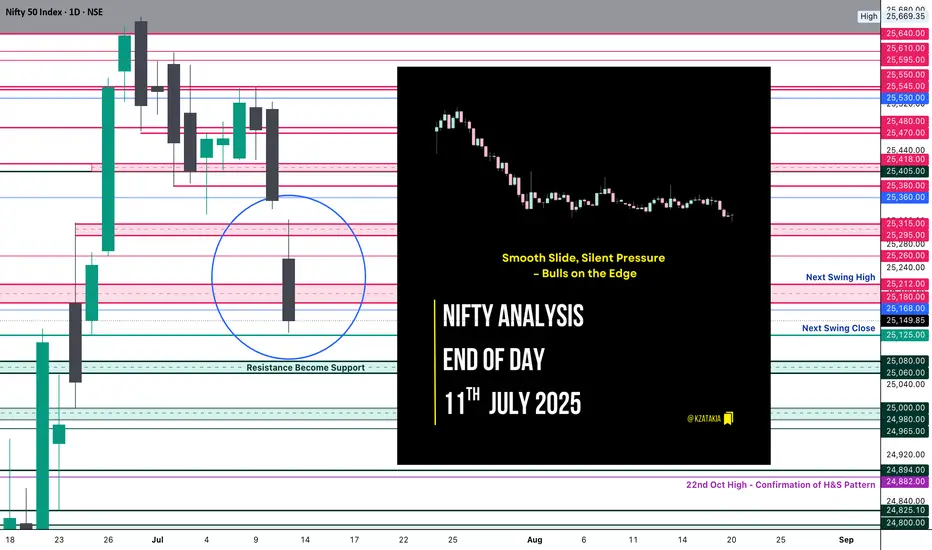
Nifty Analysis EOD – July 11, 2025 – Friday🟢 Nifty Analysis EOD – July 11, 2025 – Friday 🔴
"Smooth Slide, Silent Pressure – Bulls on the Edge"
Nifty opened with a 60-point gap-down, and despite an initial attempt to fill the gap with a 40-point bounce, the index couldn’t sustain. What followed was classic, smooth selling pressure — a slow bleed marked by 16 consecutive 5-minute candles that never broke the previous candle’s high.
There was no panic, just a persistent drift downward. The day’s structure was a silent yet firm rejection from higher levels, with 25,150 acting as an anchor for most of the session, eventually closing near 25,140.
📉 This session marks a revisit to the breakout zone of June 26–27.
Is this a false breakout or a healthy retest?
Only time — and a bounce or breakdown from 25,080–25,060 — will tell.
⚠️ If we close below 25,000, the entire bullish move from late June might be invalidated.
But a sharp bounce from the 25080–25060 zone could spark a hopeful reversal setup.
🕯 5 Min Time Frame Chart with Intraday Levels
🕯 Daily Time Frame Chart with Intraday Levels
🕯 Daily Candle Breakdown
Open: 25,255.50
High: 25,322.45
Low: 25,129.00
Close: 25,149.85
Change: −205.40 (−0.81%)
📊 Candle Structure Breakdown
Real Body: 105.65 points – clean bearish body
Upper Wick: 66.95 points – buyers rejected
Lower Wick: 20.85 points – weak defense at bottom
🔍 Interpretation
Price opened weak and stayed weak.
An intraday push to 25,320 was sharply sold into.
Closing near the day’s low shows full bear control.
Minimal bounce from day low indicates lack of bullish confidence.
🕯 Candle Type
A Bearish Rejection Candle – resembles an inverted hammer in a downtrend; suggests sellers still strong and bulls hesitant
📌 Key Insight
The zone of 25,320–25,350 has turned into firm intraday resistance.
25,100–25,130 is the immediate make-or-break support — below that lies 25,000–25,050.
For bulls to breathe again, we need a bounce and hold above 25,250–25,300.
🛡 5 Min Intraday Chart
⚔️ Gladiator Strategy Update
ATR: 193.17
IB Range: 78.45 → Medium IB
Market Structure: 🔴 Imbalanced
Trades Triggered
10:21 AM – Short Trade → 🎯 Trailing SL Hit (R:R 1:2.41)
📌 Support & Resistance Zones
Resistance Levels
25,168
25,180 ~ 25,212
25,260
25,295 ~ 25,315
Support Levels
25,125
25,080 ~ 25,060
25,000 ~ 24,980
24,965
💭 Final Thoughts
"It wasn’t a crash, it was a quiet rejection — and that makes it more dangerous. If bulls don’t show up now, bears might get bolder from here."
✏️ Disclaimer
This is just my personal viewpoint. Always consult your financial advisor before taking any action.
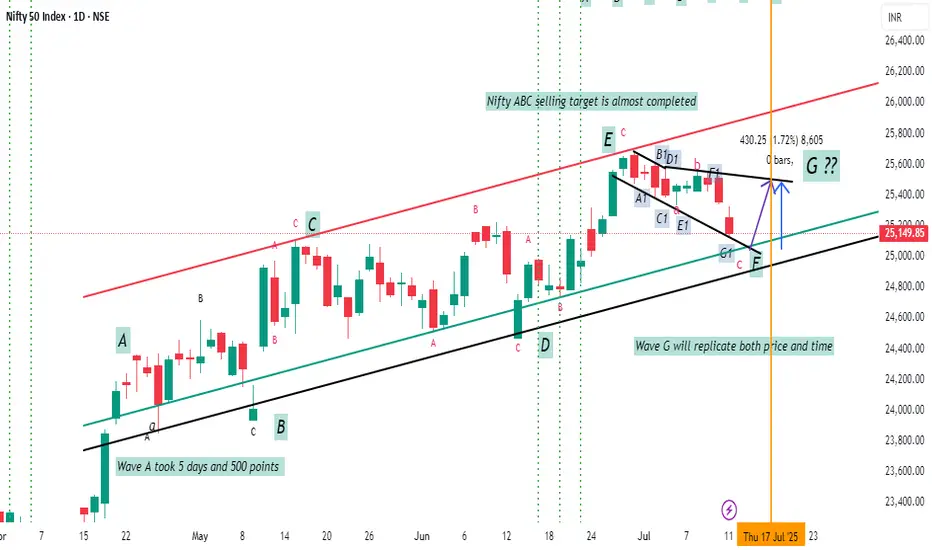
Nifty 500 points upside due in 5 days ??Pattern Type:
The structure is a Diametric pattern (7 legs) labeled A-B-C-D-E-F-G, currently expecting Wave G to unfold.
✅ Wave Details Noted on Chart:
Wave A: Took 5 days and moved ~500 points.
Wave B to E: Forming the characteristic bow-tie shape of a Diametric.
Wave F: Seems to have just completed or is near completion.
Wave G (Forecasted): Expected to mirror Wave A in both price and time (5 days / 500 points), suggesting a potential upward move from current levels.
🧭 Trendline Insights:
A red resistance trendline connects tops (Wave C to Wave E).
A black support trendline spans from the origin to Wave D and likely acts as support for Wave F.
Price is currently near the lower boundary, hinting at a possible reversal point.
💬 Annotations Highlight:
"Nifty ABC: selling target is almost completed" → suggests bearish move has played out.
"Wave G will replicate both price and time" → implies a measured bullish move is anticipated.
The substructure inside E-F is detailed as A1-B1-C1-D1-E1-F1-G1, possibly hinting at an internal smaller diametric or triangle.
🔮 Projection:
A bullish reversal (Wave G) is expected next.
Potential upside: ~500 points over 5 days (same as Wave A).
Support at the trendline and structure suggests this is a critical zone for bounce.
✅ Summary in One Line:
Nifty appears to be completing a Diametric (7-leg) corrective pattern, with Wave G projected next — likely an upward move matching Wave A’s time and magnitude (~500 pts / 5 days), assuming Wave F is now done.
Nifty Dips, Suggests Range-Bound Movement AheadIndian markets ended the week with a decline of nearly one percent, driven by lingering concerns over global tariffs and a weak start to the earnings season.
The 25,500 level has now turned into a strong resistance zone, marked by heavy call writing, while 25,000 continues to act as a solid support level backed by significant put writing.
Given these dynamics, the index is likely to enter a consolidation phase, with upcoming earnings announcements expected to keep sectoral volatility elevated.

Nifty July 3rd Week Analysis Nifty is looking uncertain at the moment , and we can expect a highly volatile week ahead for Nifty. Upside momentum can be trusted only if Nifty crosses and sustains above 25320, and it can continue upside momentum upto 25600-650. On the downside, if Nifty breaches 25050-24950, then we can expect a downtrend upto levels of 24750-650.
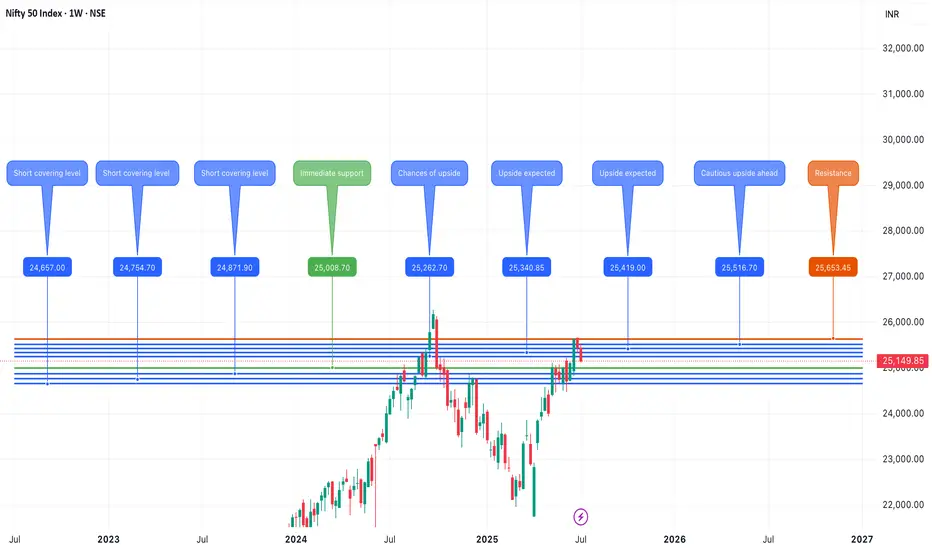
Nifty at Make-or-Break Zone: What to Expect Next Week Markets eMarkets ended the week under pressure, with the Nifty 50 closing at 25,149, down 312 points from the previous week. The index traded within a tight band, hitting a high of 25,548 and a low of 25,129 — perfectly respecting the 25,900–25,000 range mentioned in last week’s analysis.
Now, Nifty finds itself at a crucial support level near 25,000. A rebound from this zone could trigger a short-term rally towards 25,500–25,600, which will act as immediate resistance. However, traders should proceed with caution, as the monthly chart remains neutral to bearish, indicating that this could just be a temporary bounce rather than a sustained uptrend.
Looking ahead, expect Nifty to trade within a range of 24,700 to 25,600. A breakdown below 24,700 could open the gates for deeper cuts, while a breakout above 25,600 needs to be backed by strong volume and participation to confirm a trend reversal.
Sector Watch: Reliance Shines Amidst Caution
Among the large caps, Reliance Industries stands out as the only stock showing strength on the monthly chart, while other heavyweights and key sectors continue to lack momentum. This narrow leadership is a red flag for broader market sustainability.
Global Markets: S&P 500 at a Crossroads
Globally, the S&P 500 closed at 6,259, down slightly from last week. What’s more important is the formation of a Doji candle — a classic sign of indecision. A move above 6,300 could lead to upside targets of 6,376 / 6,454 / 6,500, which would likely boost sentiment in global and Indian equities.
However, if the index slips below 6,150, it would mark a failed breakout, potentially triggering a global correction — a risk that Indian markets can't ignore.
Final Word
We’re at a critical juncture. While technicals suggest a potential bounce in Nifty from 25,000, the lack of confirmation on higher timeframes and uncertain global cues call for prudence over aggression.
👉 I’ll be staying out of the market this week. The setup doesn’t offer a favorable risk-reward, and in trading, patience is often the best position.
Let the charts speak. We’ll act accordingly.
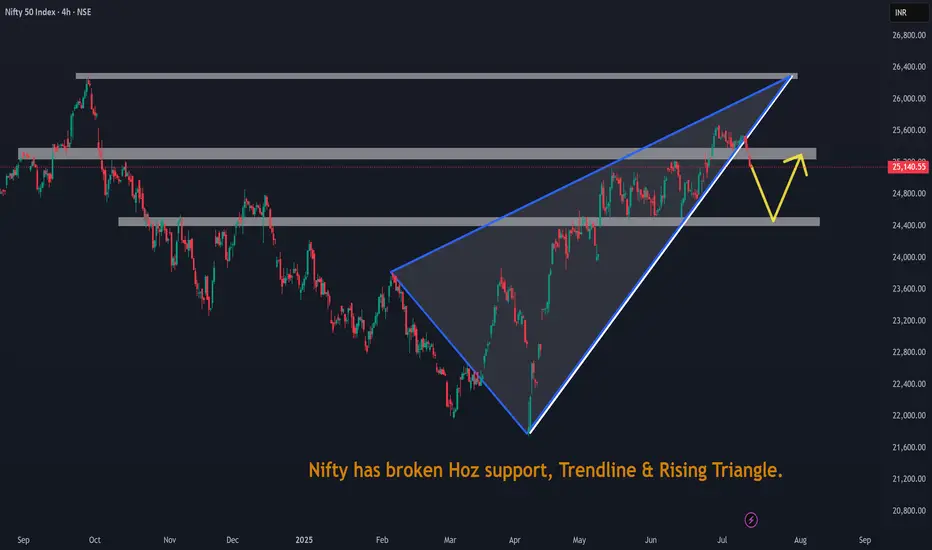
Nifty has broken Hoz support, Trendline & Rising Triangle.Nifty has broken Hoz support, Trendline & Rising Triangle. It may consolidate at this level.
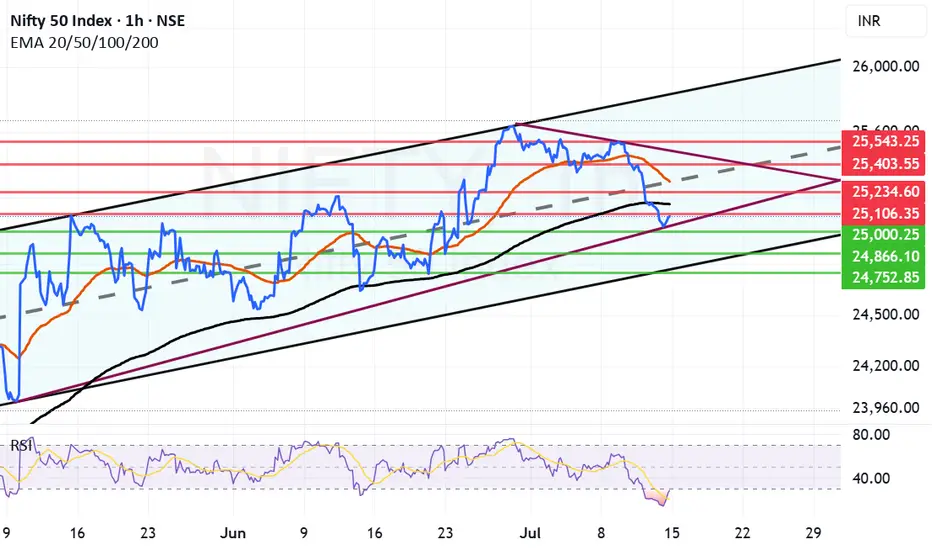
NIFTY S/R for 14/7/25Support and Resistance Levels:
Support Levels: These are price points (green line/shade) where a downward trend may be halted due to a concentration of buying interest. Imagine them as a safety net where buyers step in, preventing further decline.
Resistance Levels: Conversely, resistance levels (red line/shade) are where upward trends might stall due to increased selling interest. They act like a ceiling where sellers come in to push prices down.
Breakouts:
Bullish Breakout: When the price moves above resistance, it often indicates strong buying interest and the potential for a continued uptrend. Traders may view this as a signal to buy or hold.
Bearish Breakout: When the price falls below support, it can signal strong selling interest and the potential for a continued downtrend. Traders might see this as a cue to sell or avoid buying.
MA Ribbon (EMA 20, EMA 50, EMA 100, EMA 200) :
Above EMA: If the stock price is above the EMA, it suggests a potential uptrend or bullish momentum.
Below EMA: If the stock price is below the EMA, it indicates a potential downtrend or bearish momentum.
Trendline: A trendline is a straight line drawn on a chart to represent the general direction of a data point set.
Uptrend Line: Drawn by connecting the lows in an upward trend. Indicates that the price is moving higher over time. Acts as a support level, where prices tend to bounce upward.
Downtrend Line: Drawn by connecting the highs in a downward trend. Indicates that the price is moving lower over time. It acts as a resistance level, where prices tend to drop.
Disclaimer:
I am not a SEBI registered. The information provided here is for learning purposes only and should not be interpreted as financial advice. Consider the broader market context and consult with a qualified financial advisor before making investment decisions.
Institutional Trading Process 1. Investment Idea Generation
This is where it all begins.
Institutions generate trading ideas based on:
Fundamental research (company earnings, macroeconomic data)
Quantitative models (statistical or algorithmic strategies)
Technical analysis (price action, trends, volume)
Sentiment analysis (news flow, social media, market psychology)
Often, the research team, quant team, or portfolio managers work together to develop high-conviction trade ideas backed by data and analysis.
2. Pre-Trade Analysis and Risk Assessment
Before placing a trade, institutions perform:
Risk/reward analysis
Scenario testing (How does the trade perform in different market conditions?)
Volatility analysis
Position sizing based on portfolio risk budget

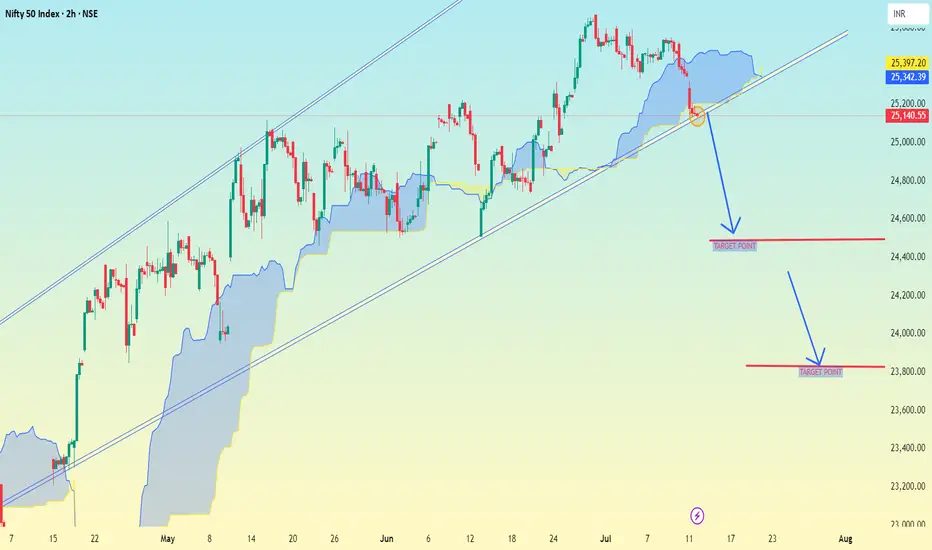
Nifty 50 Index (2h time frame)Nifty 50 Index (2h time frame), here is the analysis and potential target levels:
🔍 Technical Breakdown:
Trendline Break: The chart shows a rising trendline which has been broken to the downside.
Ichimoku Cloud: Price has moved below the cloud, indicating bearish momentum.
Arrows & Levels: Two downward arrows suggest potential drop zones.
🎯 Target Levels (as marked on chart):
1. First Target Zone:
📍 Around 24,400
Likely first support zone / take-profit level after breakdown.
2. Second Target Zone:
📍 Around 23,800
Deeper correction zone based on prior support and structure.
✅ Summary:
If the breakdown sustains below the trendline and cloud:
Immediate target: 24,400
Extended target: 23,800
Let me know if you want stop-loss ideas or a risk/reward plan for this trade.
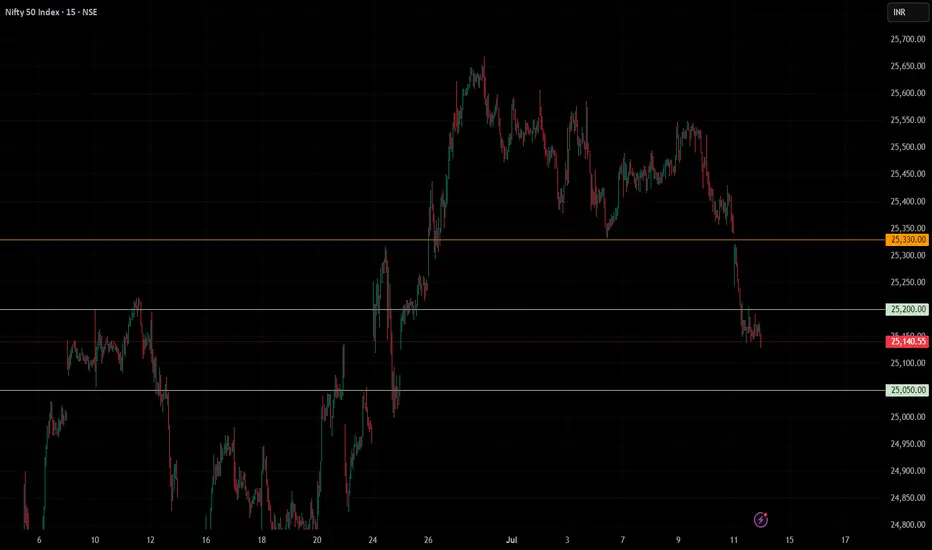
NIFTY BROKE DOWN SUPPORT LEVEL,BUT SOME BOUNCE BACK IS EXPECTEDNIFTY Analysis Update
Recent Price Action
- The **25330** level acted as a significant support zone, as discussed previously.
- The market opened with a gap down below 25330, confirming bearish pressure.
- The next anticipated support at **25200** was also breached, and the session closed below this level.
- With these supports broken, the **25050–25000** range is now identified as the next key support zone.
Technical Indicators
- The **Relative Strength Index (RSI)** is showing extreme oversold conditions across smaller timeframes.
- Such oversold readings typically suggest the potential for a technical bounce or reversal, as selling momentum may be exhausted.
Outlook for Monday
- Given the oversold RSI, there is a heightened probability of a **reversal or bounce** on Monday.
- A rebound towards the **25500-25700** zone is possible, which could serve as a near-term resistance or top before the next directional move.
- If the market manages to close in green, it would confirm the short-term reversal thesis.
Key Levels to Watch
25330: Previous major support (broken)
25200: Next support (broken)
25050–25000: Current support zone
25500-25700: Potential bounce/reversal target
Summary
- **Immediate trend:** Bearish pressure persists after key supports were broken.
- **Short-term outlook:** Oversold conditions suggest a potential bounce; watch for a move toward 25700.
- **Risk:** Failure to hold 25000 could trigger further downside.
Monitor price action closely around the support and resistance zones, and watch for confirmation of reversal signals on Monday.
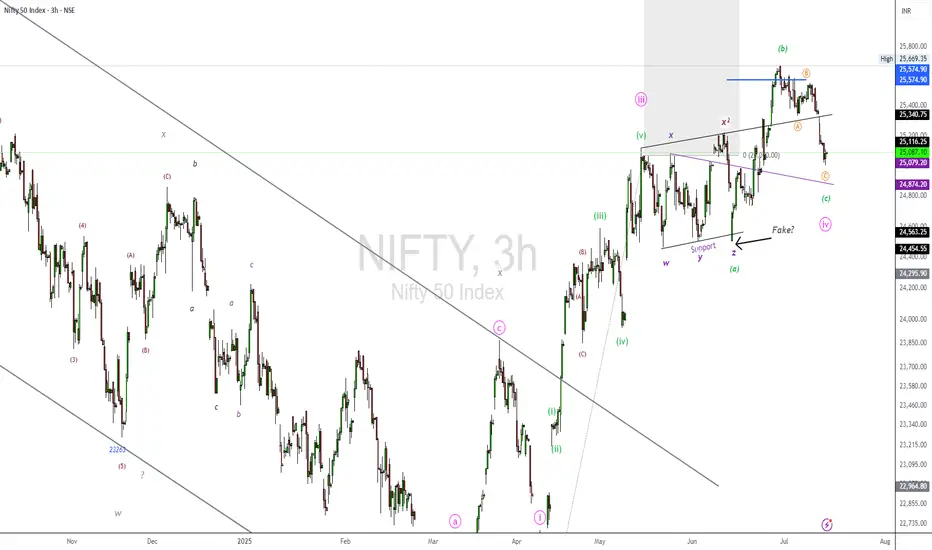
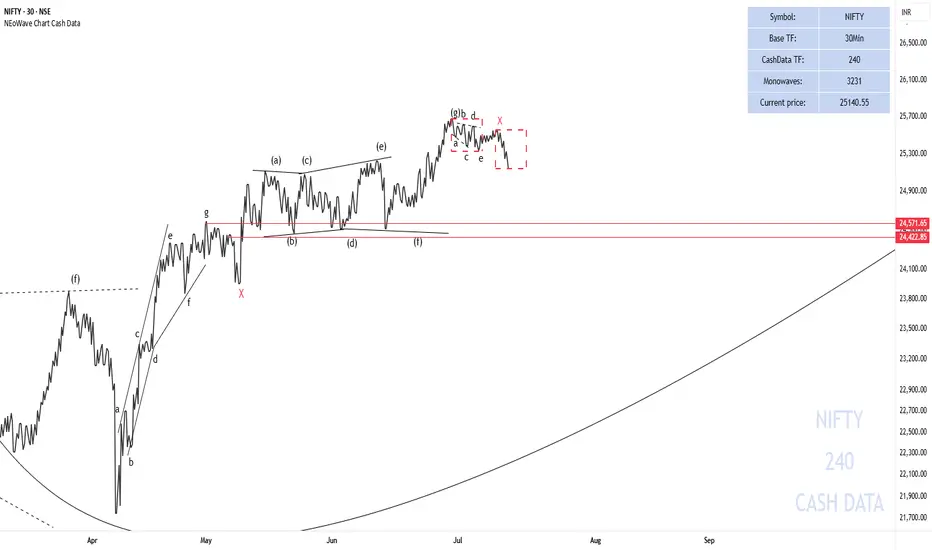
Will NIFTY make a price correction?
My first scenario is still valid and I think it is more likely to happen. It seems that Wave-g has ended from the second pattern and I think NIFTY50 will decline at least to the price range of the X-wave and there we need to check the waves again to see what pattern is forming. To confirm this scenario, a break below the key level of 25000 is very important.
I have also proposed a second scenario that this correction may be an X-wave and after that the price can eventually grow to 25680-26133 and spend time there to complete the third pattern. This scenario is also valid as long as the price remains above the level of 25000.
The price correction that is forming can be a double combination pattern like triangle - X - diametric or triangle - X - triangle.
Good luck
NEoWave Chart
Good luck
NEoWave Chart
Nifty levels - Jul 14, 2025Nifty support and resistance levels are valuable tools for making informed trading decisions, specifically when combined with the analysis of 5-minute timeframe candlesticks and VWAP. By closely monitoring these levels and observing the price movements within this timeframe, traders can enhance the accuracy of their entry and exit points. It is important to bear in mind that support and resistance levels are not fixed, and they can change over time as market conditions evolve.
The dashed lines on the chart indicate the reaction levels, serving as additional points of significance to consider. Furthermore, take note of the response at the levels of the High, Low, and Close values from the day prior.
We hope you find this information beneficial in your trading endeavors.
* If you found the idea appealing, kindly tap the Boost icon located below the chart. We encourage you to share your thoughts and comments regarding it.
Wishing you success in your trading activities!

Levels for Nifty - 11 July 20251. Long once 25415 - 25440 is broken for target of 25541 and second target of 25610.
2. Short only after the support zone of 25336 - 25291 is broken for target of 25165 and second target of 25000.
3. No trading zone with be todays range of 25340-25410