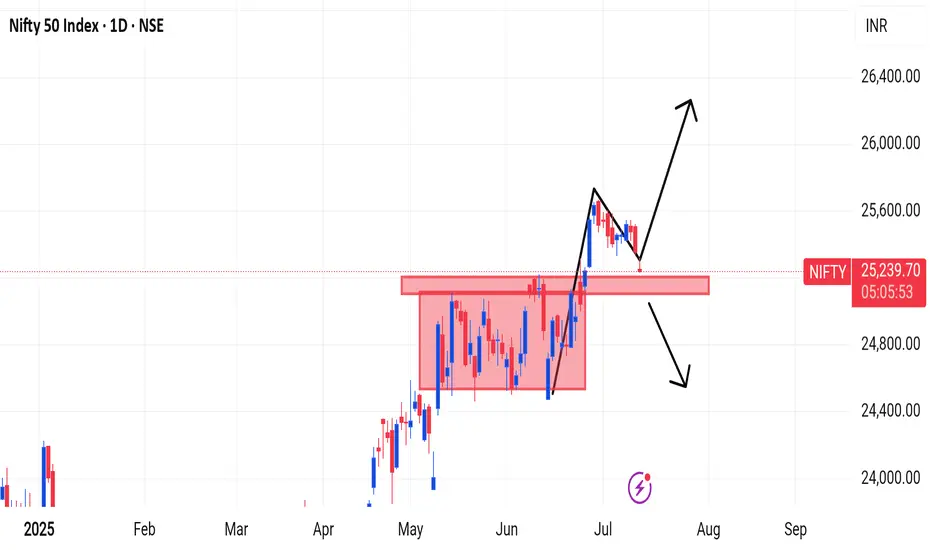
NIFTY 1. Rectangle Box (Sideways Zone)
Nifty had earlier made a strong range-bound consolidation around 24,400 -25,000.
This has now become a strong support zone (red shaded area).
2. Breakout & Retest Pattern:
Nifty then broke out of this zone and went to around 25,600.
Now it is retesting the same old resistance (now support).
3. Price Action Zones:
Support Zone: 24,950 25,100
Resistance Zone: 25,600 - 25,800
If you find this helpful and want more FREE forecasts in TradingView, Hit the 'BOOST' button
Drop some feedback in the comments below! (e.g., What did you find most useful?
How can we improve?)
Your support is appreciated!
Now, it's your turn!
Be sure to leave a comment; let us know how you see this opportunity and forecast.
Have a successful week
DISCLAIMER: I am NOT a SEBI registered advisor or a financial adviser. All the views are for educational purpose only
NIFTY trade ideas
#Nifty directions and levels for July 11th:Good morning, Friends! 🌞
Here are the market directions and levels for July 11th:
There have been no major changes in the global market. It has been maintaining a moderately bearish sentiment, and our local market is also showing a moderately bearish tone. Gift Nifty is supporting this view by indicating a gap-down start of around 110 points.
So, what can we expect today?
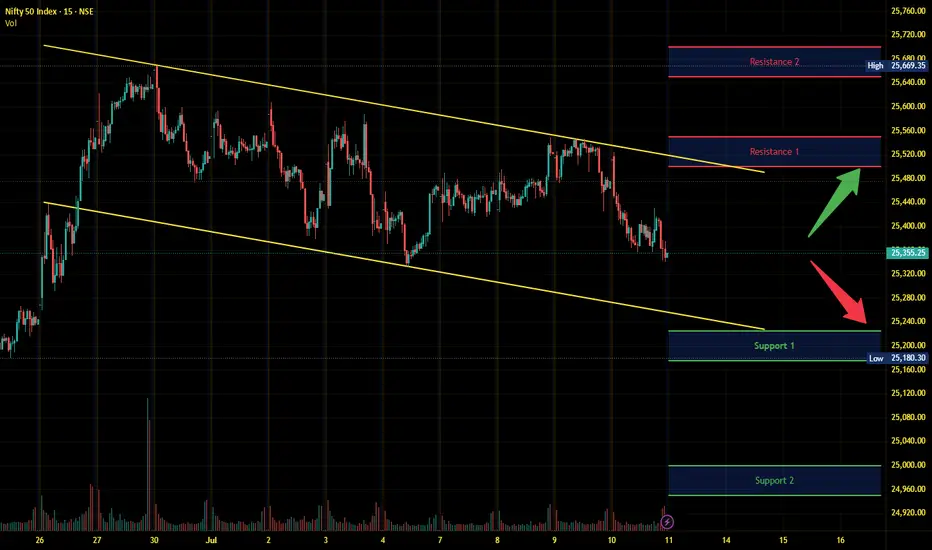
In the higher time frame, the market still holds a bullish bias, however, the lower time frame reflects bearish sentiment.
If we analyze this with chart patterns, it appears to be forming a channel pattern. So, if the market finds support near the bottom of this channel, it may take a pullback after the gap-down, which would mean the channel pattern may continue further.
On the other hand, if the market declines sharply or consolidates near the channel bottom, then the correction is likely to continue.
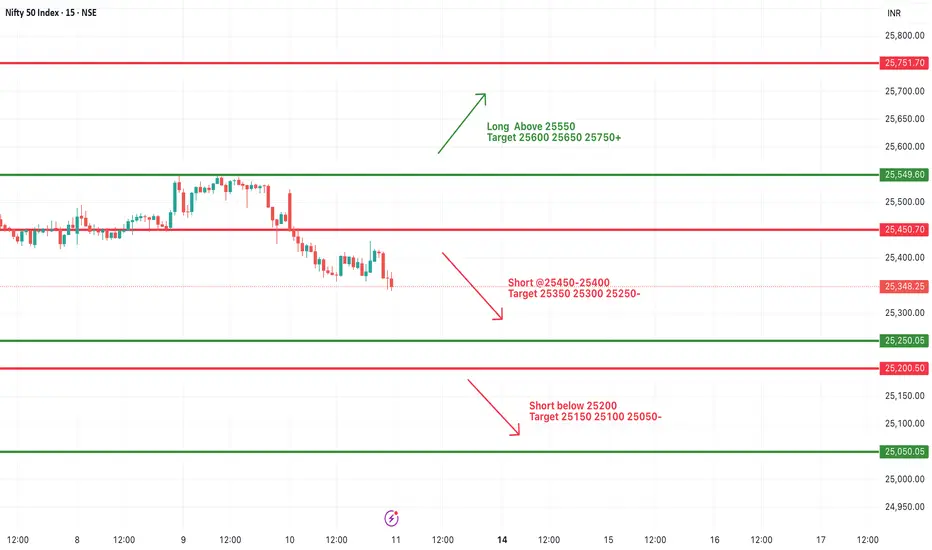
#NIFTY Intraday Support and Resistance Levels - 11/07/2025Nifty is likely to open on a flat note today, continuing the weakness seen in the recent sessions. The index has shown a consistent downward move after facing resistance near the 25550 zone. If Nifty sustains below the 25450–25400 range, it may trigger further bearish momentum with immediate targets at 25350, 25300, and 25250. Breaching 25200 could lead to further downside toward 25150, 25100, and 25050 levels.
On the other hand, any sharp reversal and breakout above 25550 may revive bullish sentiment. Sustaining above this level can push the index toward 25600, 25650, and 25750+. However, upside movement will require strong buying interest and volume support.
Overall, the broader trend remains weak unless a clear breakout occurs. Traders are advised to trade with caution, wait for directional confirmation, and use strict stop-loss to manage risks in this volatile environment.
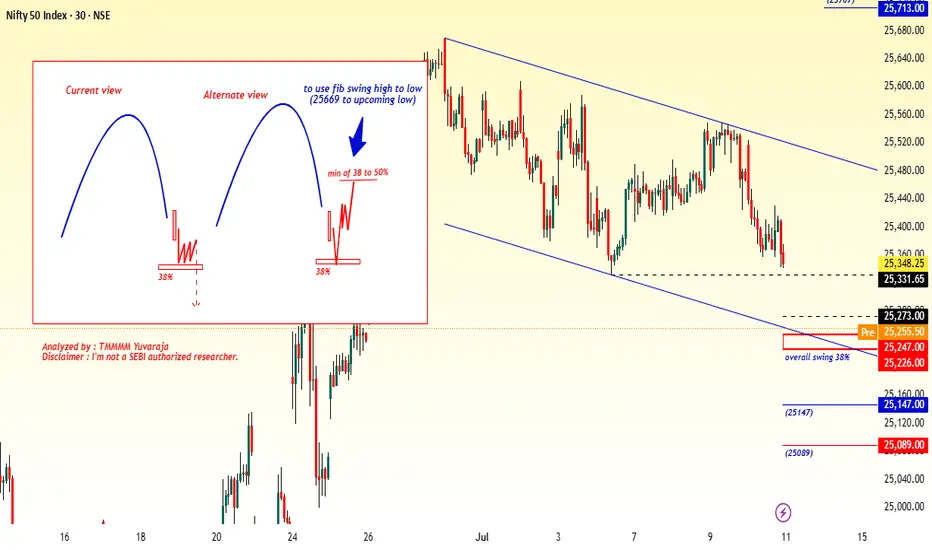
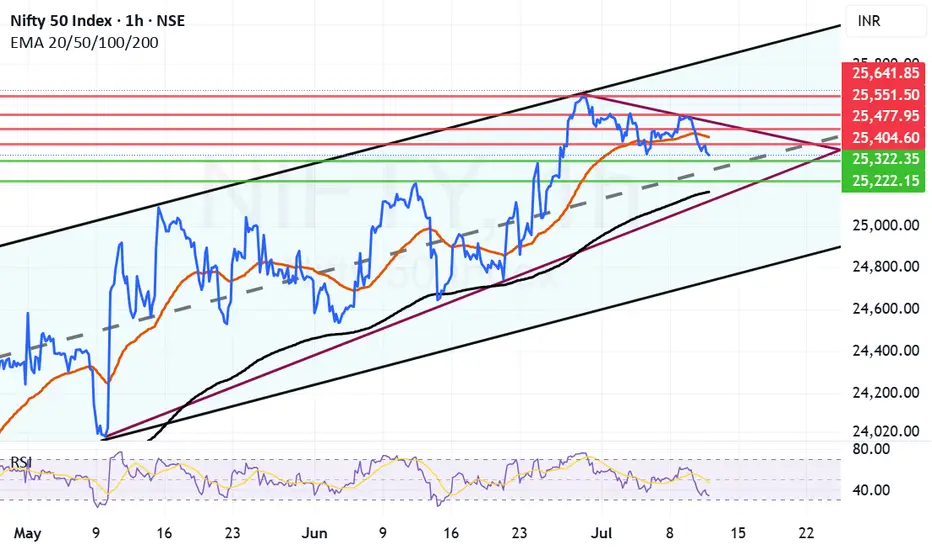
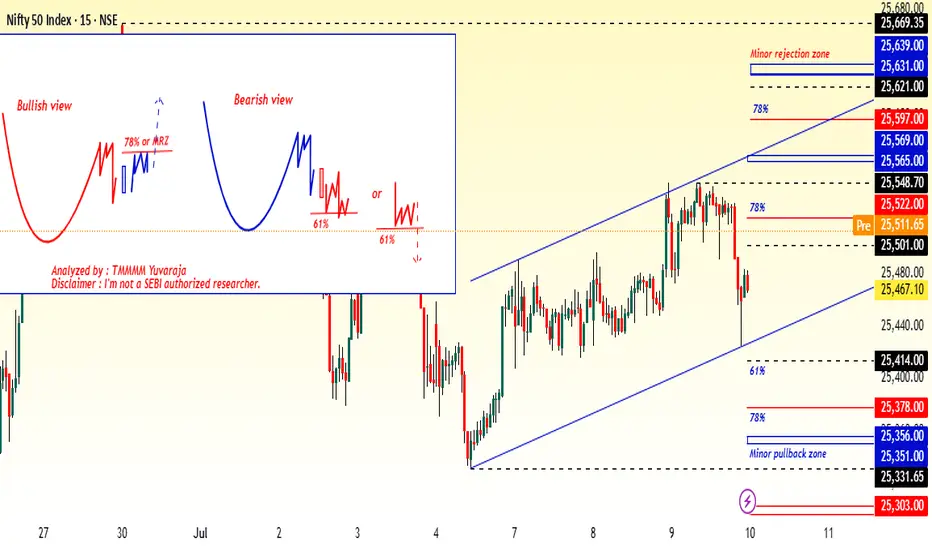
Nifty approaching Mid-channel support zone now. Nifty after a 120 point negative closing is entering an important support zone. This support zone has 3 layers. The First of the support lies at 25322 which is just above the mid-channel. The second for Nifty is near 25222 which is just below the mid channel support.
There is a possibility of bounce either from the current level or either of these 2 levels. If we get a closing below 25322 then there is a possibility that bears might try to pull Nifty down towards 25167 which is the Father line or 200 Hours EMA.
The resistances for Nifty remain at 25404, 25437 which is the Mother line or 50 hours EMA. Post that there are resistances at 25477, 25551 and 25641. Closing above 25641 is required for Nifty to fly towards 26K levels.
Disclaimer: The above information is provided for educational purpose, analysis and paper trading only. Please don't treat this as a buy or sell recommendation for the stock or index. The Techno-Funda analysis is based on data that is more than 3 months old. Supports and Resistances are determined by historic past peaks and Valley in the chart. Many other indicators and patterns like EMA, RSI, MACD, Volumes, Fibonacci, parallel channel etc. use historic data which is 3 months or older cyclical points. There is no guarantee they will work in future as markets are highly volatile and swings in prices are also due to macro and micro factors based on actions taken by the company as well as region and global events. Equity investment is subject to risks. I or my clients or family members might have positions in the stocks that we mention in our educational posts. We will not be responsible for any Profit or loss that may occur due to any financial decision taken based on any data provided in this message. Do consult your investment advisor before taking any financial decisions. Stop losses should be an important part of any investment in equity.
Nifty Analysis EOD – July 10, 2025 – Thursday🟢 Nifty Analysis EOD – July 10, 2025 – Thursday 🔴
"False Hopes, True Drop – Bears Tighten Their Grip"
Nifty opened with a mild 50-point gap-up, but within the very first minute, that optimism was crushed. It dropped nearly 100 points, breaching the previous day’s low, and entered the key support zone of 25405–25418, which held briefly for about half an hour.
But this wasn’t a day for bulls.
After a weak attempt to recover from the 25360 support (which held twice intraday), sellers regained momentum, dragged the index further down, and finally closed at the lowest point of the day – 25348.
🔸 Expiry volatility played its part — trapping option buyers and luring them into false reversals.
🔸 However, quick scalpers and intraday short-sellers likely capitalized well.
🔸 The structure was decisively bearish, with no meaningful intraday bounce.
Tomorrow becomes crucial.
Bulls have one last stronghold at the 25300 level.
Bears, already in charge, may extend the damage further if this breaks.
⚠️ Bias Levels:
🟢 Bullish above: 25420
🔴 Bearish below: 25290
⚪ Between = Neutral / Watch Mode
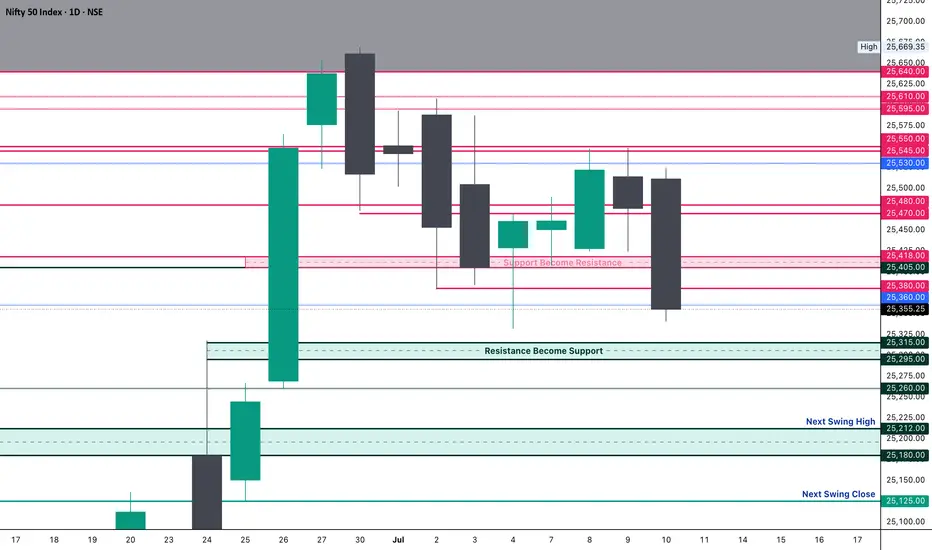
🕯 5 Min Time Frame Chart with Intraday Levels
🕯 Daily Time Frame Chart with Intraday Levels
🕯 Daily Candle Breakdown
Open: 25,511.65
High: 25,524.05
Low: 25,340.45
Close: 25,355.25
Change: −120.85 (−0.47%)
📊 Candle Structure Breakdown
Real Body: 156.40 points – large red candle
Upper Wick: 12.40 points – minimal bullish push
Lower Wick: 14.80 points – bears kept pressure till close
🔍 Interpretation
Bears took over early and never let go
The close at day low shows strong conviction from sellers
Lack of significant wicks → no real fight from bulls
🕯 Candle Type
Bearish Marubozu-style candle – clear sign of dominance by sellers, and potential for continuation if no quick reversal
📌 Key Insight
Market is in a critical zone — hovering above the edge of deeper correction
25300–25290 is the line in the sand
A breakdown below can target 25,200–25,250
Bulls can only regain momentum above 25,420
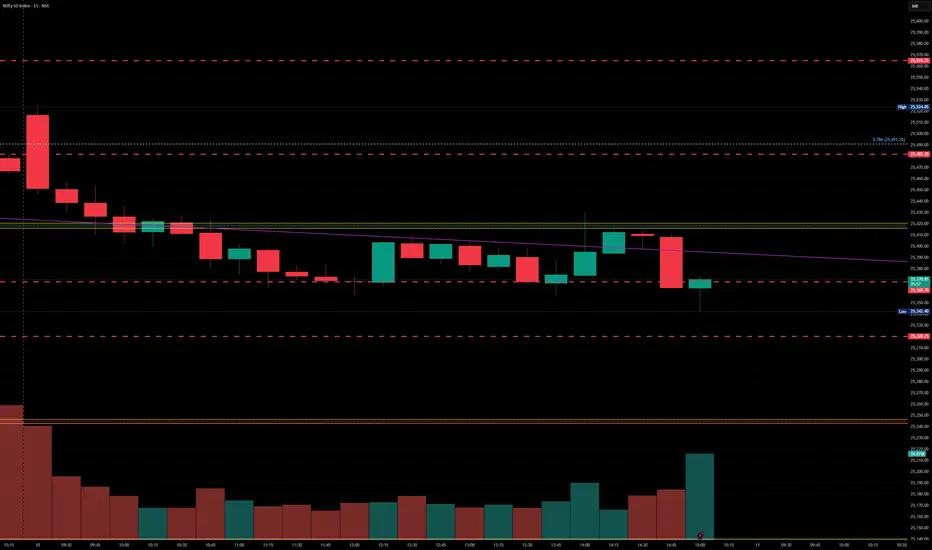
🛡 5 Min Intraday Chart
⚔️ Gladiator Strategy Update
ATR: 189.49
IB Range: 113.75 → Medium IB
Market Structure: 🟡 Balanced
Trades Triggered
10:52 AM – Short Trade → 🎯 Trail SL Hit (R:R 1:0.38)
📌 Support & Resistance Zones
Resistance Levels
25,380
25,405 ~ 25,418
25,470 ~ 25,480
25,530
25,545 ~ 25,550
Support Levels
25,315 ~ 25,295
25,260
25,212 ~ 25,180
25,125
💭 Final Thoughts
"Expiry days often blur the picture, but today’s price action was sharp. Unless bulls step up quickly, the breakdown may just be getting started."
✏️ Disclaimer
This is just my personal viewpoint. Always consult your financial advisor before taking any action.
Nifty Intraday Analysis for 11th July 2025NSE:NIFTY
Index has resistance near 25500 – 25550 range and if index crosses and sustains above this level then may reach near 25650 – 25700 range.
Nifty has immediate support near 25225 – 25175 range and if this support is broken then index may tank near 25000 – 24950 range.
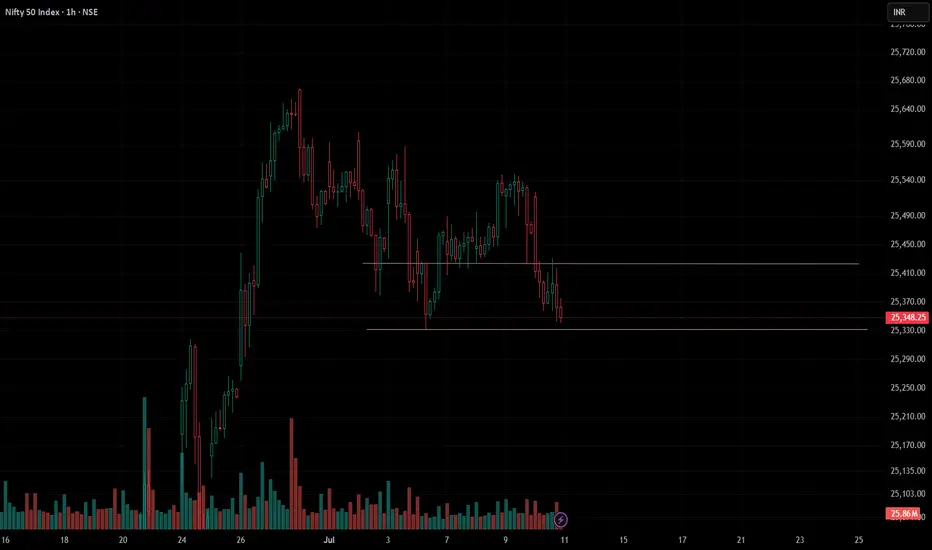
Nifty unable to sustain breakoutNifty was unable to sustain breakout. Nifty fell down and closed near it support zone, will need to hold 25330. Below it nifty can feel more pressure. To get back into uptrend need to close above 25430.
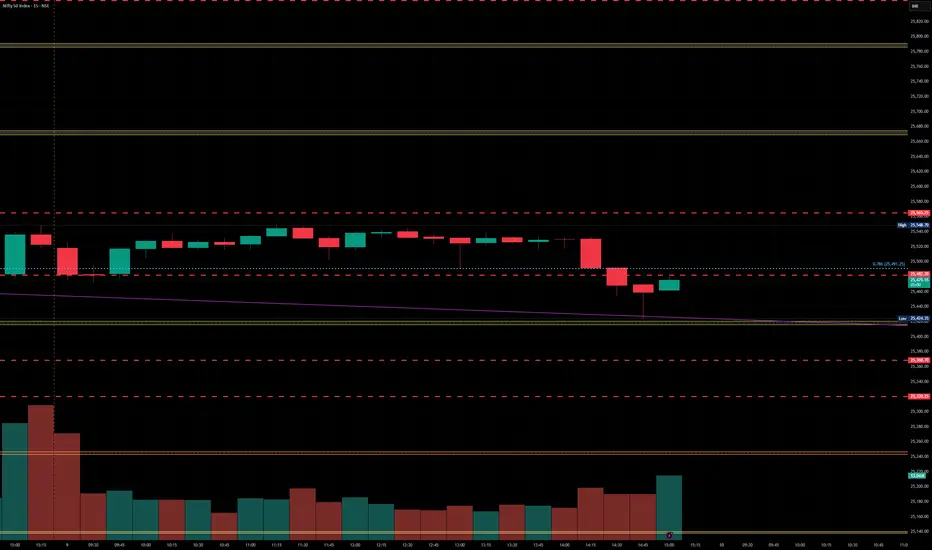
Nifty levels - Jul 11, 2025Nifty support and resistance levels are valuable tools for making informed trading decisions, specifically when combined with the analysis of 5-minute timeframe candlesticks and VWAP. By closely monitoring these levels and observing the price movements within this timeframe, traders can enhance the accuracy of their entry and exit points. It is important to bear in mind that support and resistance levels are not fixed, and they can change over time as market conditions evolve.
The dashed lines on the chart indicate the reaction levels, serving as additional points of significance to consider. Furthermore, take note of the response at the levels of the High, Low, and Close values from the day prior.
We hope you find this information beneficial in your trading endeavors.
* If you found the idea appealing, kindly tap the Boost icon located below the chart. We encourage you to share your thoughts and comments regarding it.
Wishing you success in your trading activities!
Levels for Nifty - 10 July 2025As the market was in the range of 25548-25425 i.e. traded within the support and resistance, one can plan long/ short:
1. Long once 25560 is broken for target of 25580 and second target of 25610.
2. Short only after the strong support zone of 25415 is broken for target of 25370 and second target of 25336. Do keep in mind of the trendline which will act as support
3. No trading zone with be todays range of 25548-25425

#Nifty directions and levels for July 10th:Good morning, Friends! 🌞
Here are the market directions and levels for July 10th:
The global market has a moderately bearish sentiment, while our local market is showing a moderately bullish sentiment.
Meanwhile, Gift Nifty is indicating a neutral to slightly gap-down start.
So, what can we expect today?
Structurally, we are still in a range with a moderately bullish bias. So, until the range is broken, we may not get any clear direction.
However, my expectation is that if the market initially pulls back, it could continue the rally with some consolidation.
In this case, if a solid structure forms, we can expect a longer rally.
On the other hand, if the market declines and finds support around the immediate support level, it may continue to stay in the range.
Or, if a solid structure forms on the downside, then the correction is likely to continue.
#NIFTY Intraday Support and Resistance Levels - 10/07/2025Nifty is also expected to open flat today, reflecting a similar consolidation pattern observed in recent sessions. The index continues to trade within a tight range, signaling indecisiveness among traders and lack of strong directional momentum.
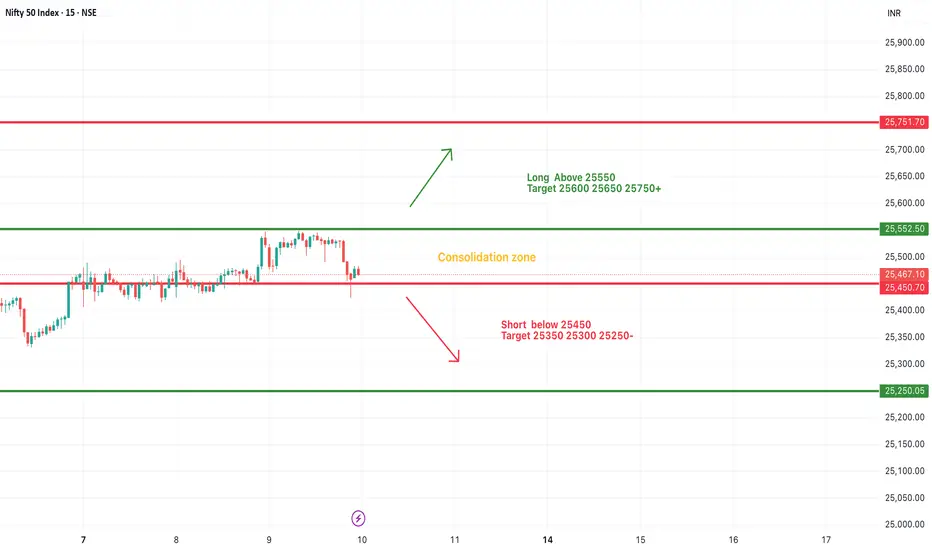
Currently, Nifty is oscillating in a consolidation zone between 25550 resistance and 25450 support. A breakout above 25550 could trigger fresh long entries, with potential upside targets at 25600, 25650, and 25750+. Sustained strength above 25750 may open the way for extended bullish movement.
Conversely, a breakdown below the 25450 level may lead to short opportunities, with downside targets at 25350, 25300, and 25250-.
Until the index decisively breaks out of this range, sideways movement is likely to persist. Traders should wait for confirmation before taking aggressive directional positions.
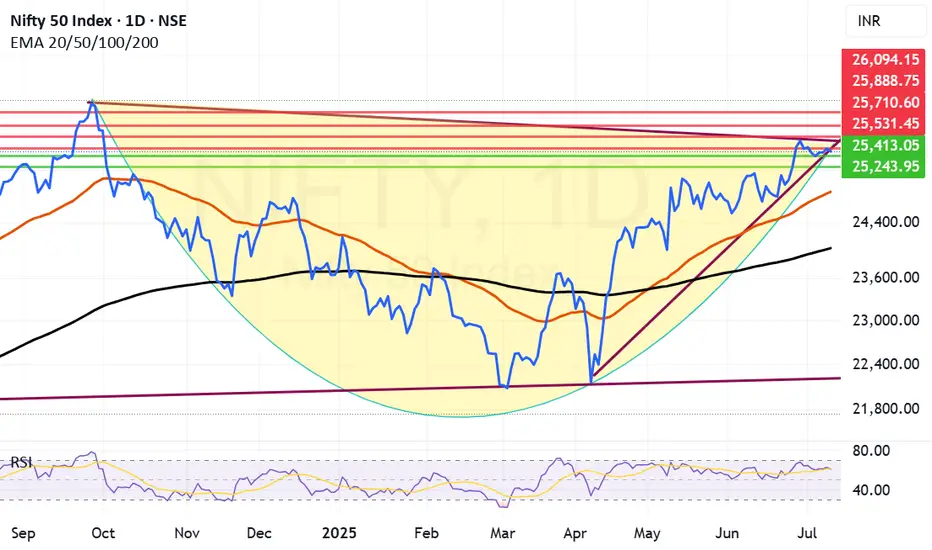
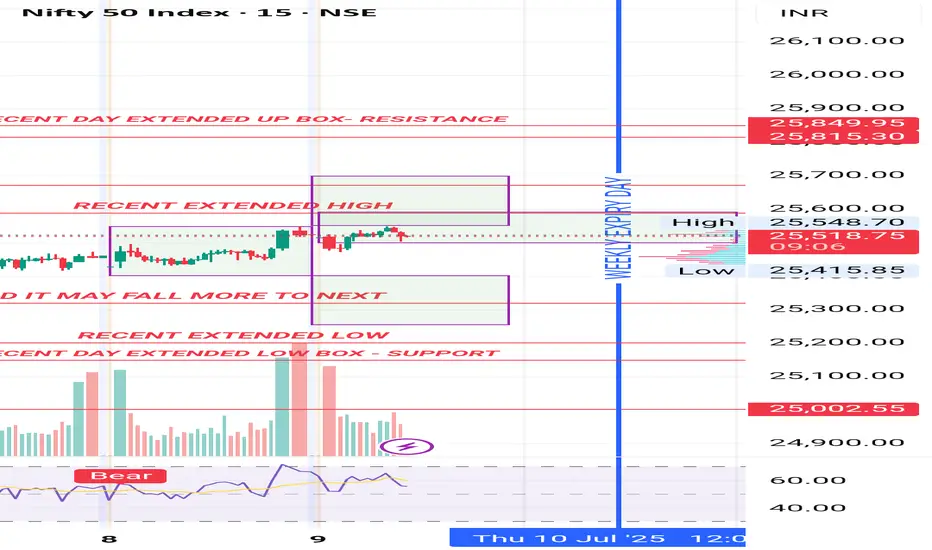
Range Bound consolidation going on in the market. Range bound consolidation is going on in the market. As you can see in the chart there is consolidation going on before a substantial up or down move happens. Mostly it looks like Tariff negation deadline will be extended or India might end up getting the tariff deal sealed. all eyes on Trump and TCS results tomorrow. TCS has been reeling close to an year now after making a high of 4592 everything depends on the result tomorrow. The result can give direction to the market as TCS has good weightage (Around 6.09% in Nifty and 7.43% in BSE Sensex). TCS has 21.93% Weightage in Nifty IT index so the result tomorrow is a must watch. It can give direction to the It index as well.
Supports for Nifty remain at 25413 and 25243. If by chance this level is broken Nifty can fall further towards Mother line which is at 24862 or in worst case scenario towards Father line of daily chart at 24030.
Resistances for Nifty remain at: 25531 and 25710 Closing above which Nifty becomes very strong. After we get a closing above 25710 Nifty can swiftly move towards 25888 or even 26K+ levels.
Disclaimer: The above information is provided for educational purpose, analysis and paper trading only. Please don't treat this as a buy or sell recommendation for the stock or index. The Techno-Funda analysis is based on data that is more than 3 months old. Supports and Resistances are determined by historic past peaks and Valley in the chart. Many other indicators and patterns like EMA, RSI, MACD, Volumes, Fibonacci, parallel channel etc. use historic data which is 3 months or older cyclical points. There is no guarantee they will work in future as markets are highly volatile and swings in prices are also due to macro and micro factors based on actions taken by the company as well as region and global events. Equity investment is subject to risks. I or my clients or family members might have positions in the stocks that we mention in our educational posts. We will not be responsible for any Profit or loss that may occur due to any financial decision taken based on any data provided in this message. Do consult your investment advisor before taking any financial decisions. Stop losses should be an important part of any investment in equity.
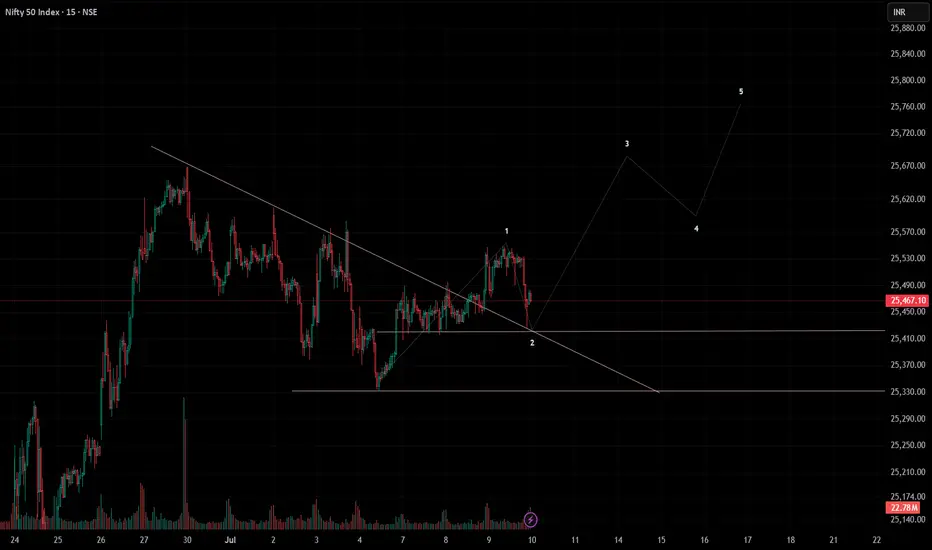
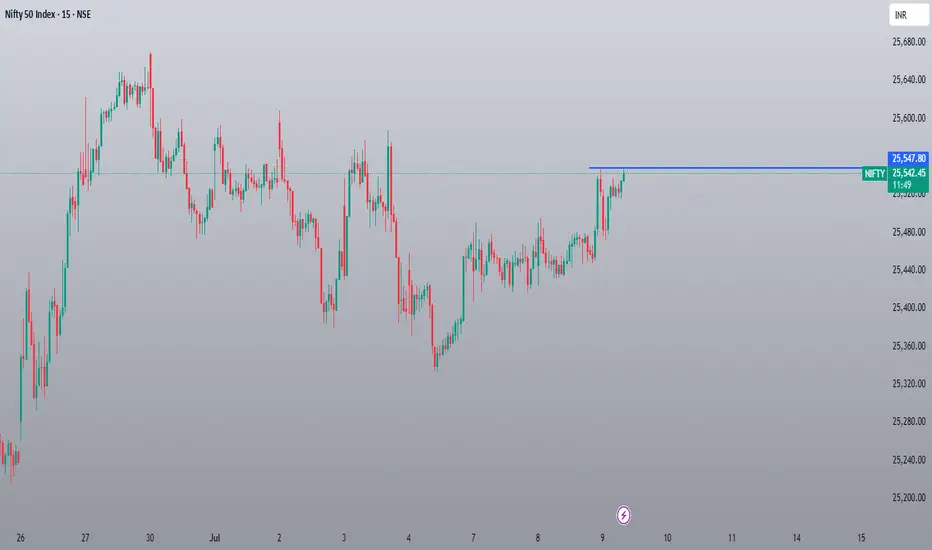
NIFTY took support from the retest zoneNifty bounced back from the retest zone and closed above the breakout.
Trend will change closing below 25420, until then the wave count stands valid. Nifty can move towards 25700-25750 until these levels hold.
nifty going to down that chart say level sabke nikalte h. ye bat ham bta rhe h.nifty going to down because here chart say about it and this point is also strong after deal not success with USA. so be careful to going on trend

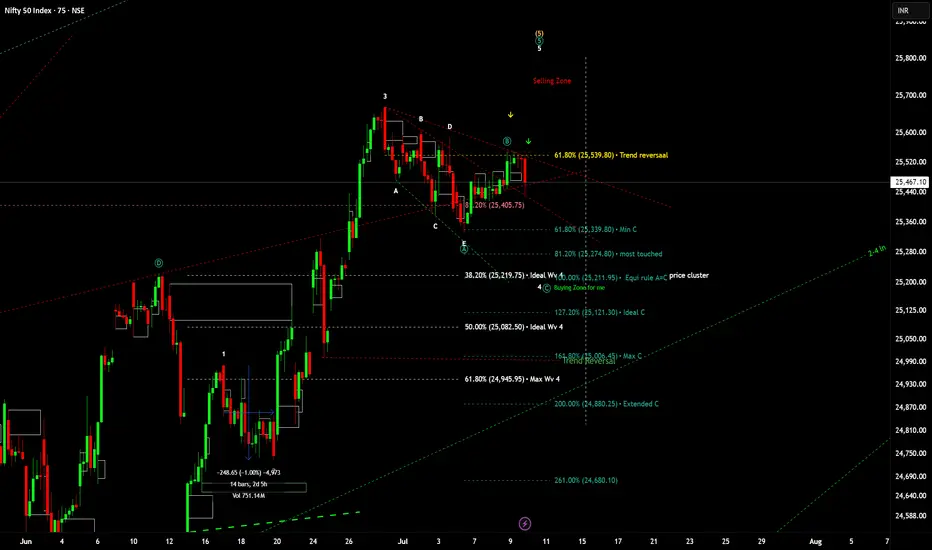
nifty analysis 4r study purpose,not a buy or sell recommendation my post mkt nifty analysis... my view was bearish today and it will be bearish till July 10th or 15th(as per time analysis) .
Above statement will change if nifty closes above 61.8%(trend reversal point.) on 25 min and abv TF. This is just my view for study purpose pls don't trade only based on this.....🙏🏻🤞🏻
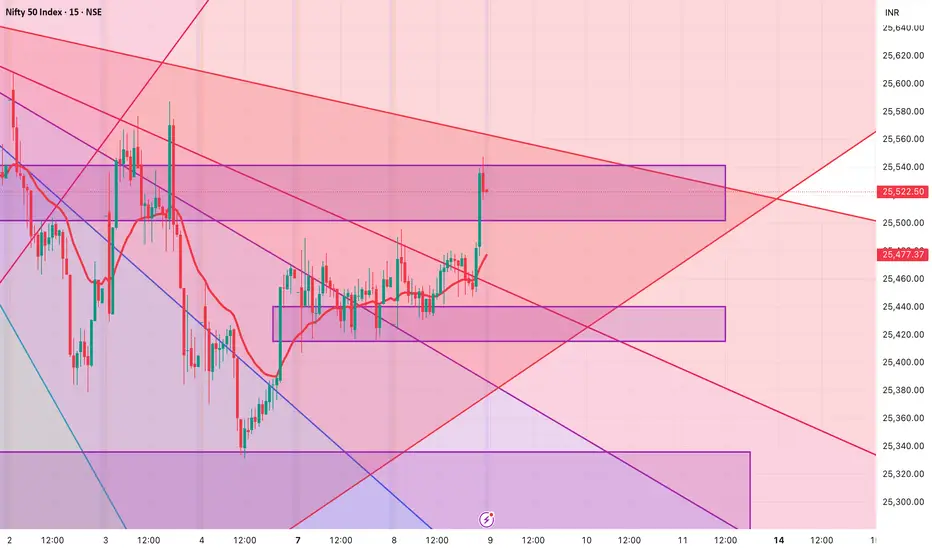
Levels for Nifty tomorrow - 09 July 2025Please watch out for levels in Nifty for 09 July 2025
1. Long once 25542/50 for target of 25580 and second target of 25610.
2. Short only after the strong support zone of 25415 is broken for target of 25370 and second target of 25336.
3. 25523-25440 are the no trade/ sideways zone. However, if a strong rejection candle is formed at either of the zones, they can be traded accordingly.
Please check the trendline (8/1) crossing above. Also monitor the volume in the Futures chart for aggressive targets.
Nifty levels - Jul 10, 2025Nifty support and resistance levels are valuable tools for making informed trading decisions, specifically when combined with the analysis of 5-minute timeframe candlesticks and VWAP. By closely monitoring these levels and observing the price movements within this timeframe, traders can enhance the accuracy of their entry and exit points. It is important to bear in mind that support and resistance levels are not fixed, and they can change over time as market conditions evolve.
The dashed lines on the chart indicate the reaction levels, serving as additional points of significance to consider. Furthermore, take note of the response at the levels of the High, Low, and Close values from the day prior.
We hope you find this information beneficial in your trading endeavors.
* If you found the idea appealing, kindly tap the Boost icon located below the chart. We encourage you to share your thoughts and comments regarding it.
Wishing you success in your trading activities!
Nifty 50 Maybe Face RejectionCurrently, Nifty 50 appears to be experiencing rejection on its chart. An upside movement should be anticipated only if Nifty 50 remains above this observed level. Conversely, it would be advisable to avoid purchasing options premiums, as they are likely to depreciate if the market consolidates within its current range.
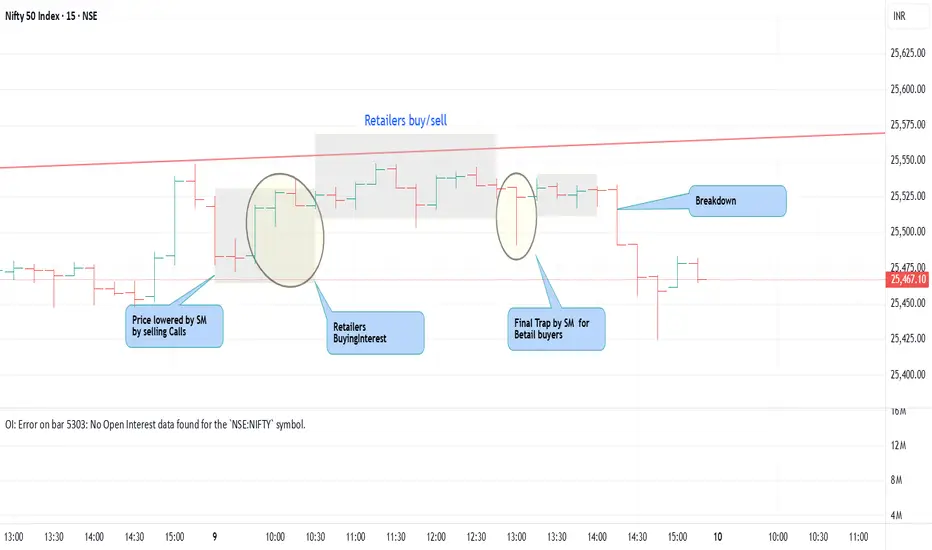
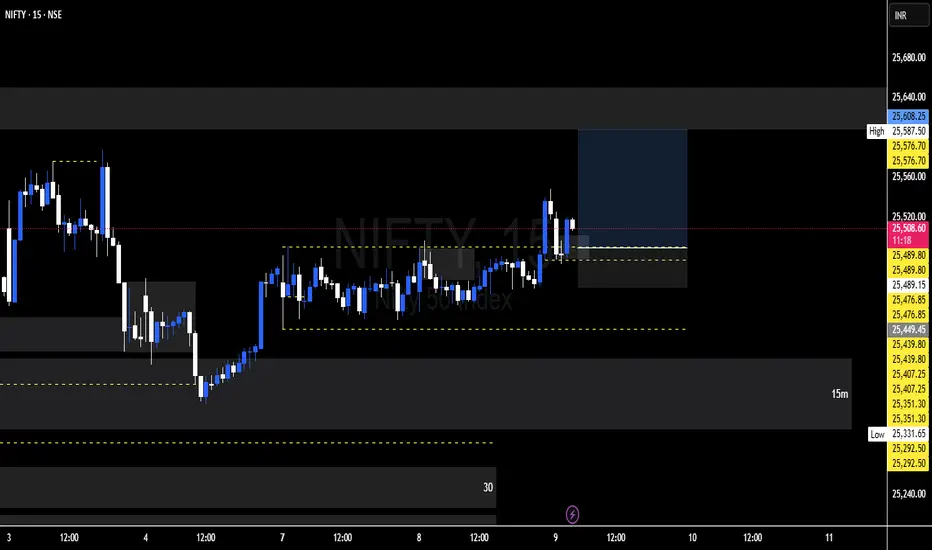
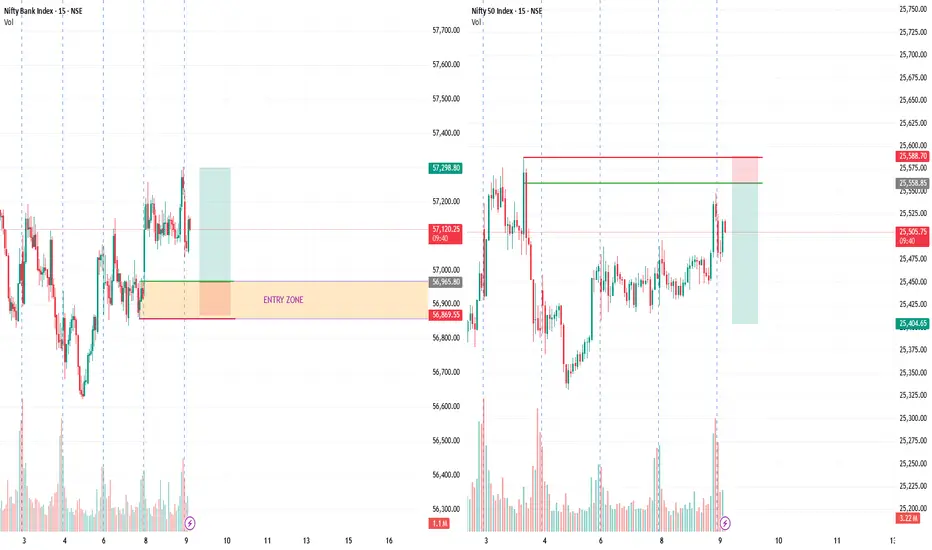
NIFTY AND BANK NIFTY OVERVIEWBoth the NIFTY 50 and BANK NIFTY indices are currently displaying major Order Block formations on the 15-minute timeframe. These institutional-level support and resistance zones indicate potential areas where significant buying or selling pressure may emerge.
#NIFTY Intraday Support and Resistance Levels - 09/07/2025Nifty is expected to open slightly gap up around the 25500–25520 zone, showing positive momentum from the previous day’s breakout above its recent consolidation range. If the index sustains above the 25550 level, we can expect bullish continuation toward the upside targets of 25600, 25650, and 25750+ levels. This zone may act as an intraday breakout trigger.
On the downside, 25450 will now act as immediate support. Any sharp move below 25450 could invite selling pressure, and we may see a downside slide toward 25350, 25300, and 25250-. The trend remains mildly bullish above 25550, while below 25450 the trend may turn weak intraday.
