NUVAMA : Opened a position with 1% riskEntered the position immediately at the close of the strong bullish momentum candle that broke the ATH levels.
📢📢📢
If my perspective changes or if I gather additional fundamental data that influences my views, I will provide updates accordingly.
Thank you for following along with this journey, and I remain committed to sharing insights and updates as my trading strategy evolves. As always, please feel free to reach out with any questions or comments.
Other posts related to this particular position and scrip, if any, will be attached underneath. Do check those out too.
Disclaimer : The analysis shared here is for informational purposes only and should not be considered as financial advice. Trading in all markets carries inherent risks, and past performance is not indicative of future results. It’s essential to conduct your own research and assess your risk tolerance before making any investment decisions. The views expressed in this analysis are solely mine. It’s important to note that I am not a SEBI registered analyst, so the analysis provided does not constitute formal investment advice under SEBI regulations.
NUVAMA trade ideas

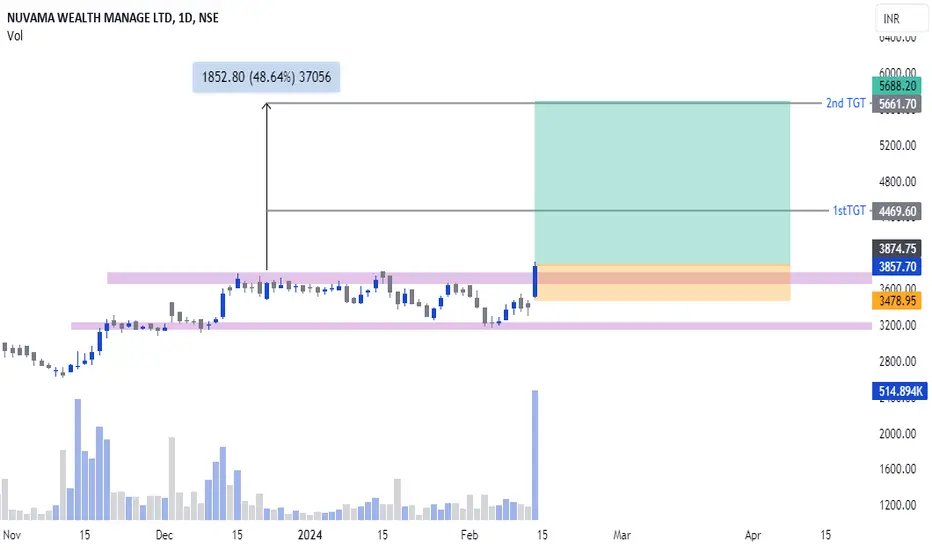
Amazing breakout on WEEKLY Timeframe - NUVAMACheckout an amazing breakout happened in the stock in Weekly timeframe, macroscopically seen in Daily timeframe. Having a great favor that the stock might be bullish expecting a staggering returns of minimum 25% TGT. IMPORTANT BREAKOUT LEVELS ARE ALWAYS RESPECTED!
NOTE for learners: Place the breakout levels as per the chart shared and track it yourself to get amazed!!
#No complicated chart patterns
#No big big indicators
#No Excel sheet or number magics
TRADE IDEA: WAIT FOR THE STOCK TO BREAKOUT IN WEEKLY TIMEFRAME ABOVE THIS LEVEL.
Checkout an amazing breakout happened in the stock in Weekly timeframe.
Breakouts happening in longer timeframe is way more powerful than the breakouts seen in Daily timeframe. You can blindly invest once the weekly candle closes above the breakout line and stay invested forever. Also these stocks breakouts are lifelong predictions, it means technically these breakouts happen giving more returns in the longer runs. Hence, even when the scrip makes a loss of 10% / 20% / 30% / 50%, the stock will regain and turn around. Once they again enter the same breakout level, they will flyyyyyyyyyyyy like a ROCKET if held in the portfolio in the longer run.
Time makes money, GREEDY & EGO will not make money.
Also, magically these breakouts tend to prove that the companies turn around and fundamentally becoming strong. Also the magic happens when more diversification is done in various sectors under various scripts with equal money invested in each N500 scripts.
The real deal is when to purchase and where to purchase the stock. That is where Breakout study comes into play.
Check this stock which has made an all time low and high chances that it makes a "V" shaped recovery.
> Taking support at last years support or breakout level
> High chances that it reverses from this point.
> Volume dried up badly in last few months / days.
> Very high suspicion based analysis and not based on chart patterns / candle patterns deeply.
> VALUABLE STOCK AVAILABLE AT A DISCOUNTED PRICE
> OPPURTUNITY TO ACCUMULATE ADEQUATE QUANTITY
> MARKET AFTER A CORRECTION / PANIC FALL TO MAKE GOOD INVESTMENT
DISCLAIMER : This is just for educational purpose. This type of analysis is equivalent to catching a falling knife. If you are a warrior, you throw all the knives back else you will be sorrow if it hits SL. Make sure to do your analysis well. This type of analysis only suits high risks investor and whose is willing to throw all the knives above irrespective of any sectoral rotation. BE VERY CAUTIOUS AS IT IS EXTREME BOTTOM FISHING.
HOWEVER, THIS IS HOW MULTIBAGGERS ARE CAUGHT !
STOCK IS AT RIGHT PE / RIGHT EVALUATION / MORE ROAD TO GROW / CORRECTED IV / EXCELLENT BOOKS / USING MARKET CRASH AS AN OPPURTUNITY / EPS AT SKY.
LET'S PUMP IN SOME MONEY AND REVOLUTIONIZE THE NATION'S ECONOMY!

Nse listign affect ??nse listing is on cards and I see stock broking company flying high please check and do your analysis

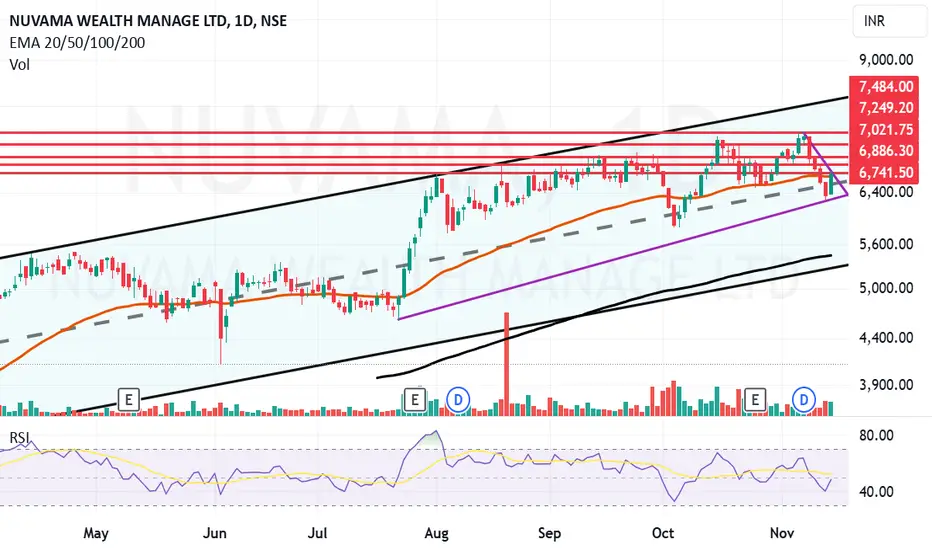
Nuvama wealth Management looking upwards Nuvama Wealth Management Ltd. is a stock broking company, which engages in conducting trading and broking activities for institutional as well as retail clients. It operates through the following segments: Capital Markets, Wealth Management, and Holding Company Activities. The Capital Markets segment includes institutional broking business, merchant banking business, and advisory. The Wealth Management segment distributes financial products and investment advisory.
Nuvama Wealth Management Ltd. CMP is 6727.60. The Negative aspects of the company are high Valuation (P.E. = 28.8), Stocks Underperforming their Industry Price Change in the Quarter, Declining Net Cash Flow : Companies not able to generate net cash and Increasing Trend in Non-Core Income. The positive aspects of the company are Company with Zero Promoter Pledge, MFs increased their shareholding last quarter, Good quarterly growth in the recent results, Strong Annual EPS Growth and Increasing Revenue every Quarter for the past 8 Quarters.
Entry can be taken after closing above 6742 Targets in the stock will be 6886 and 7021. The long-term target in the stock will be 7249 and 7484. Stop loss in the stock should be maintained at Closing below 5446.
Disclaimer: The above information is provided for educational purpose, analysis and paper trading only. Please don't treat this as a buy or sell recommendation for the stock. We do not guarantee any success in highly volatile market or otherwise. Stock market investment is subject to market risks which include global and regional risks. We will not be responsible for any Profit or loss that may occur due to any financial decision taken based on any data provided in this message.
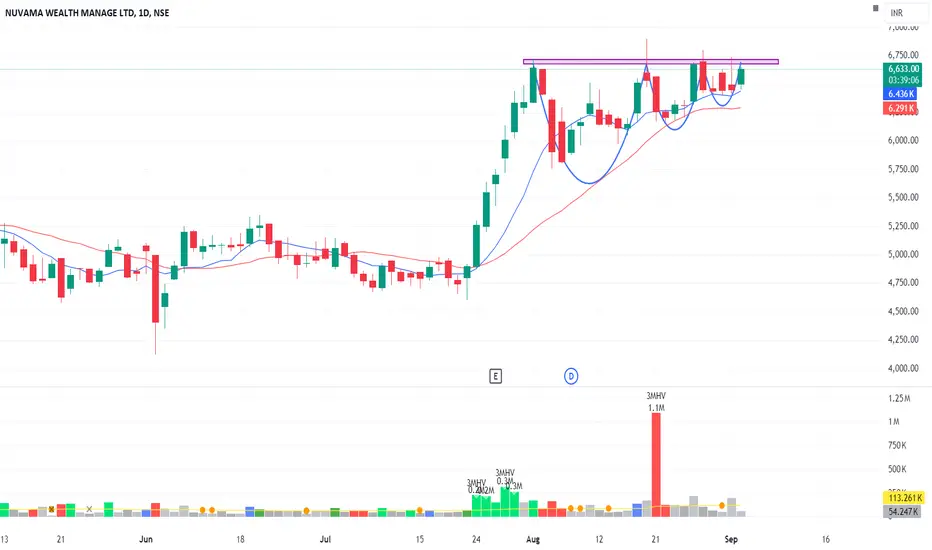
NUVAMA: Classic Bookish VCP setup- Look for a buy Price Action :
- The stock appears to be in an overall uptrend, as evidenced by the higher highs and higher lows visible on the chart. The price has been moving upward with periodic consolidations, which is typical in trending markets.
- Currently, the price is consolidating just below a resistance level around the 6,700-6,750 range. This is a critical level to watch as it has been tested multiple times, but the stock has not been able to break through it yet.
Moving Averages:
- The stock is using both the 9-day and 21-day Simple Moving Averages (SMAs) as support during its uptrend. The 9-day SMA is above the 21-day SMA, indicating that the short-term trend is still bullish.
- The price is currently close to these moving averages, suggesting that the stock might be gearing up for its next move, whether it be a breakout above resistance or a pullback.
Volume:
- Volume analysis shows a significant spike in one of the red bars, indicating strong selling pressure at that point. However, after that spike, the volume seems to have decreased, which is often a sign of consolidation.
- The stock is likely building up pressure, and an increase in volume during the next move (especially a breakout above resistance) would be a strong signal of the market's direction.
Key Levels:
- Support : The immediate support level is around the 6,150-6,200 range, where the price has found some stability recently.
- Resistance : The key resistance level to watch is around 6,700-6,750. A break above this level with strong volume could indicate a continuation of the uptrend.
Potential Scenarios :
1. Bullish Scenario : If the stock breaks above the 6,750 resistance with increased volume, it could trigger a new leg up in the ongoing uptrend. This could attract more buyers, potentially pushing the price higher.
2. Bearish Scenario : If the stock fails to break through the resistance and falls below the support level of 6,420-6,300, it could indicate a deeper correction or even a trend reversal. In that case, the next support levels would become crucial.
Its classic bookish vcp setup, we can plan low chit entry.
NUVAMA WEALTH MANAGE LTDThis stock breakout some of consolidation level so stock has been create good opportunity for swing trade and this is only for educational purpose

Cup Breakoutthe stock was corrected for 5 weeks forming the base of the cup and retested the listing day high and volume accumulation is decently high and the risk is also less than 10%.
