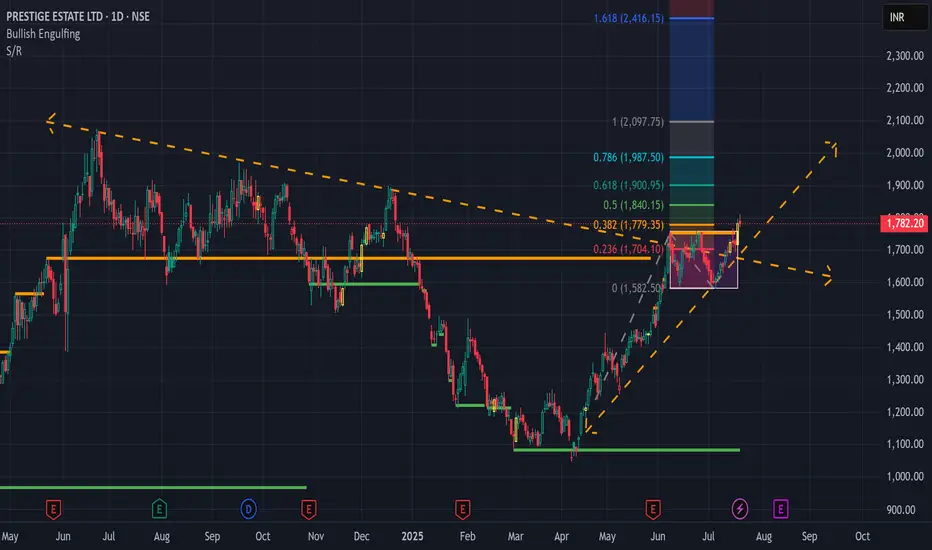
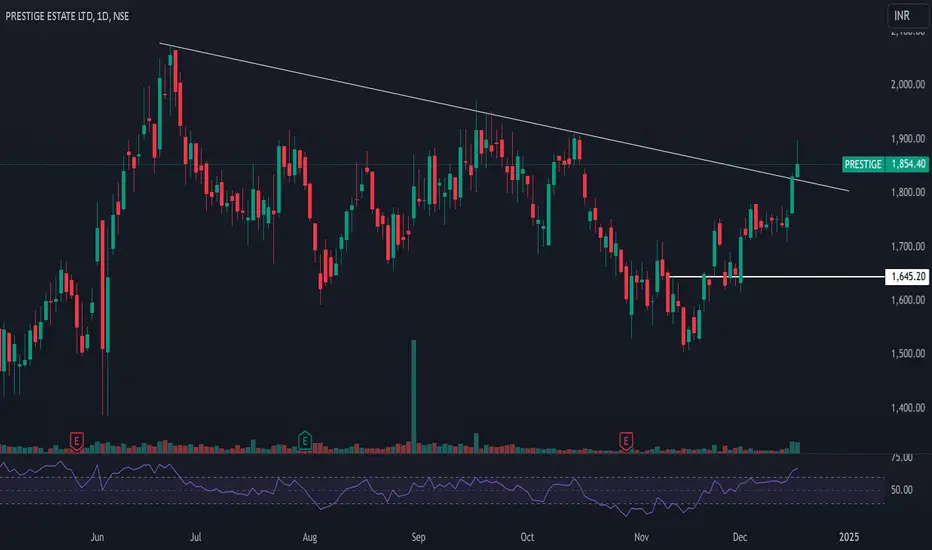
PRESTIGE in BreaoutNSE:PRESTIGE is breaking out of a Rectangular Trend. You can buy at the Current price 1780 and Target for 2050. Keep the Stopp loss at 1675.
PRESTIGE trade ideas
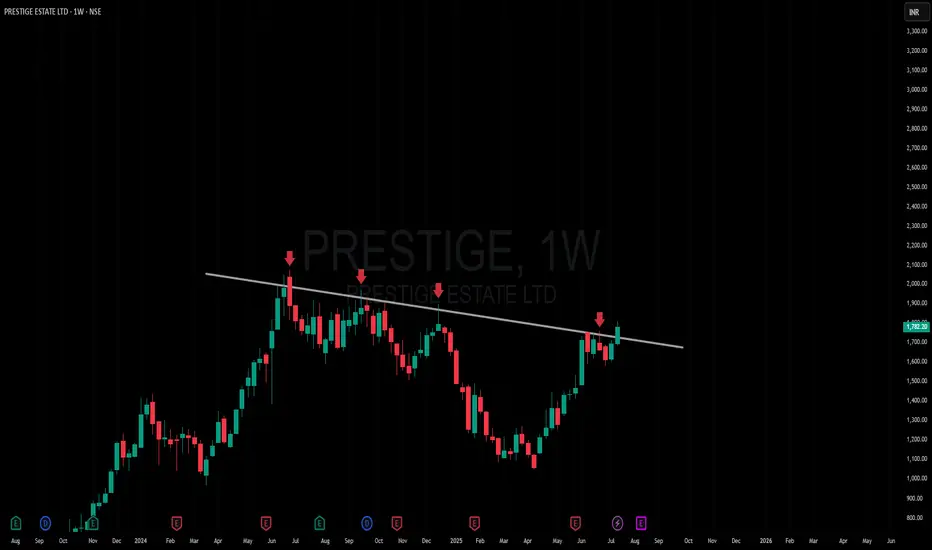
Amazing breakout on WEEKLY Timeframe - PRESTIGECheckout an amazing breakout happened in the stock in Weekly timeframe, macroscopically seen in Daily timeframe. Having a great favor that the stock might be bullish expecting a staggering returns of minimum 25% TGT. IMPORTANT BREAKOUT LEVELS ARE ALWAYS RESPECTED!
NOTE for learners: Place the breakout levels as per the chart shared and track it yourself to get amazed!!
#No complicated chart patterns
#No big big indicators
#No Excel sheet or number magics
TRADE IDEA: WAIT FOR THE STOCK TO BREAKOUT IN WEEKLY TIMEFRAME ABOVE THIS LEVEL.
Checkout an amazing breakout happened in the stock in Weekly timeframe.
Breakouts happening in longer timeframe is way more powerful than the breakouts seen in Daily timeframe. You can blindly invest once the weekly candle closes above the breakout line and stay invested forever. Also these stocks breakouts are lifelong predictions, it means technically these breakouts happen giving more returns in the longer runs. Hence, even when the scrip makes a loss of 10% / 20% / 30% / 50%, the stock will regain and turn around. Once they again enter the same breakout level, they will flyyyyyyyyyyyy like a ROCKET if held in the portfolio in the longer run.
Time makes money, GREEDY & EGO will not make money.
Also, magically these breakouts tend to prove that the companies turn around and fundamentally becoming strong. Also the magic happens when more diversification is done in various sectors under various scripts with equal money invested in each N500 scripts.
The real deal is when to purchase and where to purchase the stock. That is where Breakout study comes into play.
Check this stock which has made an all time low and high chances that it makes a "V" shaped recovery.
> Taking support at last years support or breakout level
> High chances that it reverses from this point.
> Volume dried up badly in last few months / days.
> Very high suspicion based analysis and not based on chart patterns / candle patterns deeply.
> VALUABLE STOCK AVAILABLE AT A DISCOUNTED PRICE
> OPPURTUNITY TO ACCUMULATE ADEQUATE QUANTITY
> MARKET AFTER A CORRECTION / PANIC FALL TO MAKE GOOD INVESTMENT
DISCLAIMER : This is just for educational purpose. This type of analysis is equivalent to catching a falling knife. If you are a warrior, you throw all the knives back else you will be sorrow if it hits SL. Make sure to do your analysis well. This type of analysis only suits high risks investor and whose is willing to throw all the knives above irrespective of any sectoral rotation. BE VERY CAUTIOUS AS IT IS EXTREME BOTTOM FISHING.
HOWEVER, THIS IS HOW MULTIBAGGERS ARE CAUGHT !
STOCK IS AT RIGHT PE / RIGHT EVALUATION / MORE ROAD TO GROW / CORRECTED IV / EXCELLENT BOOKS / USING MARKET CRASH AS AN OPPURTUNITY / EPS AT SKY.
LET'S PUMP IN SOME MONEY AND REVOLUTIONIZE THE NATION'S ECONOMY!
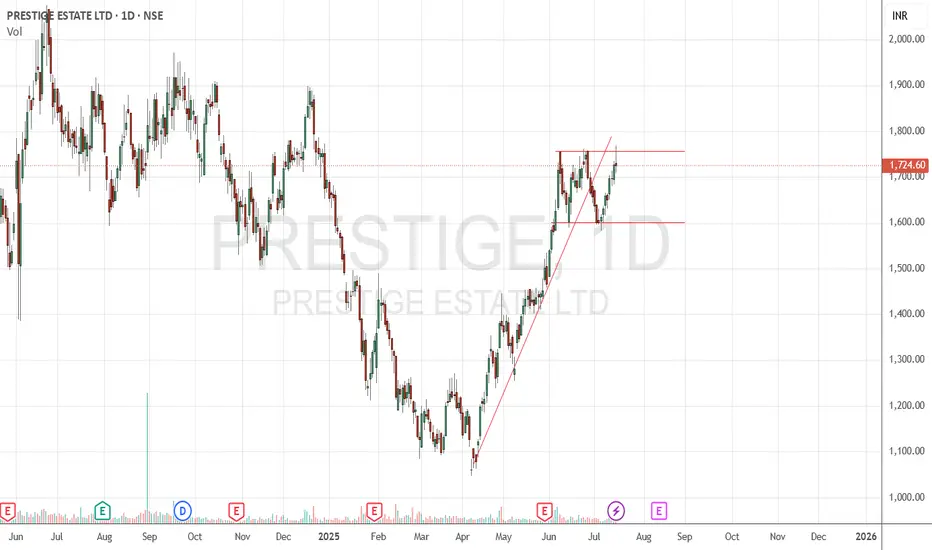
Prestige Estate SellPrestige Estate breaks below trend line and trading in a range. Sell @CMP (1725) with SL of 1770 and Target of 1600.
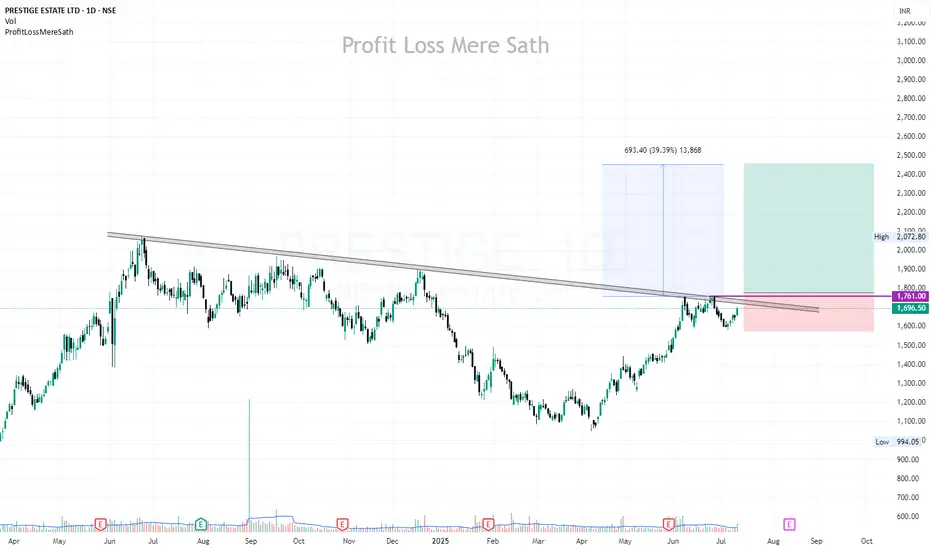
PRESTIGE | Buy above 1761 | SL below 1570 | Target 2460Disclaimer:
This is not financial advice. Please do your own research or consult with a financial advisor before making any investment decisions. Investments in stocks can be risky and may result in loss of capital.
PRESTIGE ESTATE:AT THE VERGE OF EMA GOLDEN CROSSOVER&B/OUTPRESTIGE ESTATE: Presently trading above all its 20 ,50,100,200 DEMA .20 DEMA Cross over above 50/100/200 and likely breach of its channel neckline resistance,suggests a move towards 1650-1700.(For educational purpose only)

Long termLong term position can be made now as it has crossed 50 EMA with big green candles in weekly TF.
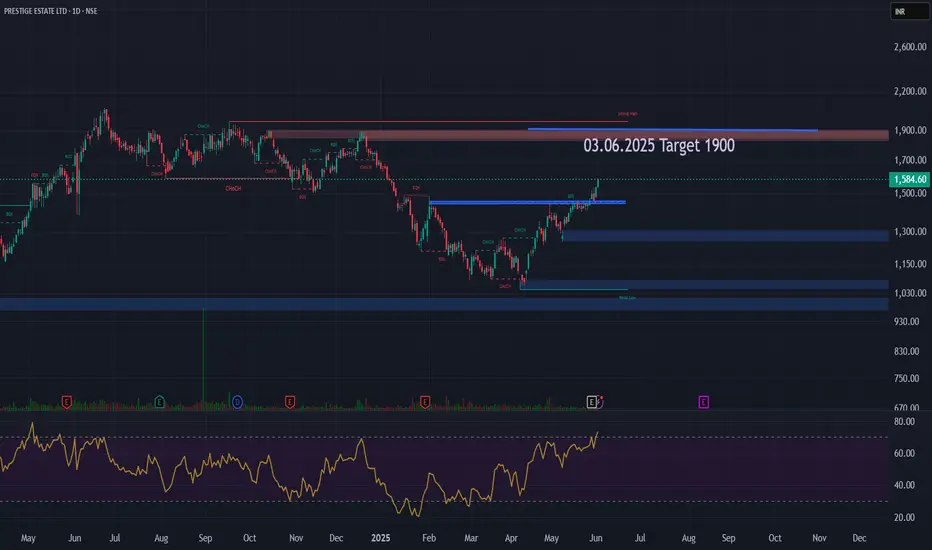
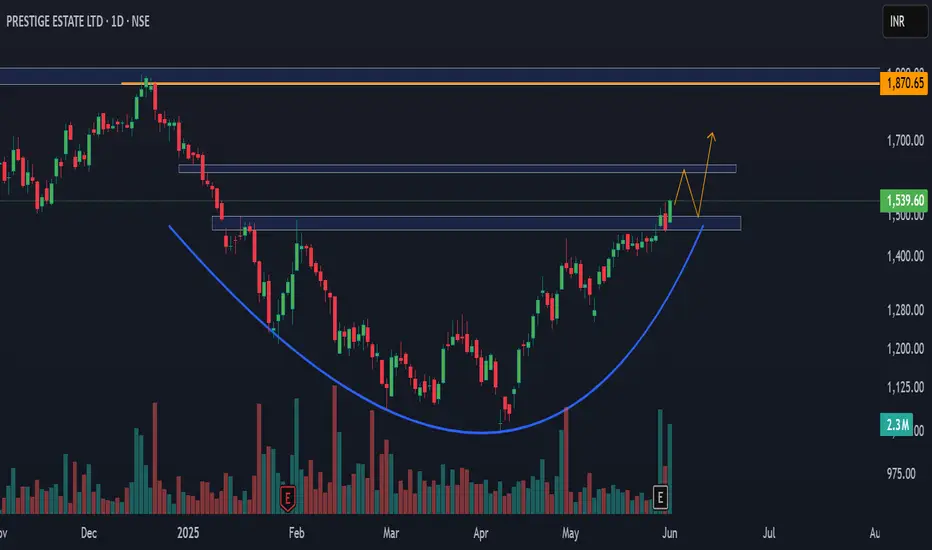
Cup & Handle Breakout - PRESTIGECurrent Price: ₹1,584.60
Technical Analysis:
Cup & Handle Breakout Pattern: The provided chart shows a potential Cup & Handle pattern, with the price breaking out above a resistance level. A confirmed breakout with strong volume is typically a bullish signal. The chart also indicates a "Strong High" marked near ₹1,900.
Immediate Target: ₹1,900
Time Frame: 3 to 6 months.
Fundamental Analysis:
Market Cap: ₹68,189 Cr.
Current Price: ₹1,585
Stock P/E: 146 (Extremely high, indicating very high growth expectations are priced in or low recent earnings.)
Book Value: ₹358
Dividend Yield: 0.11%
ROCE: 7.69% (Relatively low for a company with such a high P/E.)
ROE: 3.50% (Very low return on equity, especially considering the high P/E.)
Face Value: ₹10.0
High / Low (52-week): ₹2,075 / ₹1,048
Shareholding Pattern (as of March 2025):
Promoters: Decreased stake from 70.00% (Mar 2017) to 60.95% (Mar 2025).
FIIs: Fluctuating, currently at 17.08% (Mar 2025) from 24.43% (Mar 2017).
DIIs: Consistently increased stake from 4.41% (Mar 2017) to 19.23% (Mar 2025). This is a strong positive signal.
Public: Currently at 2.74% (Mar 2025).
No. of Shareholders: Significantly increased from 11,656 (Mar 2017) to 1,68,033 (Mar 2025), indicating rising retail interest.
Recent Performance: Prestige Estates, being a prominent real estate developer, would have its financial performance tied to property sales, project completions, and new project launches. Recent results for real estate companies in India have generally been positive due to robust housing demand.
EPS: Given the P/E of 146, the EPS (Earnings Per Share) would likely be very low. For example, if P/E is 146 and Current Price is ₹1585, then EPS = ₹1585 / 146 ≈ ₹10.85. This suggests that earnings are currently quite low relative to the stock price.
Corporate Actions:
Real estate companies often engage in corporate actions like fundraising (QIPs, preferential allotments) to fund new projects, joint ventures, or acquisitions of land parcels. Dividend payouts are also common.
Any announcements regarding new project launches, significant sales bookings, or progress on existing projects would be key corporate actions.
Company Order Book / Sales Pipeline:
For real estate companies, the "order book" is typically represented by sales bookings for ongoing and upcoming projects, and the development pipeline of future projects. Higher sales bookings and a strong pipeline indicate future revenue visibility.
Latest News:
Recent news for Prestige Estates would likely focus on:
Q4 FY25 and FY25 financial results: The market would be keenly watching their earnings for any justification of the high valuation.
Sales Performance: Updates on property sales, new launches, and project completions.
Expansion Plans: Announcements of new land acquisitions or expansion into new cities/segments.
Analyst Reports: Brokerage reports on their performance and outlook.
Overall Assessment:
Prestige Estates Projects Ltd. presents a mixed but potentially bullish outlook, driven by strong technicals and positive industry trends, but tempered by a very high valuation:
Bullish Technicals: The identified Cup & Handle breakout is a strong bullish pattern, indicating potential upward momentum. The target of ₹1,900 seems to align with a "Strong high" level on the chart.
Strong DII Confidence: The continuous increase in DIIs' stake and the significant rise in the number of shareholders indicate growing domestic institutional and retail confidence in the company.
Industry Tailwinds: The real estate sector in India has been witnessing robust demand, which benefits established players like Prestige.
High Valuation (P/E 146): This is the most significant fundamental concern. A P/E of 146 implies that the market is expecting exceptionally high earnings growth in the future. The current ROE (3.50%) and ROCE (7.69%) are quite low for such a high valuation, indicating that current profitability doesn't justify the price, but future growth potential is being heavily discounted. Investors are clearly betting on aggressive future expansion and profitability.
Conclusion:
The technical setup for Prestige Estates Projects Ltd. appears bullish with the Cup & Handle breakout, and the immediate target of ₹1,900 seems technically plausible within the 3-6 month timeframe. The increasing DII holding also provides confidence. However, the extremely high P/E ratio of 146 suggests that a significant amount of future growth is already priced into the stock. For the stock to sustain this rally and potentially move beyond, the company must deliver exceptionally strong sales bookings, project completions, and, most importantly, a substantial increase in its earnings per share in the coming quarters to fundamentally support its premium valuation.
Disclaimer: This analysis is for informational purposes only and does not constitute investment advice. Investing in stocks with very high P/E ratios carries elevated risks. Always conduct your own thorough research, carefully analyze the stock chart, assess your risk tolerance, and consult with a qualified financial advisor before making any investment decisions. The stock market carries inherent risks.
PRESTIGE ESTATE LTD- FOR SWING AND LONG TRADEPrice has given a breakout in Daily time frame.
Current price is 1539.
Next target can be 1800 to 1850.
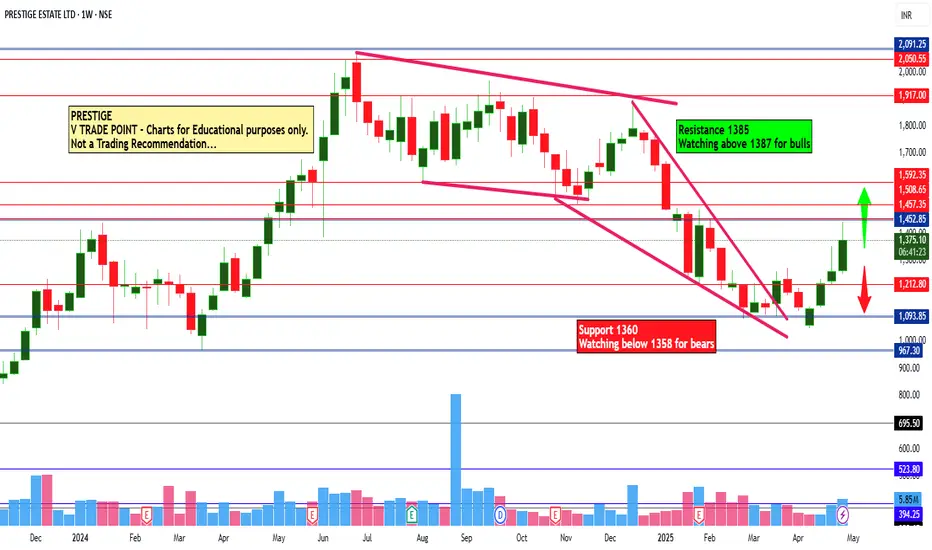
PRESTIGE Estate Ltd view for Intraday 2nd May #PRESTIGE PRESTIGE Estate Ltd view for Intraday 2nd May #PRESTIGE
Resistance 1385 Watching above 1387 for upside movement...
Support area 1360 Below 1360 ignoring upside momentum for intraday
Watching below 1358 for downside movement...
Above 1385 ignoring downside move for intraday
Charts for Educational purposes only.
Please follow strict stop loss and risk reward if you follow the level.
Thanks,
V Trade Point
PRESTIGE 1d chart breakout
Trendline breakout
Volume more than 20 MA
RSI > 60
Hammer formation on trendline
Outperforming Realty sector
.

PRESTIGE ESTATE Ltd 1w Prestige Estates Ltd is forming a bullish flag pattern, signaling strong upward potential. A clear breakout has occurred at ₹1888, with the next projected target around ₹3000, according to technical analysis
I'm not a SEBI-registered analyst. All posts and levels shared are just for educational purposes. I'm not responsible for any losses or profits. No claims, all rights reserved

lapu star breakoutbreakout can be a signal to buy if the price breaks above resistance (a bullish breakout) or to sell if it breaks below support (a bearish breakout). It helps traders identify potential new trends and make informed trading decisions.

SWING TRADE we can see a good trade oppourtunity.
stock is ready to to move on bigger time frames.
we can see a upmove in comming 5-6 Weeks.

Prestige wave Analysis Prestige going to the wave 5th
target = 2215
Stop loss = C
This chart is only for the studies purpose so please research at own self.

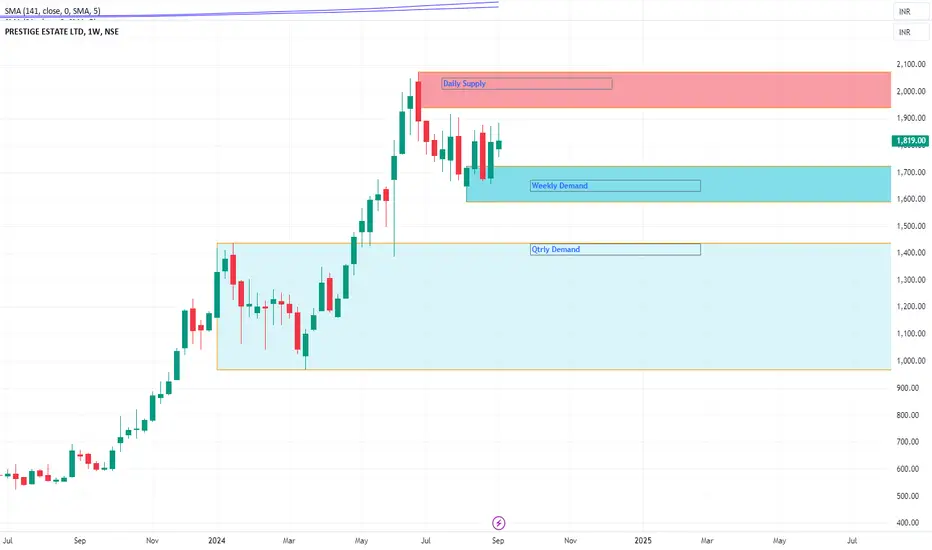
Prestige Estate LONG 1725 RR 1:3Prestige Estate
Current Price :
Prestige Estate Daily Supply 1942
Prestige Estate Weekly Supply
MTF Analysis
Prestige Estate Yearly Breakout (Not completed) 1231
Prestige Estate 6 Month Demand BUFL 1231
Prestige Estate Qtrly Demand BUFL 1440
Prestige Estate Monthly Breakout 1440
Prestige Estate Weekly DMIP 1725
ENTRY 1725
SL 1592
Target 2159
Last High 1942
RR 3.26
Prestige Estates Projects Ltd.Prestige Estates Projects Ltd. With solid fundamentals price is poised to go higher. Price is currently forming wedge pattern, Wait for break of support with momentum Then Plan entry accordingly

Prestige on a bull run!Stock is on bull run after BO on falling wedge pattern
Now formed a flag
after bo look out crossing above the given bar in chart
if above 1900 on 1hr tradecan be taken
targets and sl are given in chart

Prestige- LONG TERM ACCUMULATION - EDUCATION PURPOSE #Prestige This analysis focuses on the long-term accumulation strategy for Prestige, emphasizing key support levels that are crucial for making informed trading decisions. This strategy is designed for educational purposes and aims to help traders understand the importance of support levels in the context of long-term investments.
Risk Management: Establishing support levels assists in managing risk by setting predefined points for making buying decisions, thereby limiting potential losses.
This analysis is intended to provide educational value and should not be construed as financial advice. Always conduct your own research and consult with a financial advisor before making investment decisions.

Prestige Intraday level fo 25th June #PRESTIGE Prestige Intraday level fo 25th June #PRESTIGE
Buying opportunity above 2075
Stop Loss area 2040
Charts for Educational purposes only.
Please follow strict stop loss and risk reward if you follow the level.
Thanks,
V Trade Point

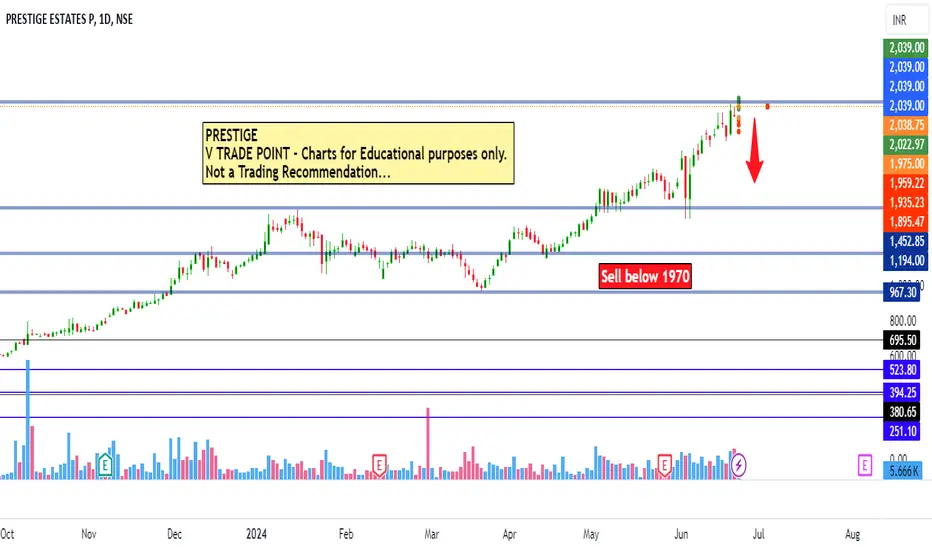
Prestige estage projects intraday level fo24th June #PRESTIGE
Prestige estage projects intraday level fo24th June #PRESTIGE
Selling opportunity below 1970
Stop Loss area 2000
Charts for Educational purposes only.
Please follow strict stop loss and risk reward if you follow the level.
Thanks,
V Trade Point
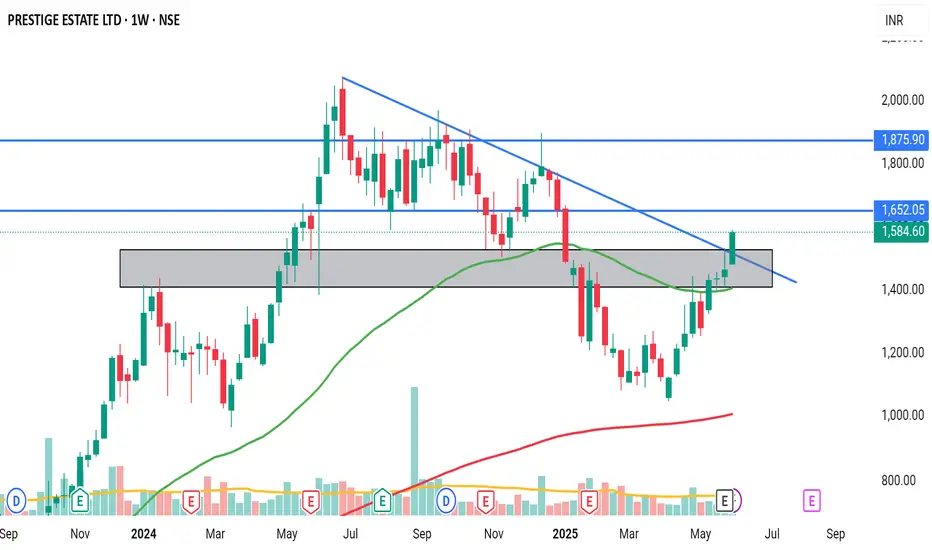
SWING IDEA - PRESTIGE ESTATESPrestige Estates , a leading Indian real estate developer, is showing a compelling opportunity for a swing trade.
Reasons are listed below :
Breakthrough of Resistance Zone : The 1350-1400 range had been a significant resistance zone, but the price recently broke through and achieved a weekly close above it, indicating a strong upward momentum.
0.5 Fibonacci Bounce : The price retraced to the 0.5 Fibonacci level and subsequently bounced back, suggesting this level is acting as strong support, reinforcing the potential for continued bullish movement.
Breakout from Consolidation Phase : The stock has broken out of a 4-month consolidation phase, signaling that it could be entering a new upward trend.
Bullish Marubozu Candle on Weekly Timeframe : Last week's marubozu candle (with minimal shadows) indicates strong buying pressure and supports the case for continued bullish momentum.
Trading Above 50 and 200 EMA on Weekly Timeframe : Prestige Estates is trading above both the 50-week and 200-week exponential moving averages, which is a robust signal of a prevailing uptrend.
Trading at All-Time High : The stock is currently trading at its all-time high, indicating strong bullish sentiment. However, traders should watch for potential pullbacks or resistance at this level.
Target - 1650 // 1800 // 1900
Stoploss - weekly close below 1300
DISCLAIMER -
Decisions to buy, sell, hold or trade in securities, commodities and other investments involve risk and are best made based on the advice of qualified financial professionals. Any trading in securities or other investments involves a risk of substantial losses. The practice of "Day Trading" involves particularly high risks and can cause you to lose substantial sums of money. Before undertaking any trading program, you should consult a qualified financial professional. Please consider carefully whether such trading is suitable for you in light of your financial condition and ability to bear financial risks. Under no circumstances shall we be liable for any loss or damage you or anyone else incurs as a result of any trading or investment activity that you or anyone else engages in based on any information or material you receive through TradingView or our services.
@visionary.growth.insights

Prestige long - swing tradingPrestige take long entry once it closes above 1566 stop loss 1416 for risky traders, 1470 for safe traders
