RADICO - Stock AnalysisRadico Khaitan Ltd. is currently demonstrating robust bullish momentum across various technical indicators, underpinned by strong fundamentals, making it a compelling prospect for investors. In the short term, the one-day analysis reflects a "Strong Bullish" sentiment, with the latest tick indicating a substantial price rise supported by strong trading volume.
The KeltnerBand is "Strong Bullish" with a positive breakout pattern, while the MACD (Moving Average Convergence Divergence) is "Strong Bullish" with a bullish crossover and a Zero line crossover, suggesting a favorable trend. The DonchianBand is "Bullish" with a new high created, implying the possibility of a breakout. The Awesome Oscillator is "Bullish," with a recent bullish reversal and a trend pointing upwards. The MAChannelBand and HighLowMABand are both "Strong Bullish" with positive breakout patterns.
Both the daily and weekly candlestick patterns are signaling "Strong Bullish" sentiment, providing strong technical support. The stock has also encountered significant resistance and support lines, with top points for the Long Term Resistance Line at 1279.25 on November 2, 2023, and the Medium Term Resistance Line at 1279.25 on the same date, with a Medium Term Support Line at bottom points of 1187.35 on October 23, 2023, and 1158.35 on September 25, 2023. These lines serve as crucial reference points for traders and investors.
From a fundamental perspective, Radico Khaitan Ltd. appears undervalued with a Price to Intrinsic Value of 0.762. The company has demonstrated a remarkable increase in its Book Value over the last three years, indicating a strong financial position. The firm also boasts an excellent quarter-over-quarter (QoQ) earnings per share (EPS) growth rate, and while the Piotroski F Score is at a stable value of 5.0, there has been steady growth in EPS over the last four quarters.
Radico Khaitan Ltd. maintains a good Return on Equity of 10.67% and offers a relatively low dividend yield of 0.240%, suggesting a preference for reinvesting profits for further growth. Additionally, there is a short-term positive trend in total sales and net profit, with quarterly sales over the last five years showing an upward trajectory. The company has also experienced a consistent increase in Total Assets over the last three years, reflecting its ongoing expansion and financial stability.
In summary, Radico Khaitan Ltd. presents a compelling investment opportunity with a strong technical outlook and solid fundamental indicators. The stock's recent bullish trends, positive breakout patterns, and continuous growth in various aspects of the business make it an attractive choice for investors seeking potential growth and value in the market.
Go Long above 1284.90
Stop Loss 1166
RADICO trade ideas
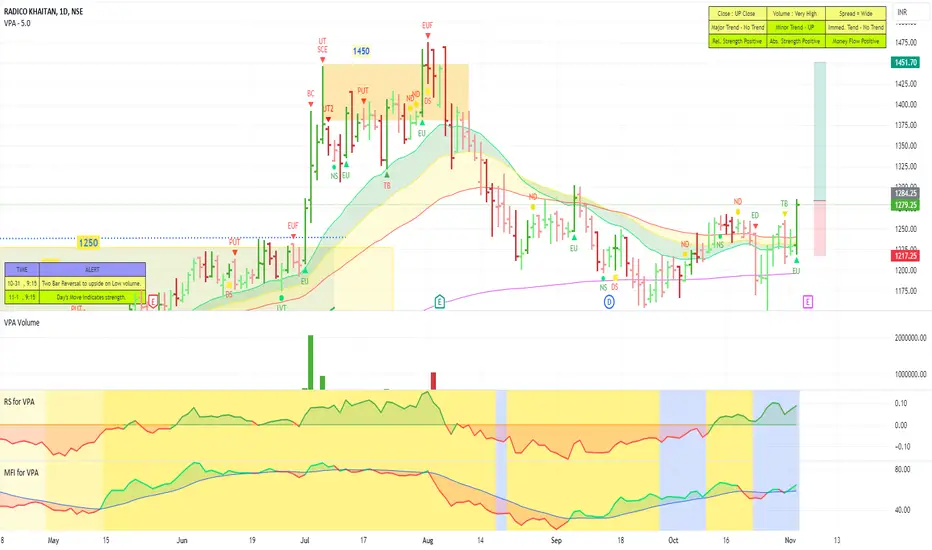
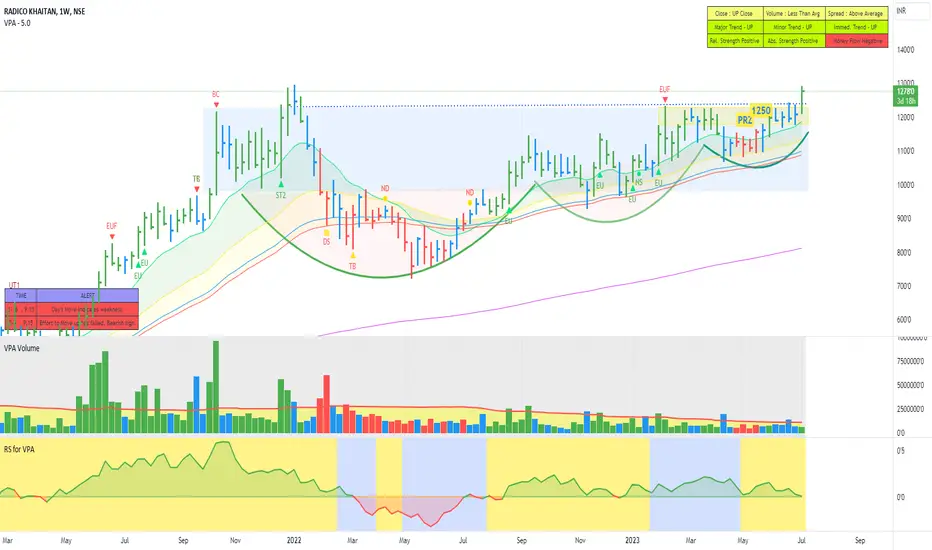
RADICOThe Stock is moving up after taking support from the 200 DMA. Now going past all the short term Moving averages.
Relative strength. Absolute Strength and Money Flow all Positive. Good volume support coming in as well.
The stock seems gearing up for move and Test 1450 levels.
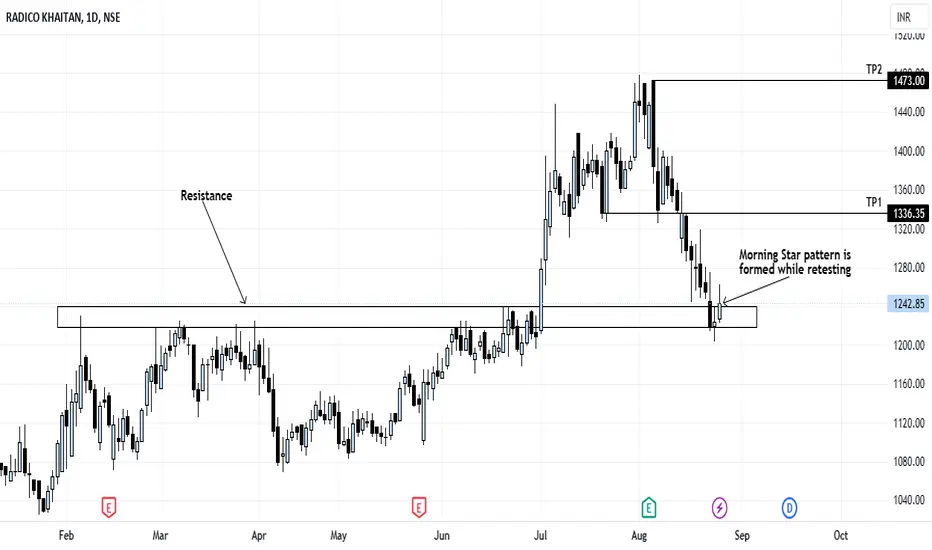
A+++ SETUP IN RADICO KHAITANBreakout of resistance was happened in RADICO KHAITAN currently it is retesting the resistance that it broke and morning star candle stick pattern has been formed while retesting so i'm expecting a good bullish movement.
Expected targets are:
TP1 - 1336.35
TP2 - 1473
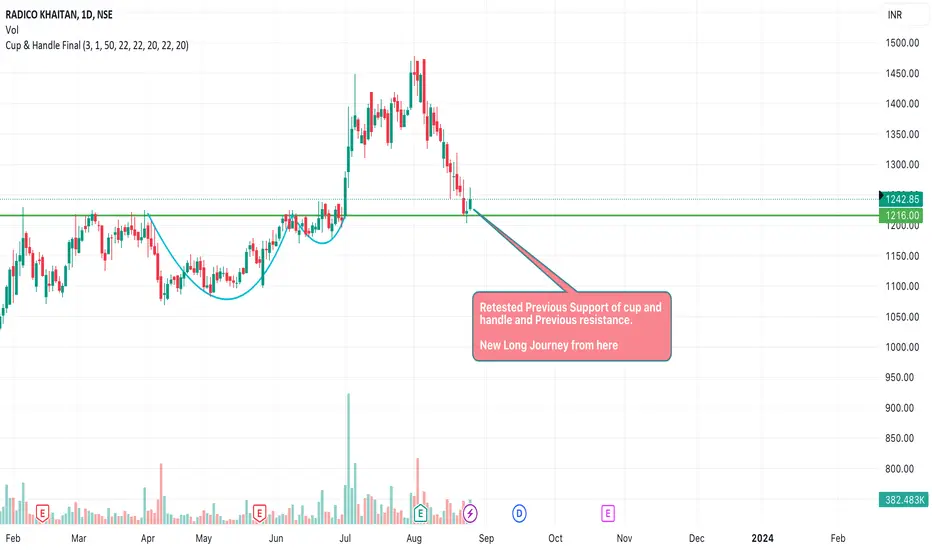
Radico - New All Time High ?**Anticipating a Break to New All-Time Highs:** A promising development is on the horizon as the possibility of reaching new all-time highs comes into view. This prospect gains strength due to the stock's recent actions. It has undergone a retest of crucial support levels, including the support from the multi-months pattern and the neckline support of the cup and handle formation. These retests suggest a firm foundation and potential for renewed upward movement.
**Solidifying Support and Setting the Stage:** The stock's decision to retest both the multi-months support and the cup and handle neckline support underscores its resilience and the market's confidence at these levels. This could potentially serve as a launchpad for the stock to embark on a trajectory toward new all-time highs.
**Implications of the Cup and Handle Formation:** The presence of the cup and handle pattern, along with the successful retest of its neckline support, is an encouraging signal. This formation suggests a period of consolidation followed by a breakout, and the stock's recent actions appear to align with this pattern.
**Upcoming Momentum Towards New Peaks:** Given these factors, there's a growing expectation of the stock's upward momentum leading to a new phase of all-time highs. However, it's important to approach such projections with careful consideration of market dynamics and trends. Always keep in mind that market movements can be complex and can deviate from expectations.
Please be aware that this information is not intended as financial advice; it's provided for educational purposes. For any investment decisions, consulting with financial experts and conducting thorough research is recommended.
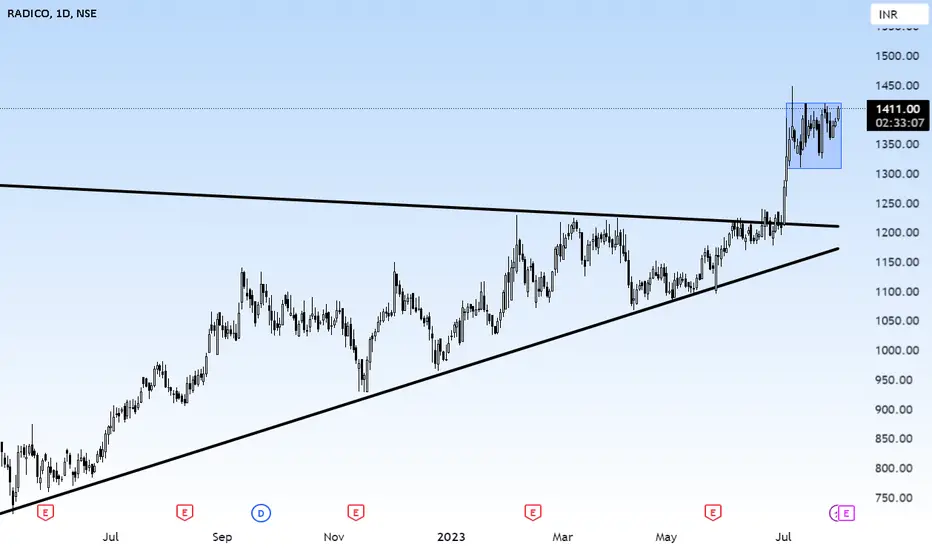
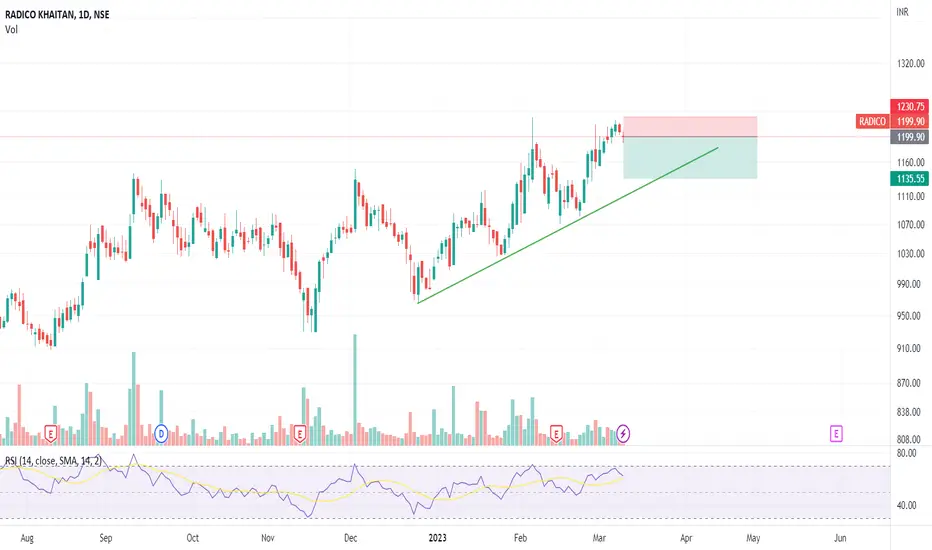
RADICO: TRENDLINE SUPPORTNSE:RADICO is taking support at upward sloping bullish trendline. We can enter Long position with the stop loss right below the trendline.


Radico Khaitan Pole and Flag setting up..tradingview.sweetlogin.com
Trail SL below Swing below and ride the trend towards 1600
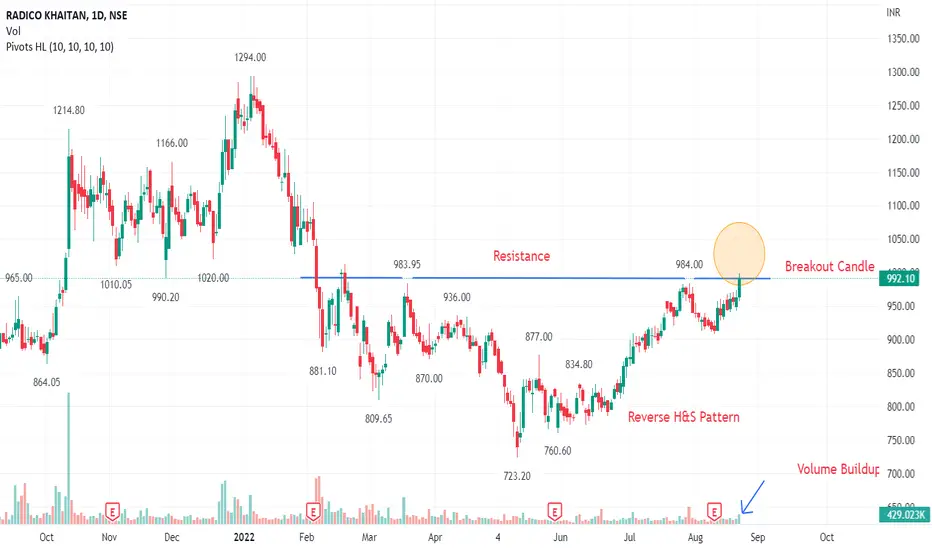
Breaking Out Stock! #RADICOBreaking Out Stock!
Radico Khaitan Ltd. #RADICO
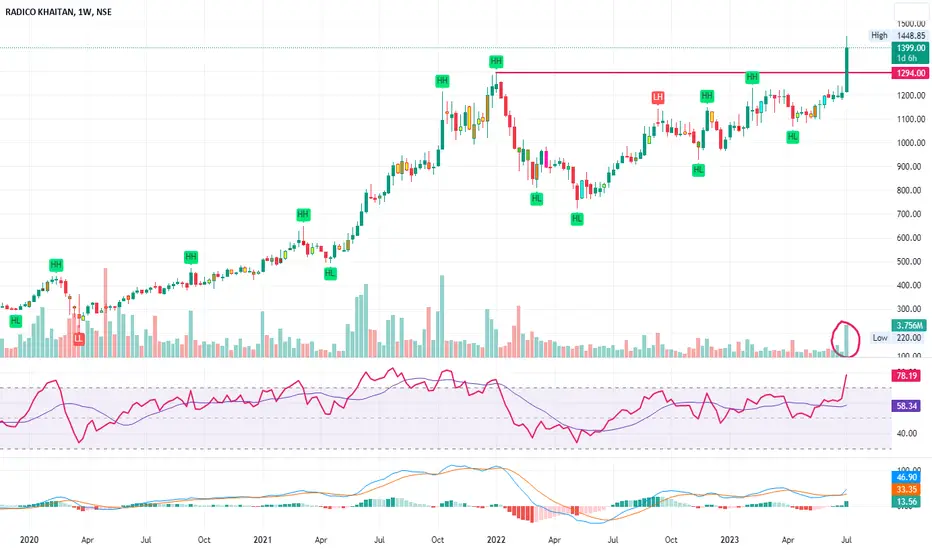
1- Highest Weekly Volume in 12 months
2- Trading at Lifetime High
3- Higher-High Higher-Low Pattern
Note: Technical Analysis is for Educational Purpose. I am not SEBI registered. Consult your financial advisor for any Investment Advice.
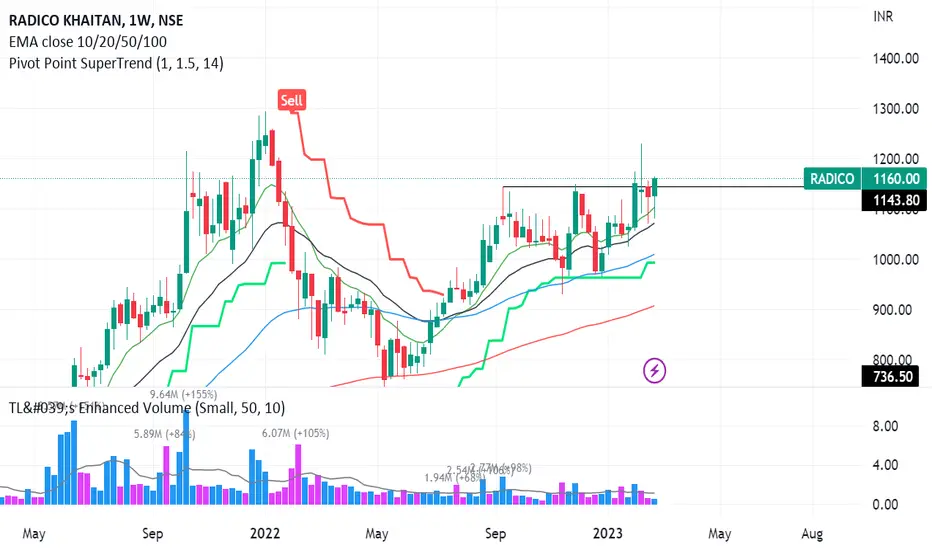
RADICO - Ready to fly high!Breakout above 1143 is retested and confirmed. (Live price - 1160)
Stoploss - 1079
Target - All-time high: Trail as per 5 SMA above 1320 level
Radico - On its way to the barRadico Khaitan - Breakout of Cup and Handle with excellent volumes!. Target 1620
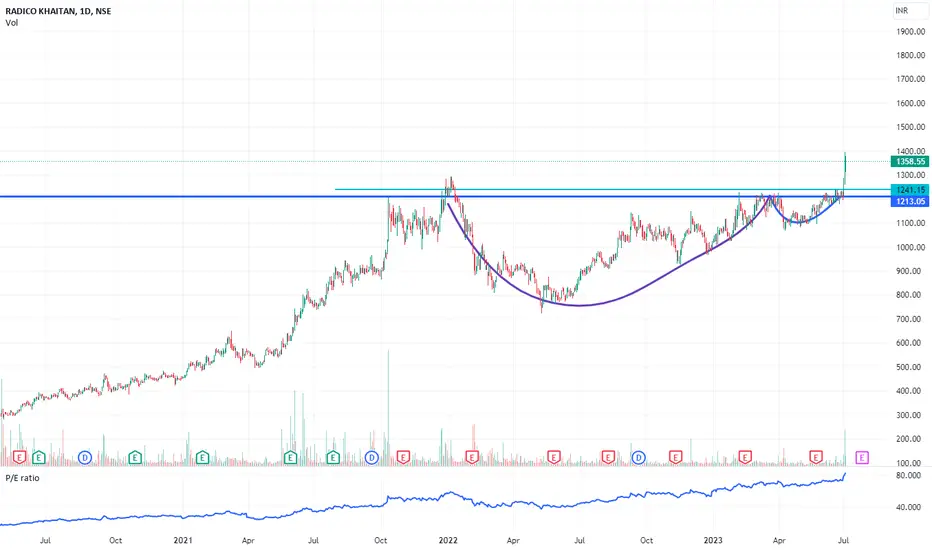
RADICO – Ready to move higher !All time highest close. A nice VCP pattern on the weekly. Moving above the shadow of the “BC” bar in the weekly. Positive Relative strength.
On the Daily it is taking out the current Price Rejection Zone at 1190-1250. Good volume support. Positive Relative strength.
In short, the stock looks gearing up a move to much higher levels
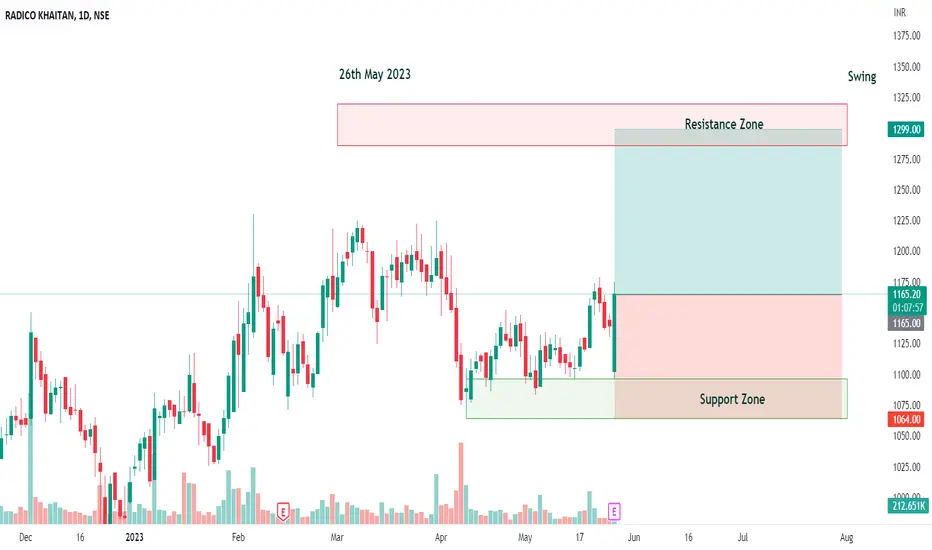
RADICO - Bullish Engulfing Swing ReversalNSE: RADICO is closing with a bullish engulfing candle supported with volumes.
Today's volumes and candlestick formation indicates strong demand and stock should move to previous swing highs in the coming days.
The stock has been moving along the horizontal support for the past few days which is indicating demand.
One can look for a 8% to 11% gain on deployed capital in this swing trade.
The view is to be discarded in the event of the stock breaking previous swing low.
#NSEindia #Trading #StockMarketindia #Tradingview #SwingTrade
Disclaimer:
This is for educational purposes only.
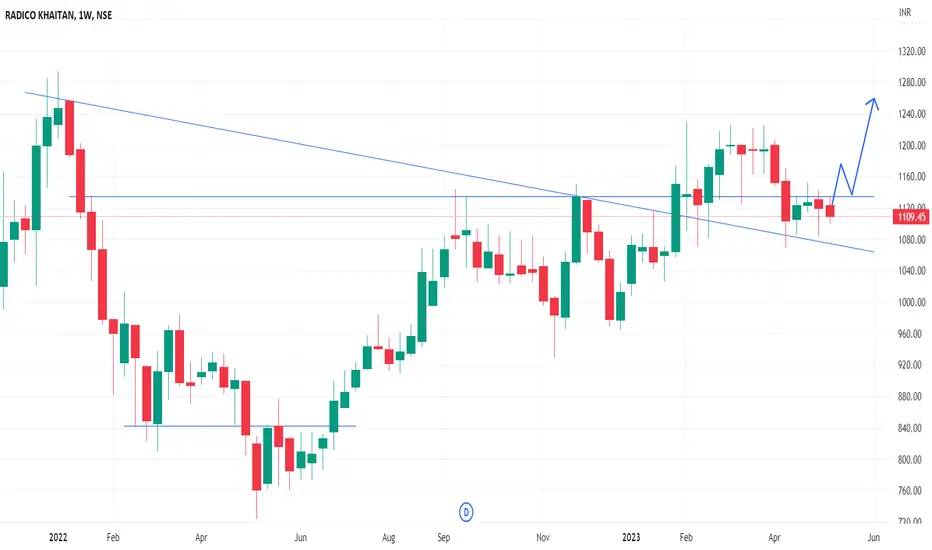
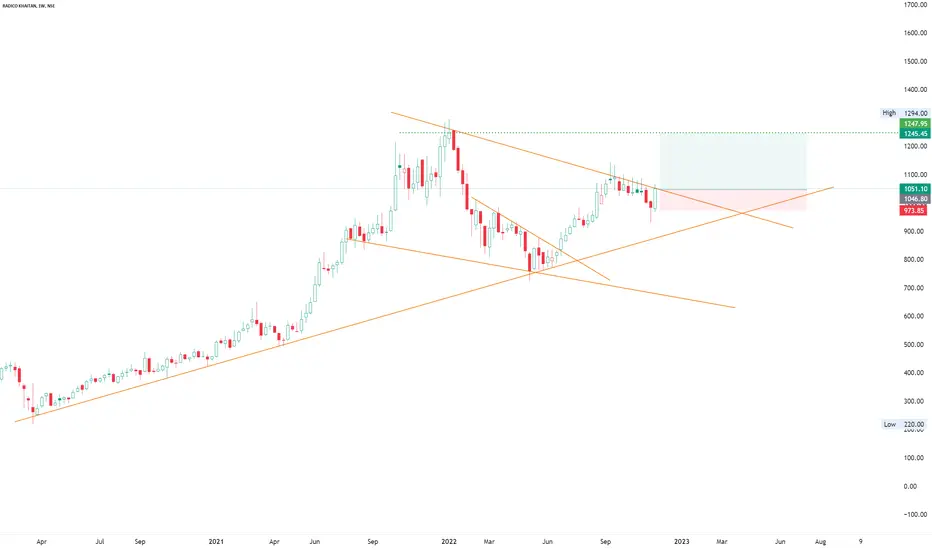
RADICO - Weekly AnalysisIn the Weekly Chart of RADICO ,
we can see that, it is ready for up move.
Enter on W breakout and go long
Short Term Buy Radico* Can Buy Approx 1194
* Target 2.5 -3%
* SL 5%
Well SL is not favourable as Risk Reward Ratio But Can Take Risk Because of following points:
* Market in Uptrend
* Volume seems Good
* Potential to give result in 2-8 days


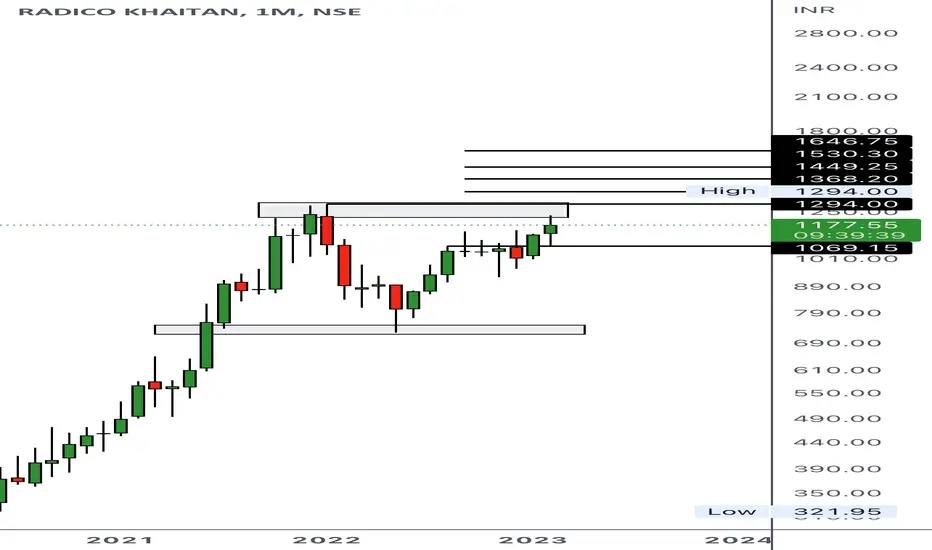
Radico khaitan#hm radico khaitan
Bullish structure, abv 1294 will show new high. Cn keep eye. Weak below 1069. Upside cn touch 1368..1449…1530…1646 positionally.
Ascending channel continuation_ RadicoRadico view for 13th Feb
Ascending channel continuation in Radico
Please follow strict risk reward and stop loss..
Charts for educational purposes only
Thanks,
V Trade Point

Radico Khaitan Breakout on Supply zone 1107-1143*Radico Khaitan*
Time Frame: Daily
Observation:
* Breakout on Supply zone 1107-1143
* Mean (EMA) diversion on daily time frame.
Resistance/Target: 1293 1464 1665 1797
Support: 979 908

RADICONSE:RADICO
One Can Enter Now ! Or Wait for Retest of the Trendline (BO).
Note :
1.One Can Go long with a Strict SL below the Trendline or Swing Low of Daily Candle.
2. Close, should be good and Clean.
3. R:R ratio should be 1 :2 minimum
4. Plan as per your RISK appetite
Disclaimer : You are responsible for your Profits and loss, Shared for Educational purpose!
RADICORADICO - Fake fall till AVWAP & POC
The set up seems fit to make fresh highs from here.
One can go long with a SL of last swing low.
Good risk reward set up here.

Radico KhaitanWedge with Double bottom.
First bottom low was 1025
and Second low was 1022
Need to cross 1100 for a buy.
Price above all moving averages.
CCI Green
Cons:
Elliot oscillator is still red
Stochastic bar above 80 is not yet formed.
3rd November 2022 is earnings.
So will wait and watch till setup emerges

Radico Khaitan: breakout soon candidateRadico Khaitan is a strong candidate for a possible breakout. Keep it on your radar!