RELIANCE INFRASTRUCTU - Bullish Flag & Pole Breakout (Daily T/F)Trade Setup
📌 Stock: RELIANCE INFRASTRUCTU ( NSE:RELINFRA )
📌 Trend: Strong Bullish Momentum
📌 Risk-Reward Ratio: 1:3 (Favorable)
🎯 Entry Zone: ₹385.00 (Breakout Confirmation)
🛑 Stop Loss: ₹293 (Daily Closing Basis) (-23 % Risk)
🎯 Target Levels:
₹412.50
₹441.95
₹472.55
₹506.05
₹542.30
₹580.65
₹616.10
₹654.00 (Final Target)
Technical Rationale
✅ Bullish Flag & Pole Breakout - Classic bullish pattern confirming uptrend continuation
✅ Strong Momentum - Daily RSI > 60, Weekly RSI >60 Monthly rsi >60
✅ Volume Confirmation - Breakout volume 2.73M vs previous day's 2.69M
✅ Multi-Timeframe Alignment - Daily and weekly charts showing strength
Key Observations
• The breakout comes with significantly higher volume, validating strength
• Well-defined pattern with clear price & volume breakout
• Conservative stop loss at recent swing low
Trade Management Strategy
• Consider partial profit booking at each target level
• Move stop loss to breakeven after Target 1 is achieved
• Trail stop loss to protect profits as price progresses
Disclaimer ⚠️
This analysis is strictly for educational purposes and should not be construed as financial advice. Trading in equities involves substantial risk of capital loss. Past performance is not indicative of future results. Always conduct your own research, consider your risk appetite, and consult a financial advisor before making any investment decisions. The author assumes no responsibility for any trading outcomes based on this information.
What do you think? Are you watching NSE:RELINFRA for this breakout opportunity? Share your views in the comments!
RELINFRA trade ideas

RELINFRA is in momentum now, Reliance infra is in momentum now, now for short term it will face problem at upside but , u can think to buy around 288 so lets see what happens
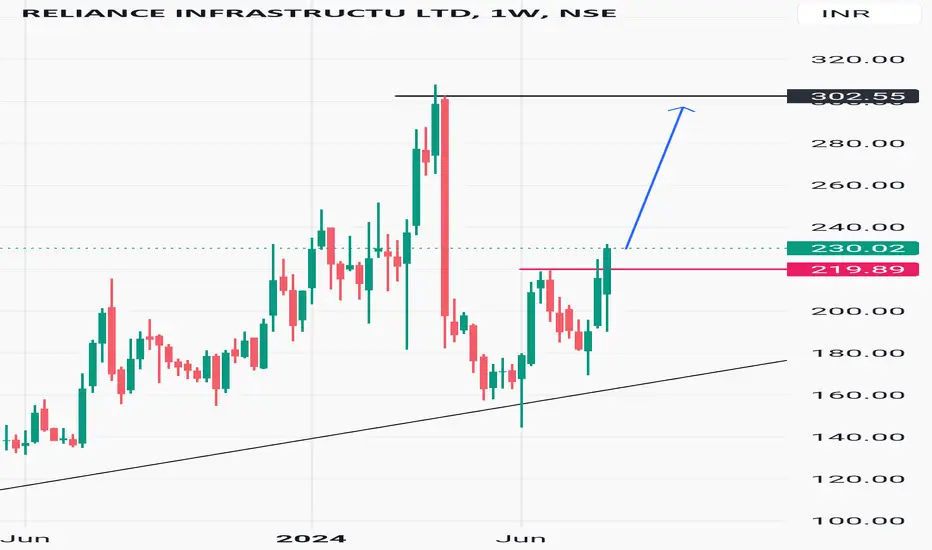
Amazing breakout on WEEKLY Timeframe - RELINFRACheckout an amazing breakout happened in the stock in Weekly timeframe, macroscopically seen in Daily timeframe. Having a great favor that the stock might be bullish expecting a staggering returns of minimum 25% TGT. IMPORTANT BREAKOUT LEVELS ARE ALWAYS RESPECTED!
NOTE for learners: Place the breakout levels as per the chart shared and track it yourself to get amazed!!
#No complicated chart patterns
#No big big indicators
#No Excel sheet or number magics
TRADE IDEA: WAIT FOR THE STOCK TO BREAKOUT IN WEEKLY TIMEFRAME ABOVE THIS LEVEL.
Checkout an amazing breakout happened in the stock in Weekly timeframe.
Breakouts happening in longer timeframe is way more powerful than the breakouts seen in Daily timeframe. You can blindly invest once the weekly candle closes above the breakout line and stay invested forever. Also these stocks breakouts are lifelong predictions, it means technically these breakouts happen giving more returns in the longer runs. Hence, even when the scrip makes a loss of 10% / 20% / 30% / 50%, the stock will regain and turn around. Once they again enter the same breakout level, they will flyyyyyyyyyyyy like a ROCKET if held in the portfolio in the longer run.
Time makes money, GREEDY & EGO will not make money.
Also, magically these breakouts tend to prove that the companies turn around and fundamentally becoming strong. Also the magic happens when more diversification is done in various sectors under various scripts with equal money invested in each N500 scripts.
The real deal is when to purchase and where to purchase the stock. That is where Breakout study comes into play.
LET'S PUMP IN SOME MONEY AND REVOLUTIONIZE THE NATION'S ECONOMY!
Reliance infrastructure 1 DMade resistance Breakout .
RSI > 60 and growing since last few sessions
Volume is supporting and more than average volume .
Breakout Candle looks Positive and bullish

LONGReliance infrastructure with 5 years cup and handle pattern, volume buzz seen slowly picking up. Its debt slowly coming down. if you see the past history , bit risky company. but technically it is good. Fundamentals too reversed to positive zone.
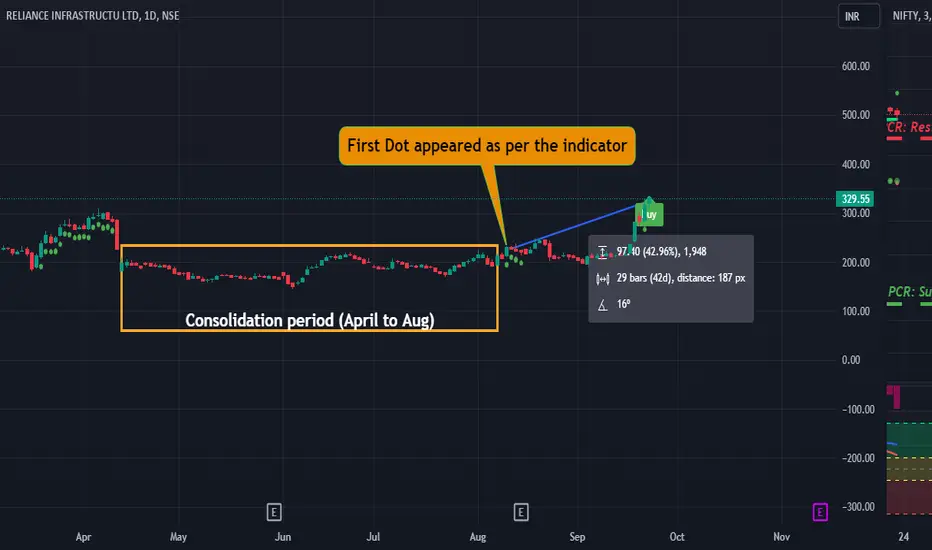
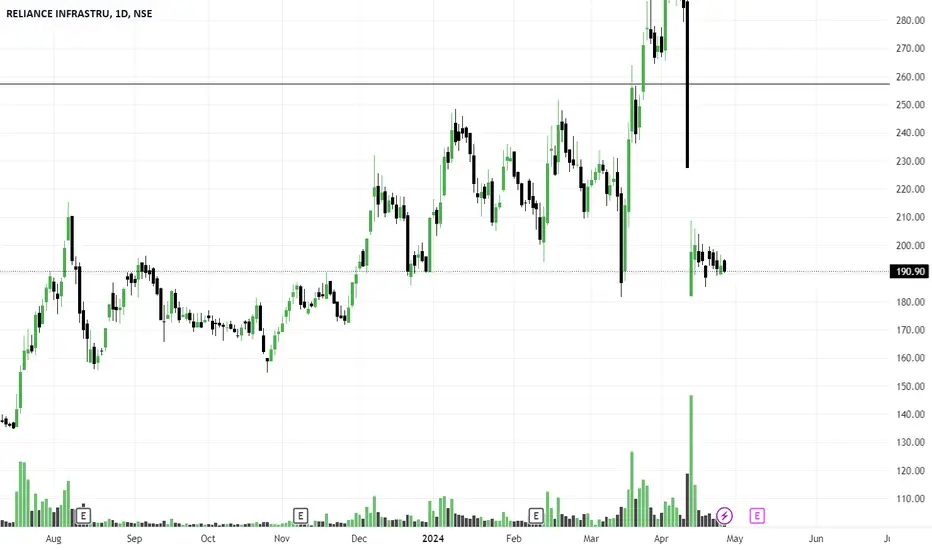
RELINFRA1. April 24th to Aug 24th the Stock was in consolidation phase.
2. First Dot indicating the momentum appeared on 9th Aug and later in 42 days given 42%!!
3. Expecting another 10% move in the coming days!!
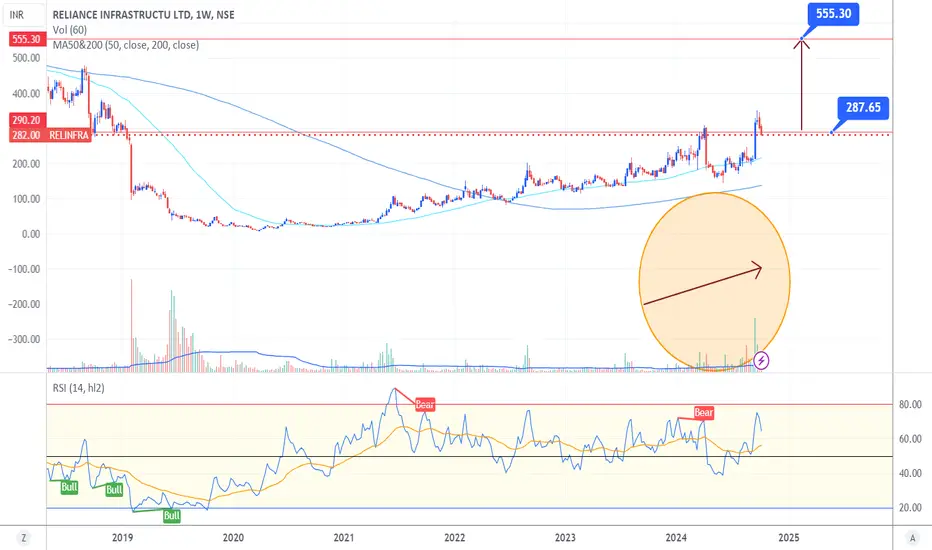
In Supply ZonePrice has taken support from 200ema suggesting price is in uptrend after a sudden fall.
Good volume buildup in weekly as well as in daily time frame.
Highest volume build up in in last one year.
Fundamentals are improving but not that great.
FII & DII stakes are up.
Price is in supply zone, wait for breakout for conformation.
NOTE: I do my analysis, do yours before trade.

#Reliance infrastructure Once again we can enter safe with 35% returns
We can see higher high and low high
After brake out of upwards we can take a trade for swing
# Reliance infrastructure for month We can see a very good opportunity in the stock as it is in bullish form
We can see higher high and low high in the stock
For long term the stock is good
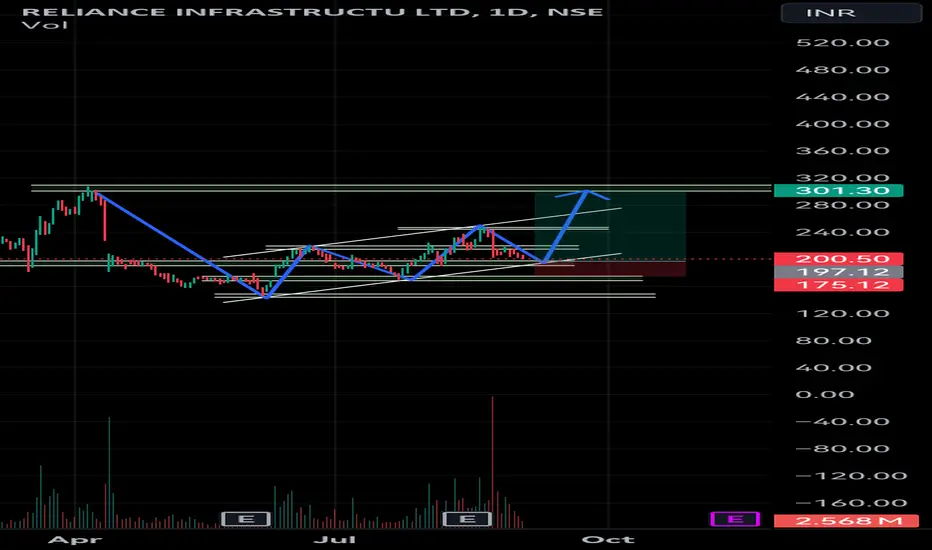
Reliance infra testing new high above 300+ SoonReliance infra testing new high above 300+ Soon
Perfect higher high higher low formation in both short and long time frame.
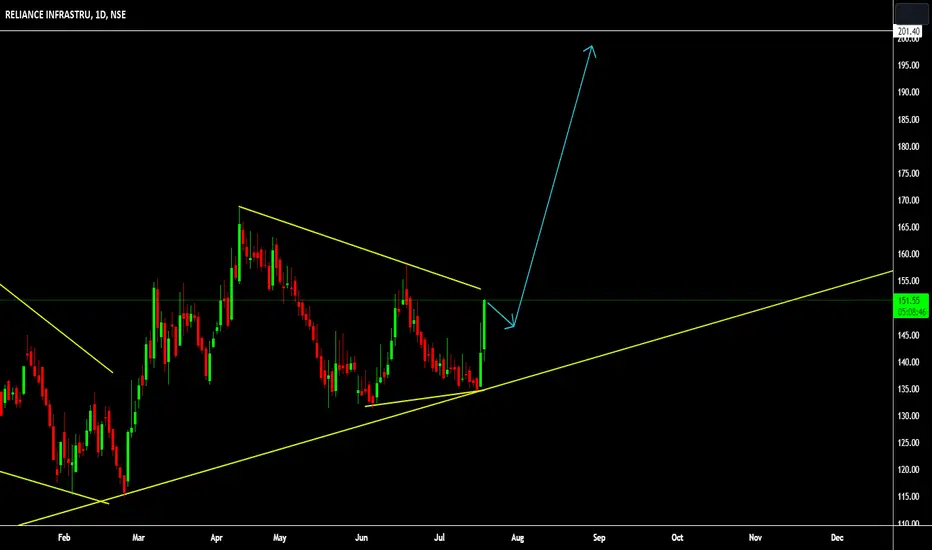
#Reliance infra for swing Reliance is ready for big move
As you can see in chat a clear picture of bull flag pattan for long position after government incarese infrastructure projects in India we can see this stock for touching top in few weeks

Reliance infra long at CMP with SL 185 on closing basisStock is hovering to its support after a massive fall, and looks like further fall is not coming unless stock closes below 185.
Reliance Infrastructure Daily ChartEducation only
Stock name Reliance Infrastructure.
Keep in Mind this is only for education purpose
The Reliable "Reliance Twins" - MultibaggersYou can see the Monthly charts of "Reliance Power" compared against "Reliance Infra". I am not calling them "Twins" just because its from same "Reliance Group"
But I was flabbergasted to see the Exact Chart Structure - from Similar Timelines. Channel Breakdown - Recovery - Trading inside the Channel and now finally Breakout of Multiyear channel.
Amazing Duo - Xerox copy of each other and both forming Multi-bagger Bullish Structures now...
Reliance Power Targets - 37, 45
Reliance Infra Targets - 300, 360, 450
Disclaimer:
Stocks-n-Trends is NOT a SEBI registered company. We do not provide Buy / Sell recommendations - rather we provide detailed analysis of how to review a chart, explain multi--timeframe views purely for Educational Purposes. We strongly suggest our followers to "Learn to Ride the Tide" and consult your Financial Advisors before taking any positions.
If you like our detailed analysis, please do rate us with your Likes, Boost and share your comments
-Team Stocks-n-Trends

💥Reliance Infrastructure💥-Nice Breakout💥Reliance Infrastructure💥-Nice Breakout
Capital to be deployed- 20k
Investing Price-205-210
Breakout Price-204
Stoploss-159
Targets-343-409
RT for max reach
#Reliance #stockstowatch #StocksToBuy #StocksInFocus #stocks #StockMarket

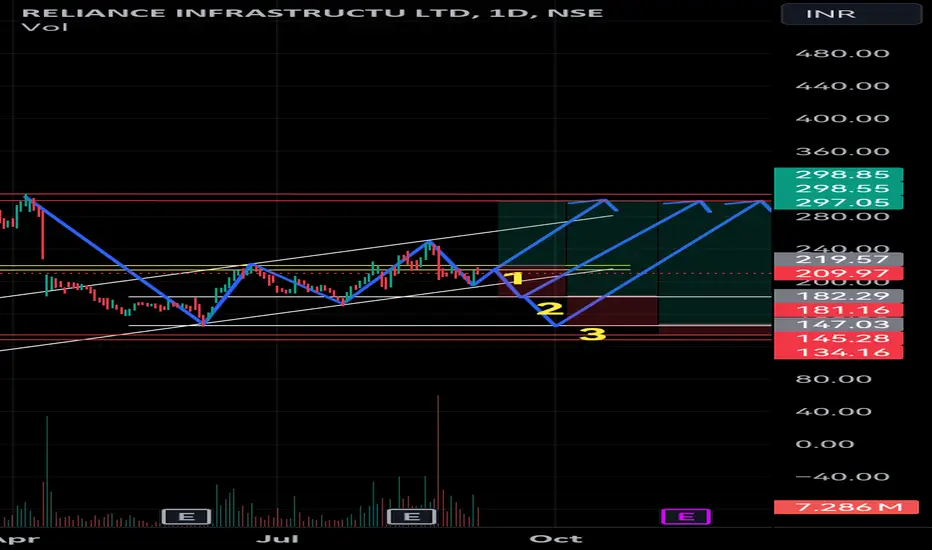
DAILY CHART - RELIANCE INFRAThe Structure looks good to us, waiting for this instrument to correct and then give us these opportunities as shown on this instrument (Price Chart).
Note: Its my view only and its for educational purpose only. Only who has got knowledge about this strategy, will understand what to be done on this setup. its purely based on my technical analysis only (strategies). we don't focus on the short term moves, we look for only for Bullish or Bearish Impulsive moves on the setups after a good price action is formed as per the strategy. we never get into corrective moves. because it will test our patience and also it will be a bullish or a bearish trap. and try trade the big moves.
we do not get into bullish or bearish traps. We anticipate and get into only big bullish or bearish moves (Impulsive Moves). Just ride the Bullish or Bearish Impulsive Move. Learn & Know the Complete Market Cycle.
Buy Low and Sell High Concept. Buy at Cheaper Price and Sell at Expensive Price.
Keep it simple, keep it Unique.
please keep your comments useful & respectful.
Thanks for your support....
Tradelikemee Academy
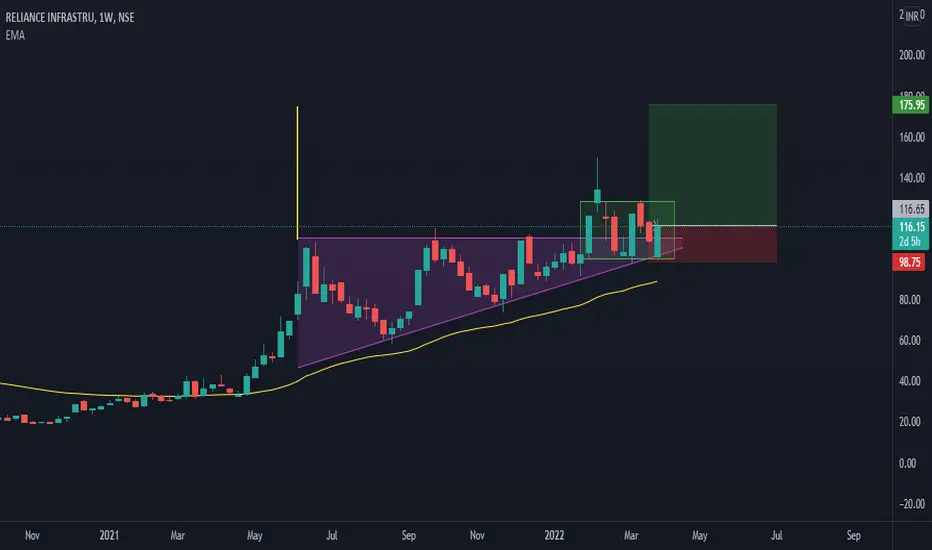
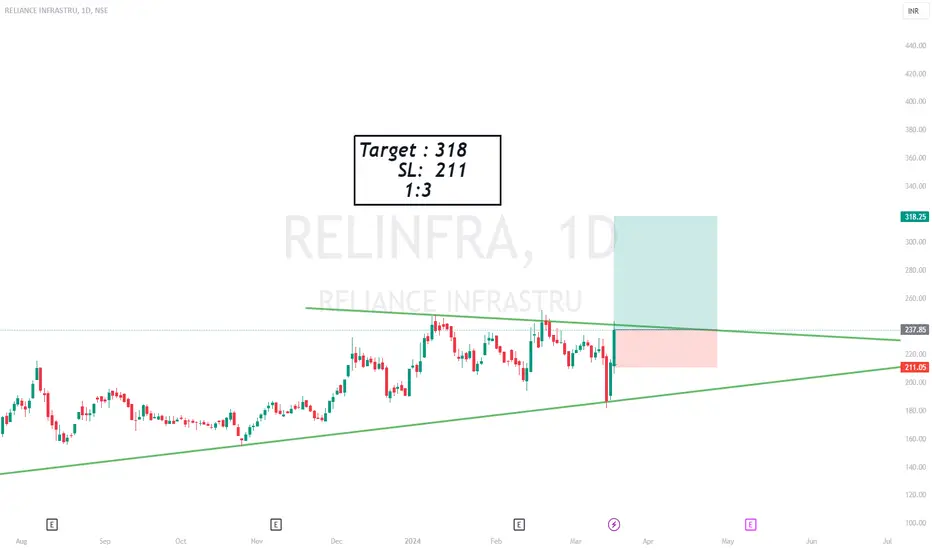
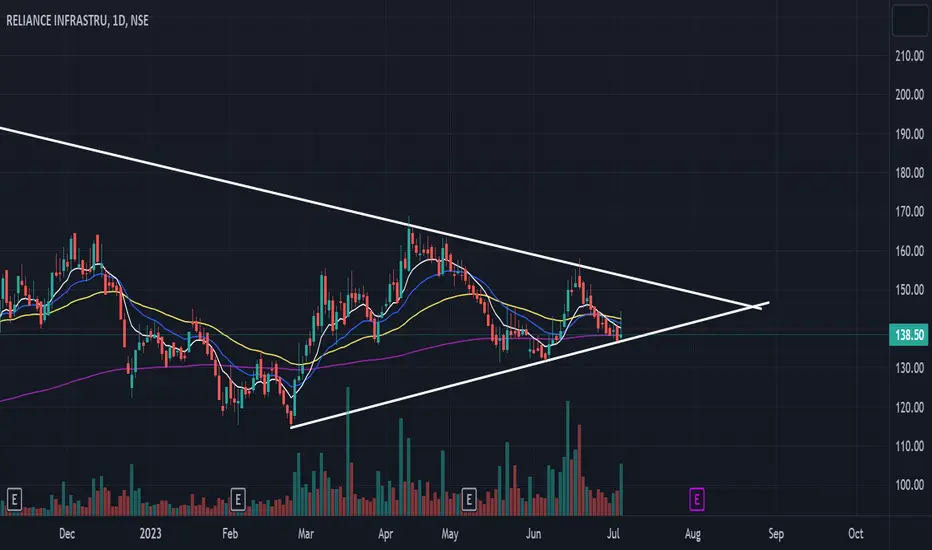
A breakout possibility.The RELINFRA has symmetrical triangle pattern formation and the price movements respects the pattern in multiple resistance and supports. So watchout for it.
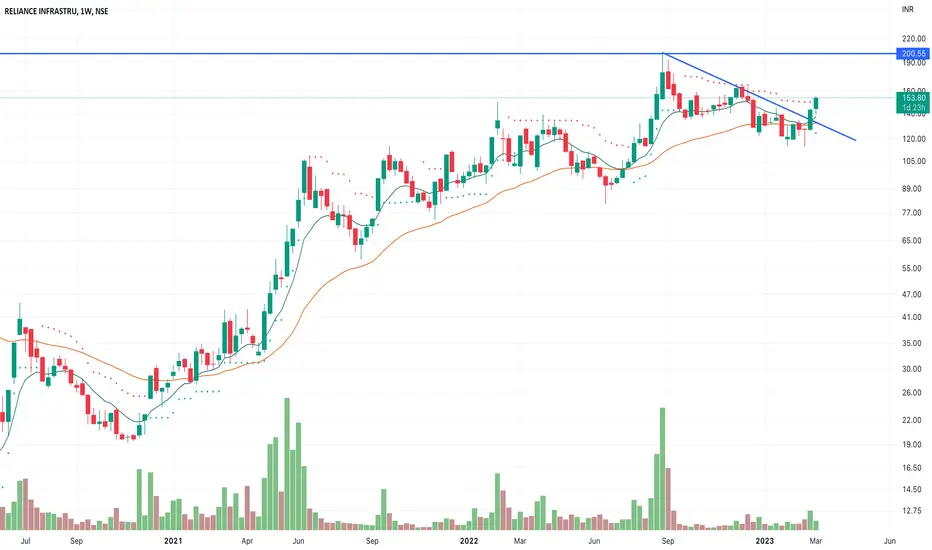
RELINFRA - Weekly AnalysisIn the Weekly Chart of RELINFRA ,
we can see that, After breakout failure it has given a comeback.
It has big targets waiting.

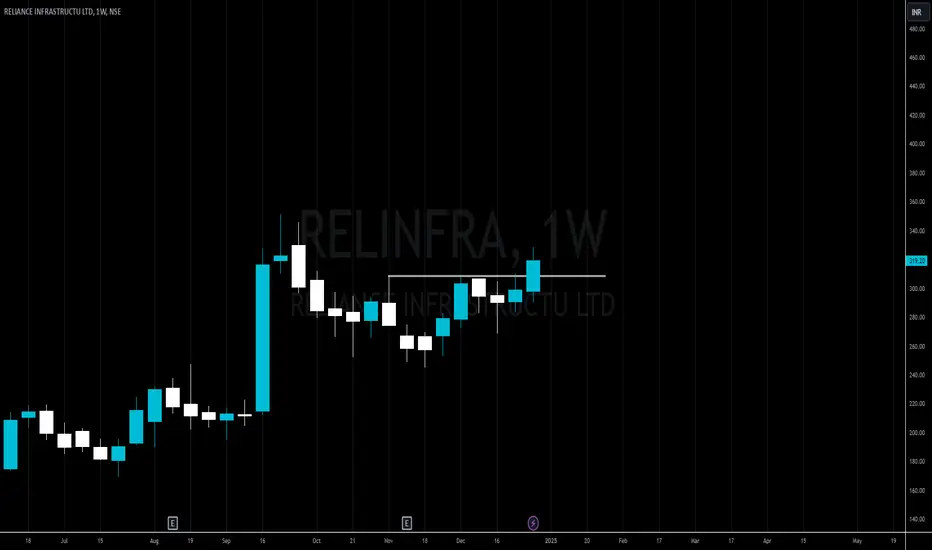
reliance infra has a target of 282reliance infra has broken out of cup & handle pattern...........height of the cup which is 282 is the target for the stock

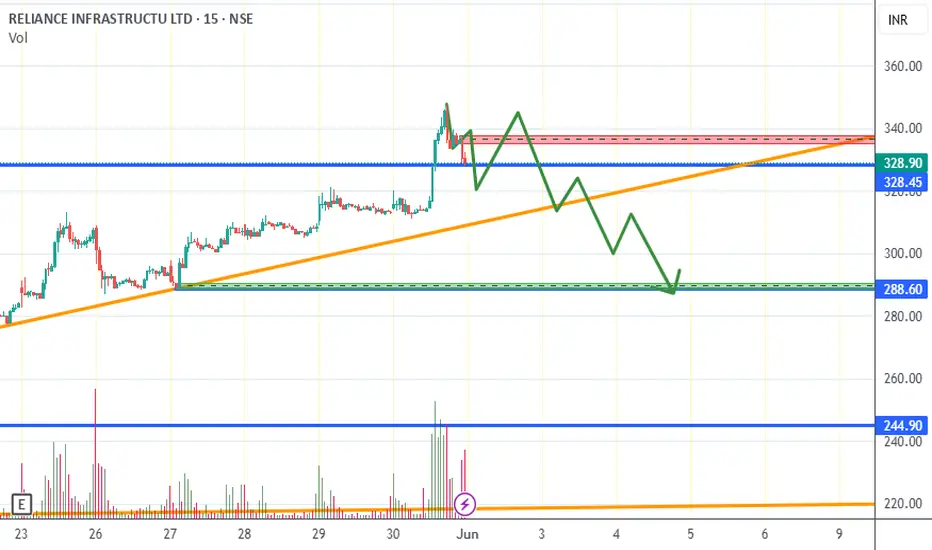
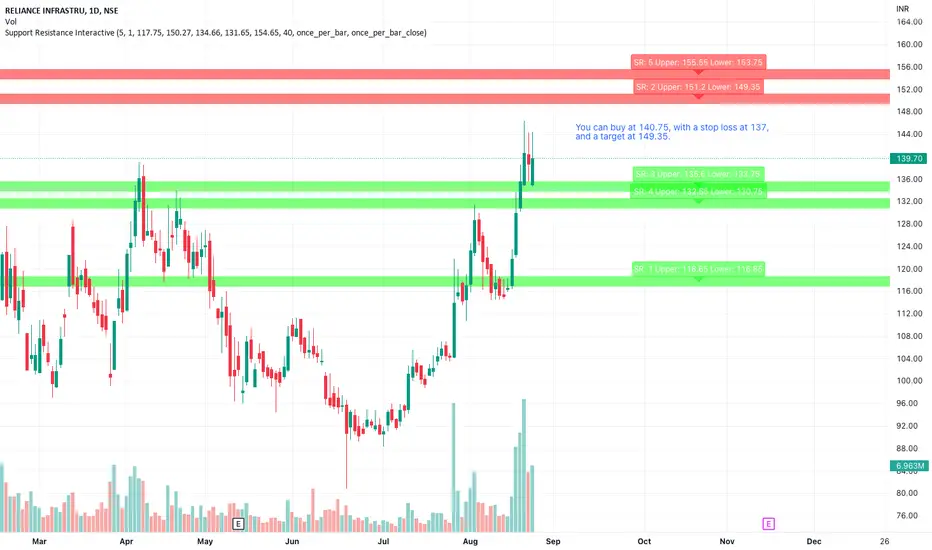
Reliance Infra Idea for 25 August, 2022 - TradesetupYou can buy at 140.75, with a stop loss at 137, and a target at 149.35.
Reliance infra telin good position to break point, if the expected break out hapening ,then it will move up side the easy tgt is 285

Reliance Infra, Positional Trade. There is an Ascending Triangle Pattern formed on a weekly chart of Reliance Infra. There has been a shakeout, due to news flows of Russia-Ukraine news, but the pattern still remains intact.
Caution : There is an overhead supply above 135, so do keep this in mind.