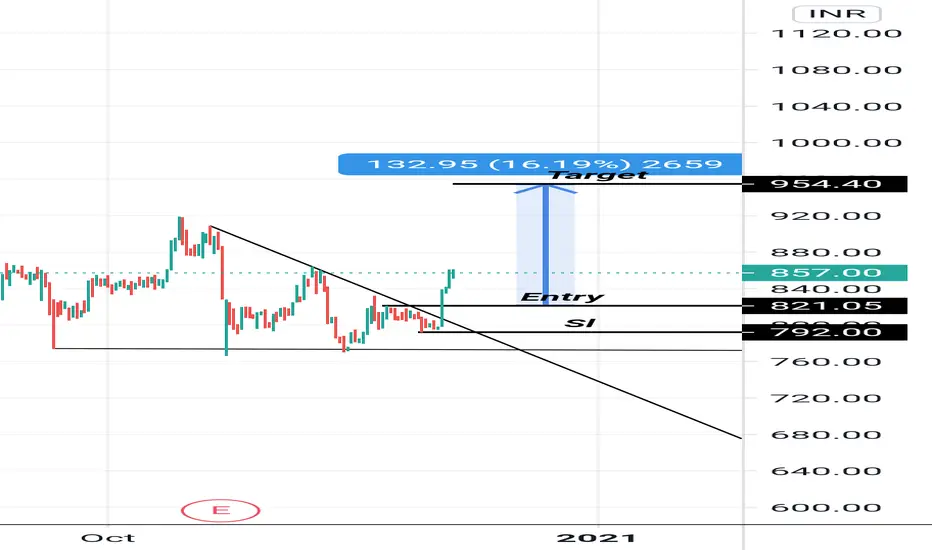
SBICARD - Morning Star at support level - Short Term swingThe above analysis is done purely on basis of Price Action & Chart Patterns.
The analysis is done on daily TF hence price may take few days to few weeks in order to reach the targets
Logic, Entry range, SL are shown in image itself.
The above analysis is purely for educational purpose. Traders must do their own study before entering into any trade. Traders must trade as per their own risk taking capacity and money management.
Feel Free to comment for any query or suggestion regarding this stock or Price Action Analysis.
Checkout my other ideas to understand how one can earn from stock markets with simple trade setups.
SBICARD trade ideas

sbicardSBI card has retest its breakout level also it has taken support at ichimoku cloud. it may rise till 1000+ till it holds 900 levels

SBICARD IMPORTANT LEVELS FOR BUYINGSBICARD has seen a remarkable rally from 500 levels to 1100 levels in the past 1 year.
Currently, we are seeing some correction in the stock.
The monthly and weekly structure is still positive, though it looks weak on the daily chart and the current price action also indicates that this correction can extend a little more.
Important support that Weekly and daily chart gives around 850 levels.
And the major support levels come around 799 - 670, which you can say lifeline support.
So keep an eye on the stock and grab the opportunity when stock presents it to you.
Trade/Invest at your own risk.

Possible continuation of SBI card break outLooks good in continuously following the initial trendline.

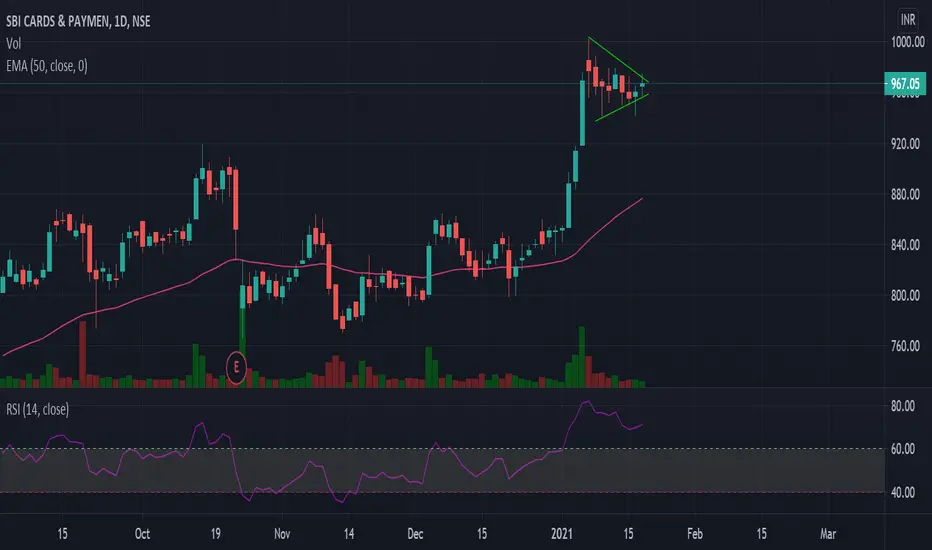
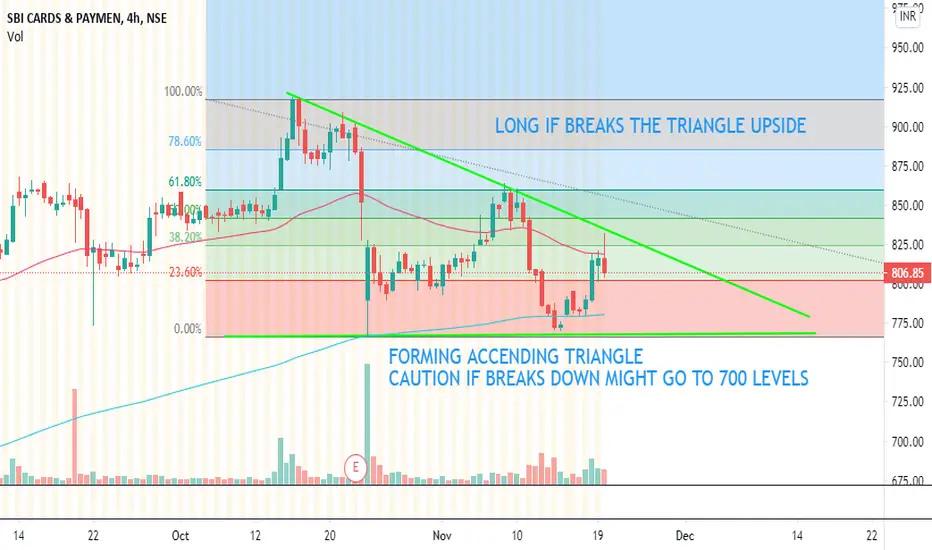
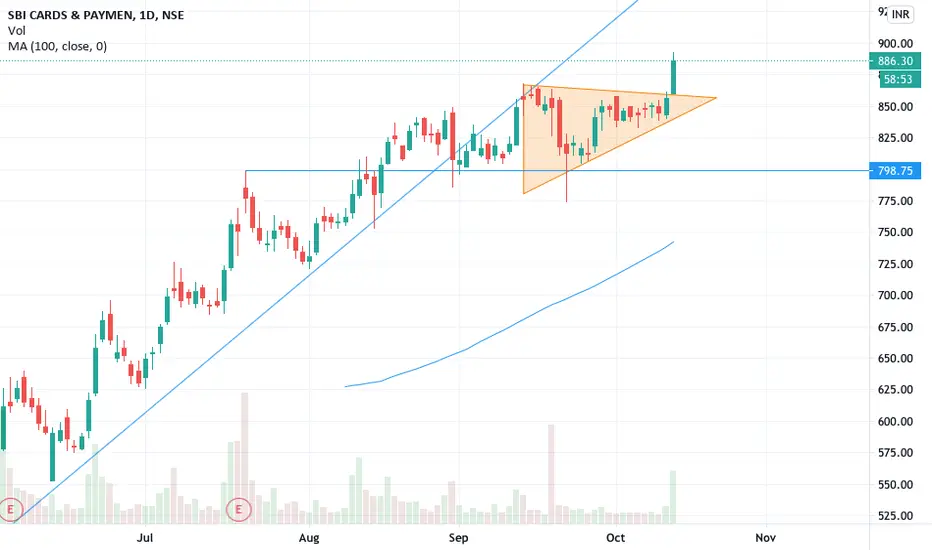
SBICARD - Ascending Triangle pattern - Short term swing tradeThis analysis is purely based on price action and Chart Patterns.
The analysis is on 30min TF hence target can be achieved in intraday trade or in couple of days.
Trade logic with SL and Target is explained in image itself.
Don't chase the price. Always plan your trade & trade your plan
Keep trailing SL accordingly once entered into the trade.
This analysis is purely for education purpose. Kindly do your own study before entering into any trade .
Also check out my other ideas to understand how price action works and how it can be used to make regular profits without any complex strategies.
Feel Free to comment for any queries regarding the above stock or price action analysis in general.


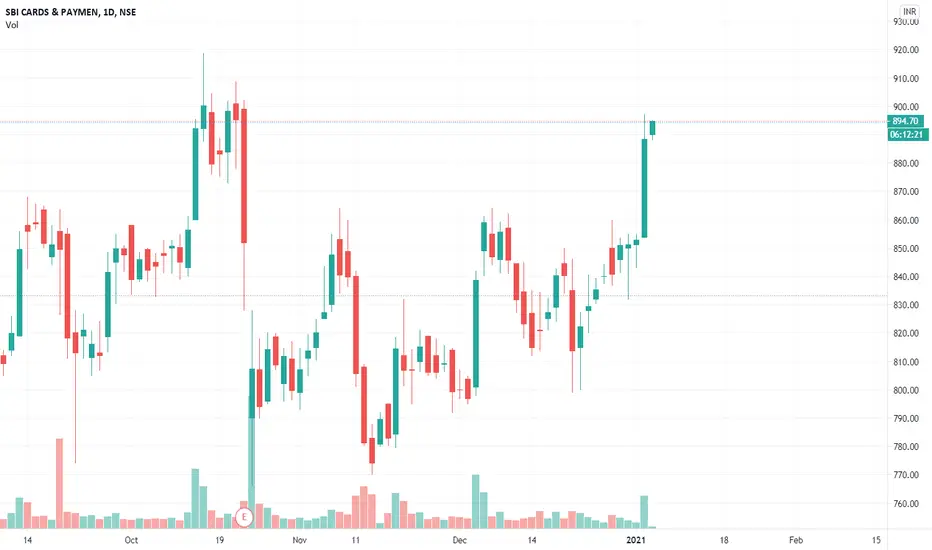
Long: SBI CardsClassic Pole & FLag pattern on Daily Chart, on the verge of Break out,
Should go higher once the stock breaks the upper line...Immediate Target Should be 980 and thereafter stock can attempt for 1000 on positional basis
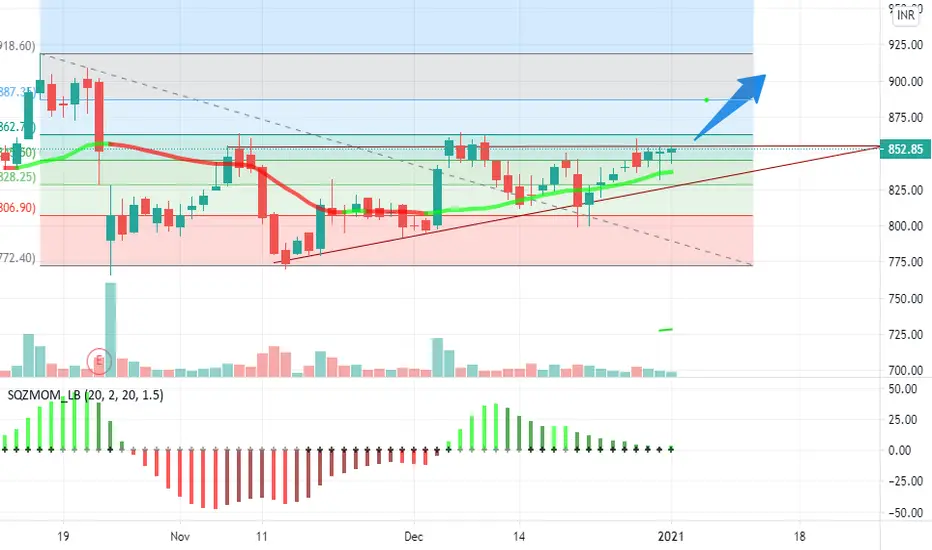
SBICARD_educational viewIf SBICARD consistently maintains 855 level (within 1-2% error band), then breakout possible before 05/01/2021 and shall achieve midterm target of 1050 (on or before 15/01/2021)
Immediate Support at 805
Strong Support at 782
For this period, 16-12-2020 to 05-01-2021, 820-856 would acts as support line.
Only an educational view
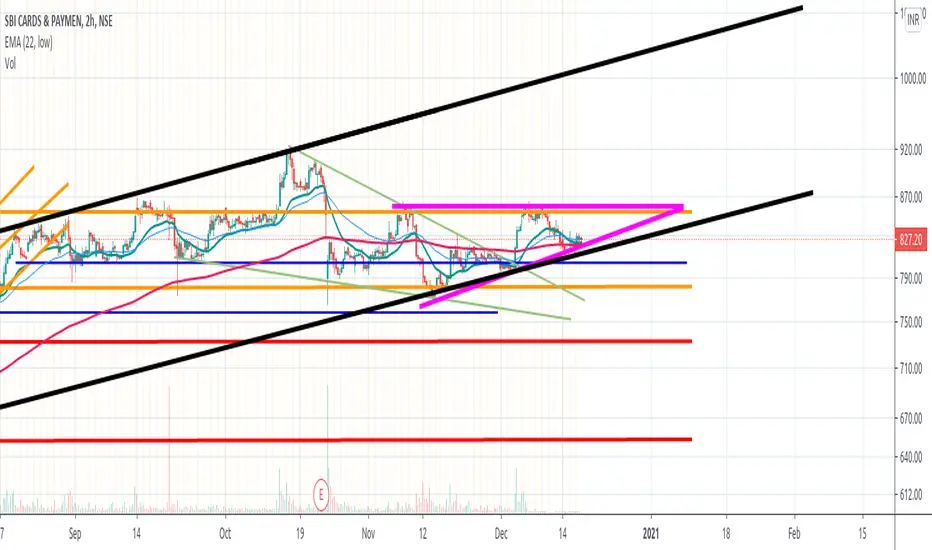
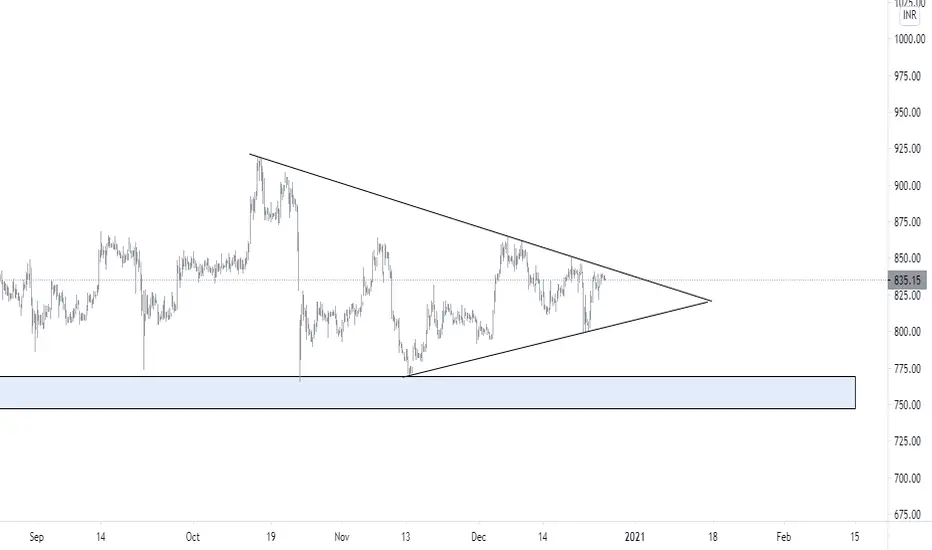
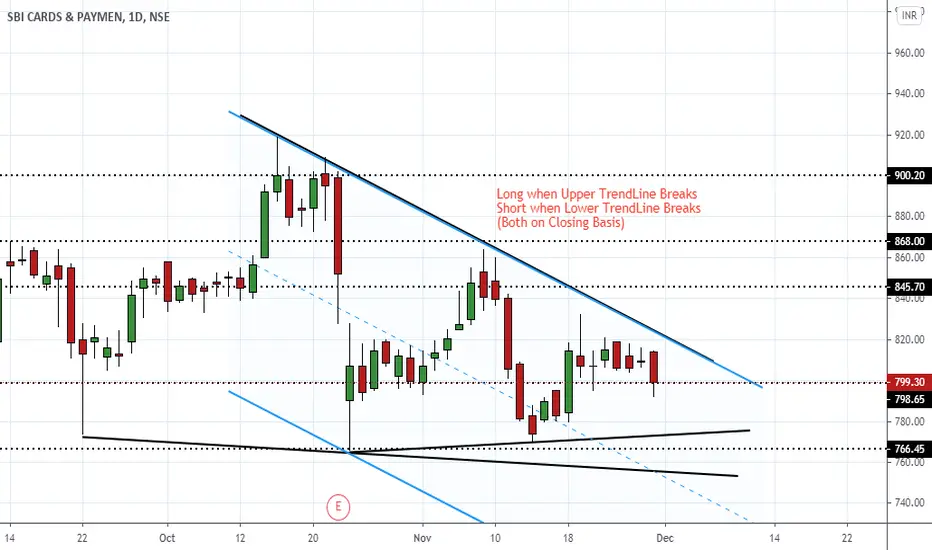
SBICARD TUG OF WARSBICARD is on tug of war between Bulls and Bear. It is forming Triangle Pattern therefore if it breaks upper trend line one can go for Long, however, if it is being controlled by bear they can shed it upto lower trendline. If it comes in control of bears they can further shed it to 760-755 where it can consolidate further for fresh upside. As of now no steam is being shown by it hence we are looking for price to kiss lower trendline.


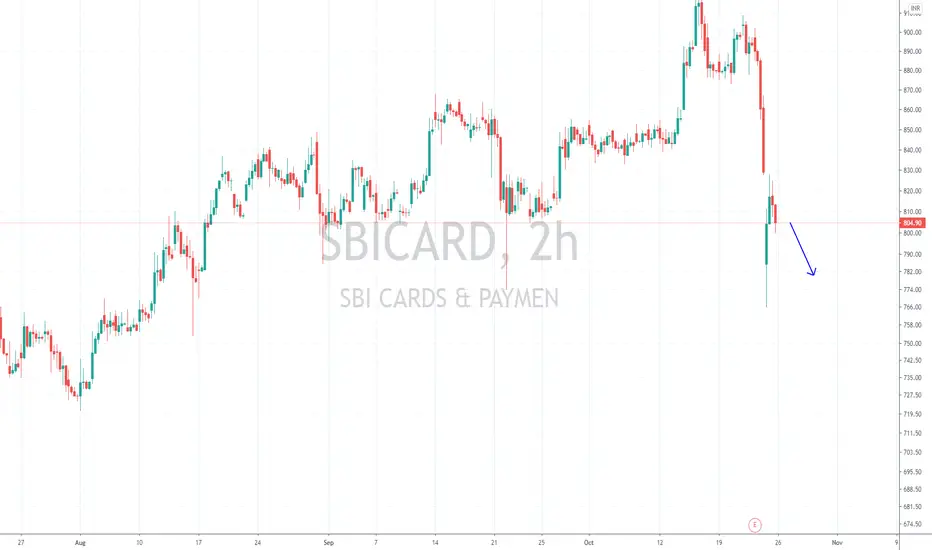
SBI Card - Intraday / Swing Trade SetupSBI Card CMP - 807.25
Looking bullish in weekly time frame. One can go for Intraday / Swing trade setup with the following entry, exit & targets
Sell at or below - 805 - 803 / Stop Loss 820
Target 1 - 800
Target 2 - 795
Target 3 – 790 / 785
Note: This is my view and for educational purpose only.
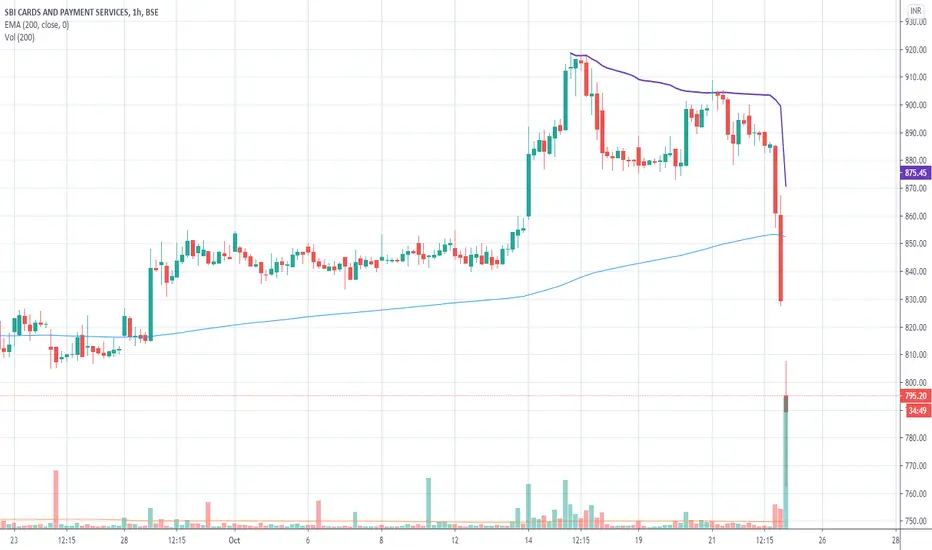
SBI Cards - Anchored VWAP had told the story much beforeSBI Cards - If one had plotted the AVWAP at its Peak and followed for few days, there were enough signals to EXIT. Red candles with Volume were the definitely ones.
DIsc: Not a SEBI registered. I post charts for self study.

SBICARD NSE Breaking Out of Triangle with Good VolumeSBI Card is breaking out of Triangle with good volume, The candle being formed is bullish belt hold, if it holds this position by EOD, Good Buying opportunity with SL of 867.
Disclaimer:
No Liability
Trade at Own Risk
For Educational Purpose Only

#SBICardsSBI Cards is bullish in higher time frame after Breaking ATH. Though it still hasn't gave a good move.
We can see a raw ATP in 75M TF. We can expect a decent move once it Breaks the TL.
