Key stats
About NIPPONAMC - NETFSILVER
Home page
Inception date
Feb 2, 2022
Structure
Open-Ended Fund
Replication method
Physical
Dividend treatment
Capitalizes
Primary advisor
Nippon Life India Asset Management Ltd. (Invt Mgmt)
ISIN
INF204KC1402
The investment objective of the scheme is to generate returns that are in line with the performance of physical silver in domestic prices, before expenses, subject to tracking errs. However, there can be no assurance or guarantee that the investment objective of the Scheme will be achieved
Related funds
Classification
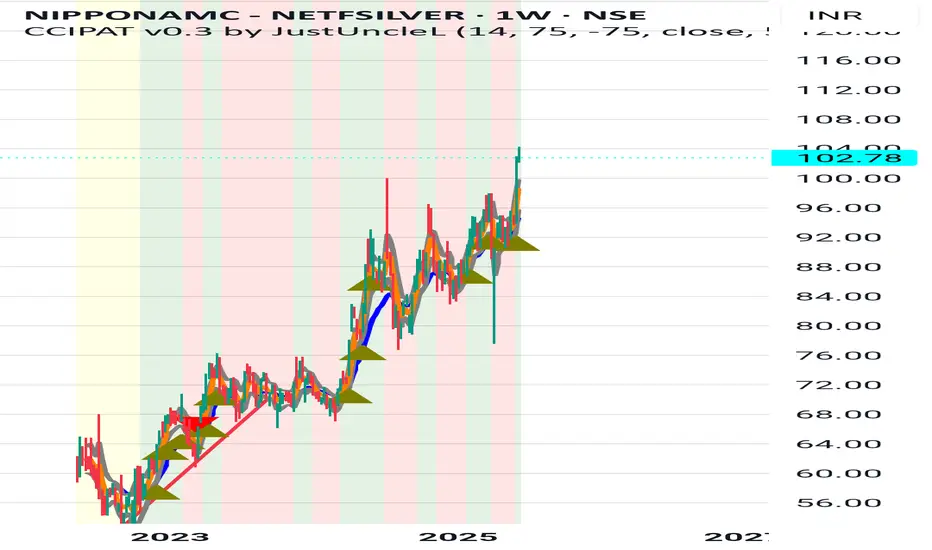
SILVERBEES 🚀 SILVERBEES Looking Strong! 🚀
Silver prices are gaining momentum, and SILVERBEES is showing strength! 📈 With the global market supporting precious metals, this could be a great time to accumulate on dips. Keep an eye on it for potential upside! 🔥
#Silver #SILVERBEES #Commodities #StockMarket #Inv
oppurtunity coming in dec/feb months for accumulating silverbeesNSE:SILVERBEES
a double top is clear i believe a 80/78 levels should be coming and will be very good for accumulating
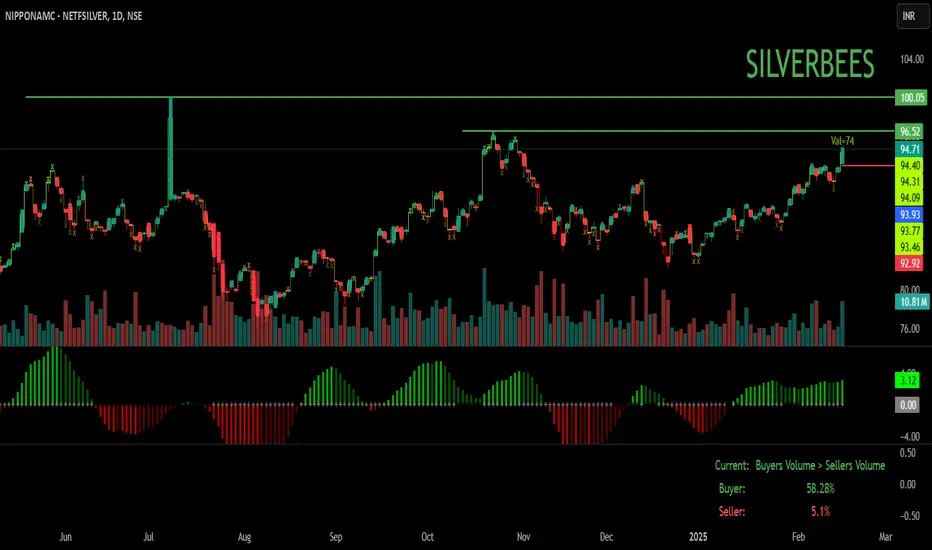
Key Levels:
₹87-89: Resistance zone; price needs to break and sustain above this for further upside.
₹80-85: Primary accumulation zone, as it aligns with VPVR volume spikes and mov
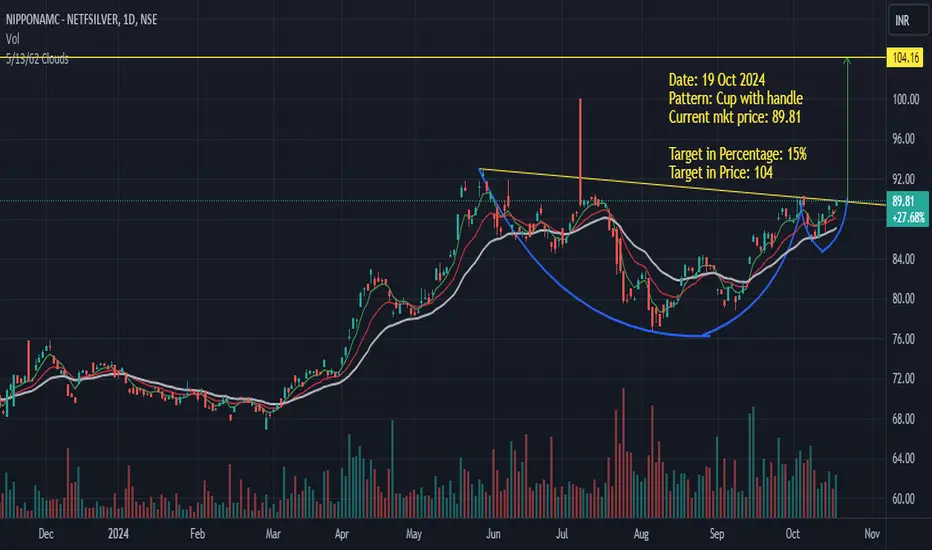
Can Silver / Silverbees can go 15 % up ?Please find my below study ref chart for details
Note: The yellow line breakout has not happened yet in Silverbees but the breakout happened in MCX Silver
Pattern: Cup with handle
Current mkt price: 89.81
Target in Percentage: 15%
Target in Price: 104
Disclaimer: This is my personal view, and I a

Can Silver / Silverbees go 15 % up ?Please find my below study ref chart for details
Note: The yellow line breakout has not happen yet in Silverbees but the breakout happened in MCX Silver
Pattern: Cup with handle
Current mkt price: 89.81
Target in Percentage: 15%
Target in Price: 104
Disclaimer: This is my personal view, sharing
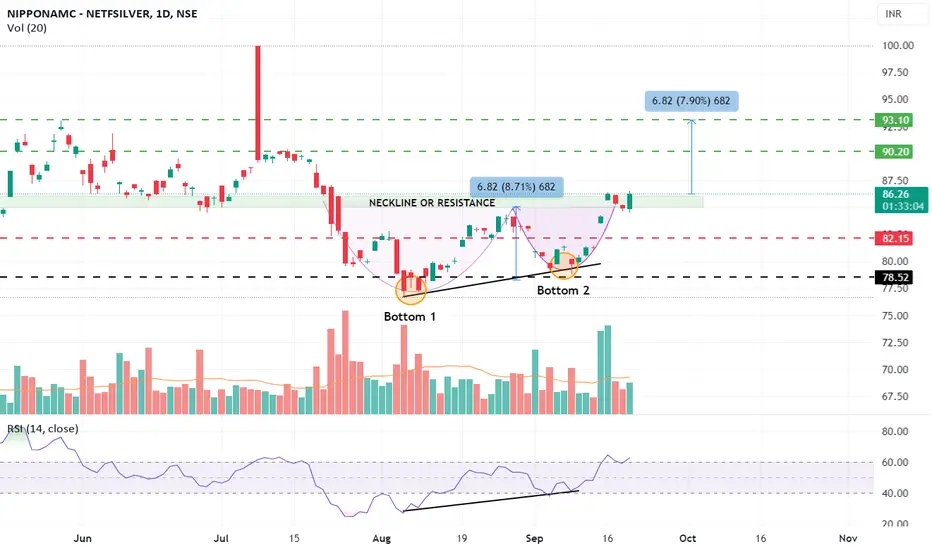
Double Bottom Breakout on NETFSILVEROverview: The chart for NETFSILVER (Nippon India ETF) is showing a classic Double Bottom pattern, a bullish reversal signal that suggests a potential upward move. This pattern emerged after a period of consolidation near the ₹78.52 support zone, followed by two distinct troughs, marked as Bottom 1
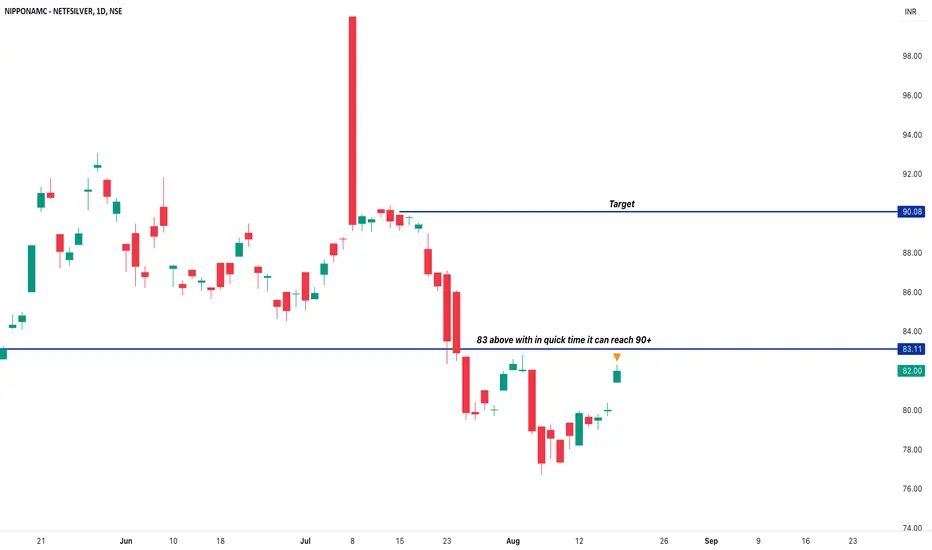
Nippon India Silver ETFNippon India Silver ETF
Looks good above 83
Target 90+
83 is an very important level for this stock.
As per the GANN calculations.
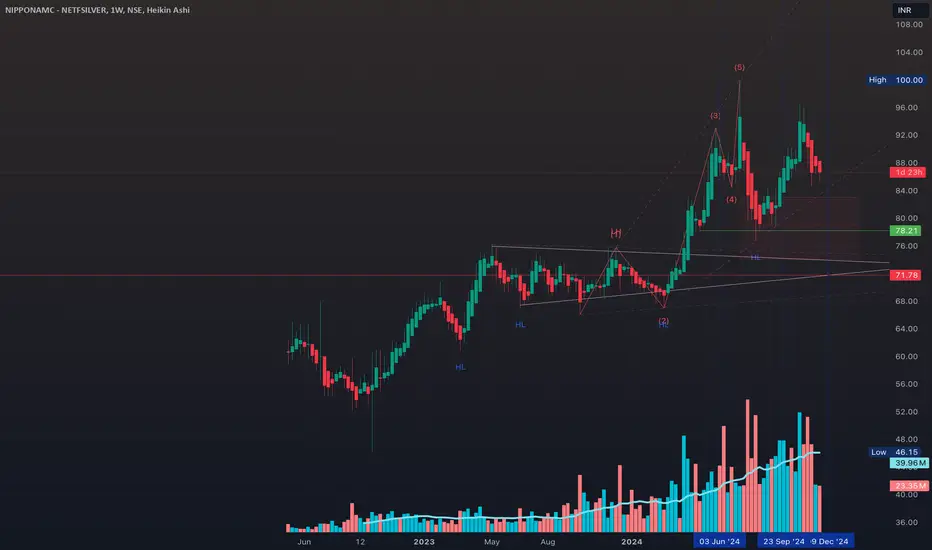
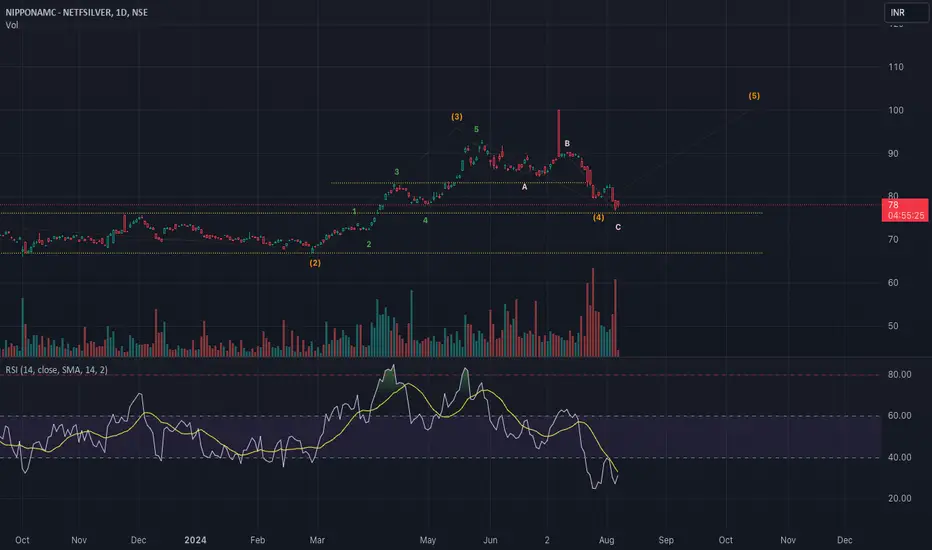
Nippon Silver ETFSilver trading at support zone with a positive divergence in oversold zone. It seems silver has completed its 4th wave down and now getting ready for 5th wave up.
SILVERBEES : Took a position for about 5% of the capitalI held a strong conviction regarding a potential move in Silver, as detailed in the attached post. To capitalize on this anticipated move, I initiated a position in Silverbees, committing approximately 5% of the capital. I am open to augmenting the position should the price decline to the lower tren

See all ideas
Summarizing what the indicators are suggesting.
Oscillators
Neutral
SellBuy
Strong sellStrong buy
Strong sellSellNeutralBuyStrong buy
Oscillators
Neutral
SellBuy
Strong sellStrong buy
Strong sellSellNeutralBuyStrong buy
Summary
Neutral
SellBuy
Strong sellStrong buy
Strong sellSellNeutralBuyStrong buy
Summary
Neutral
SellBuy
Strong sellStrong buy
Strong sellSellNeutralBuyStrong buy
Summary
Neutral
SellBuy
Strong sellStrong buy
Strong sellSellNeutralBuyStrong buy
Moving Averages
Neutral
SellBuy
Strong sellStrong buy
Strong sellSellNeutralBuyStrong buy
Moving Averages
Neutral
SellBuy
Strong sellStrong buy
Strong sellSellNeutralBuyStrong buy
Displays a symbol's price movements over previous years to identify recurring trends.
Frequently Asked Questions
An exchange-traded fund (ETF) is a collection of assets (stocks, bonds, commodities, etc.) that track an underlying index and can be bought on an exchange like individual stocks.
SILVERBEES trades at 103.76 INR today, its price has risen 0.44% in the past 24 hours. Track more dynamics on SILVERBEES price chart.
SILVERBEES price has risen by 9.81% over the last month, and its yearly performance shows a 16.57% increase. See more dynamics on SILVERBEES price chart.
NAV returns, another gauge of an ETF dynamics, have risen by −4.02% over the last month, have fallen by −4.02% over the last month, showed a −0.23% decrease in three-month performance and has increased by 3.75% in a year.
NAV returns, another gauge of an ETF dynamics, have risen by −4.02% over the last month, have fallen by −4.02% over the last month, showed a −0.23% decrease in three-month performance and has increased by 3.75% in a year.
SILVERBEES fund flows account for 70.50 B INR (1 year). Many traders use this metric to get insight into investors' sentiment and evaluate whether it's time to buy or sell the fund.
Since ETFs work like an individual stock, they can be bought and sold on exchanges (e.g. NASDAQ, NYSE, EURONEXT). As it happens with stocks, you need to select a brokerage to access trading. Explore our list of available brokers to find the one to help execute your strategies. Don't forget to do your research before getting to trading. Explore ETFs metrics in our ETF screener to find a reliable opportunity.
SILVERBEES expense ratio is 0.51%. It's an important metric for helping traders understand the fund's operating costs relative to assets and how expensive it would be to hold the fund.
No, SILVERBEES isn't leveraged, meaning it doesn't use borrowings or financial derivatives to magnify the performance of the underlying assets or index it follows.
In some ways, ETFs are safe investments, but in a broader sense, they're not safer than any other asset, so it's crucial to analyze a fund before investing. But if your research gives a vague answer, you can always refer to technical analysis.
Today, SILVERBEES technical analysis shows the buy rating and its 1-week rating is buy. Since market conditions are prone to changes, it's worth looking a bit further into the future — according to the 1-month rating SILVERBEES shows the strong buy signal. See more of SILVERBEES technicals for a more comprehensive analysis.
Today, SILVERBEES technical analysis shows the buy rating and its 1-week rating is buy. Since market conditions are prone to changes, it's worth looking a bit further into the future — according to the 1-month rating SILVERBEES shows the strong buy signal. See more of SILVERBEES technicals for a more comprehensive analysis.
No, SILVERBEES doesn't pay dividends to its holders.
SILVERBEES trades at a premium (0.18%).
Premium/discount to NAV expresses the difference between the ETF’s price and its NAV value. A positive percentage indicates a premium, meaning the ETF trades at a higher price than the calculated NAV. Conversely, a negative percentage indicates a discount, suggesting the ETF trades at a lower price than NAV.
Premium/discount to NAV expresses the difference between the ETF’s price and its NAV value. A positive percentage indicates a premium, meaning the ETF trades at a higher price than the calculated NAV. Conversely, a negative percentage indicates a discount, suggesting the ETF trades at a lower price than NAV.
SILVERBEES shares are issued by Nippon Life Insurance Co.
SILVERBEES follows the MCX Silver (INR/kg). ETFs usually track some benchmark seeking to replicate its performance and guide asset selection and objectives.
The fund started trading on Feb 2, 2022.
The fund's management style is passive, meaning it's aiming to replicate the performance of the underlying index by holding assets in the same proportions as the index. The goal is to match the index's returns.