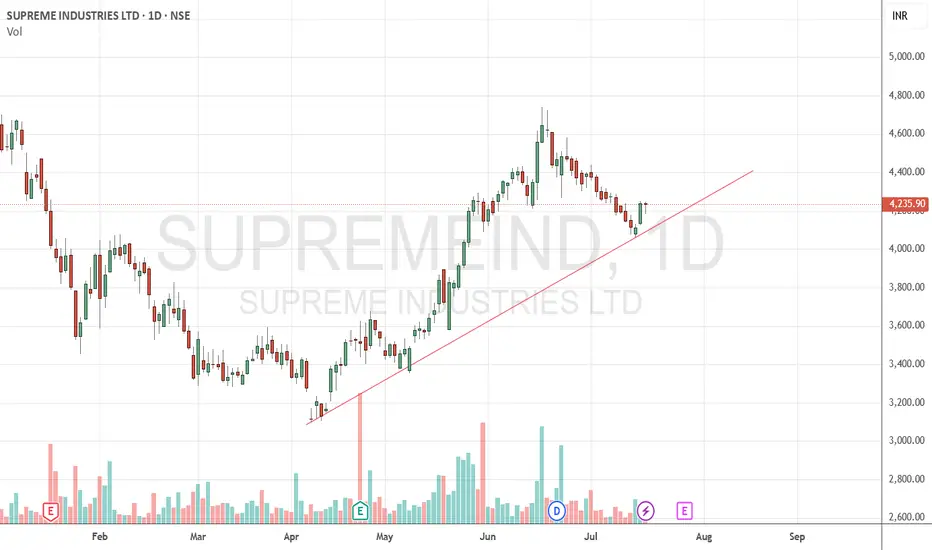
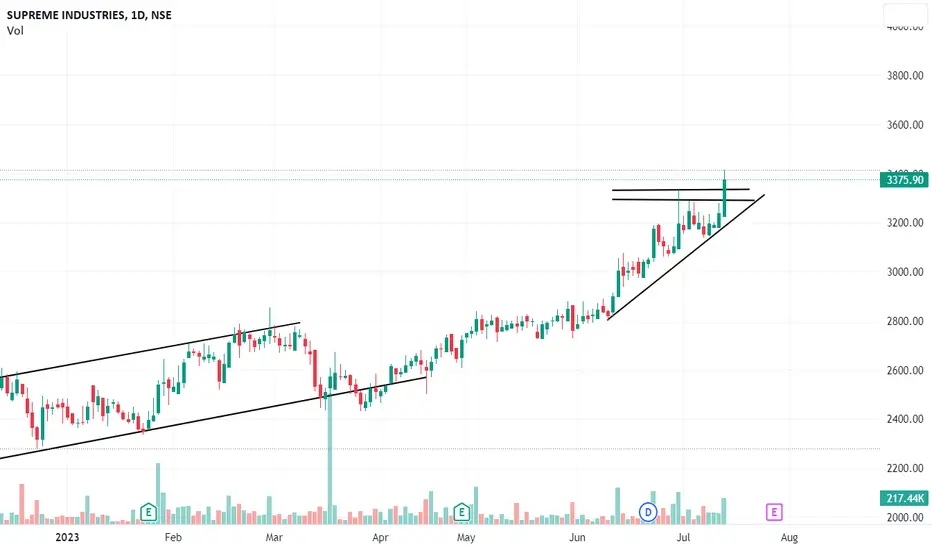
Supreme Industries BuySupreme Industries seems to take support from trend line. Buy @CMP (4236) with SL of 4060 and Target of 4400, 4700 & 5150
SUPREMEIND trade ideas
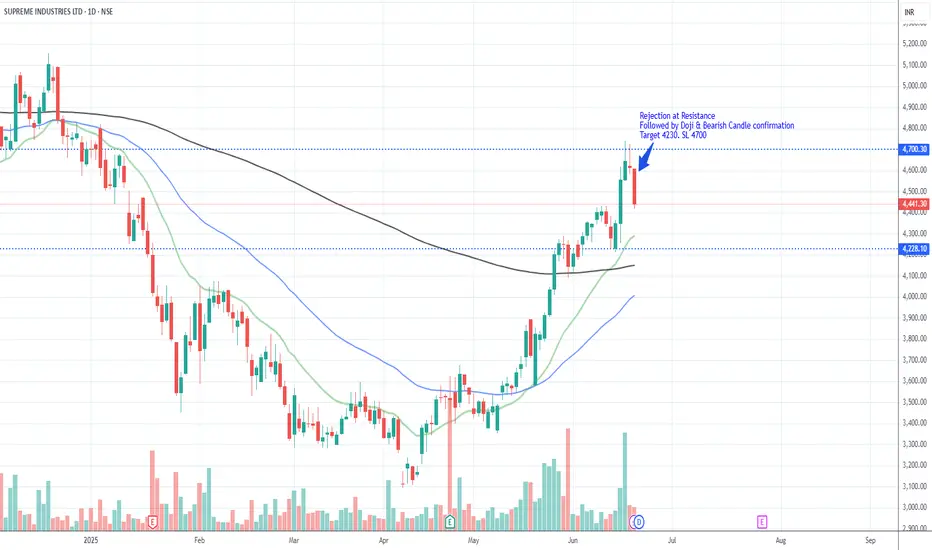
SupremeIND_Price rejection @ Resistance_ShortRejection at Resistance
Followed by Doji & Bearish Candle confirmation
Target 4230. SL 4700
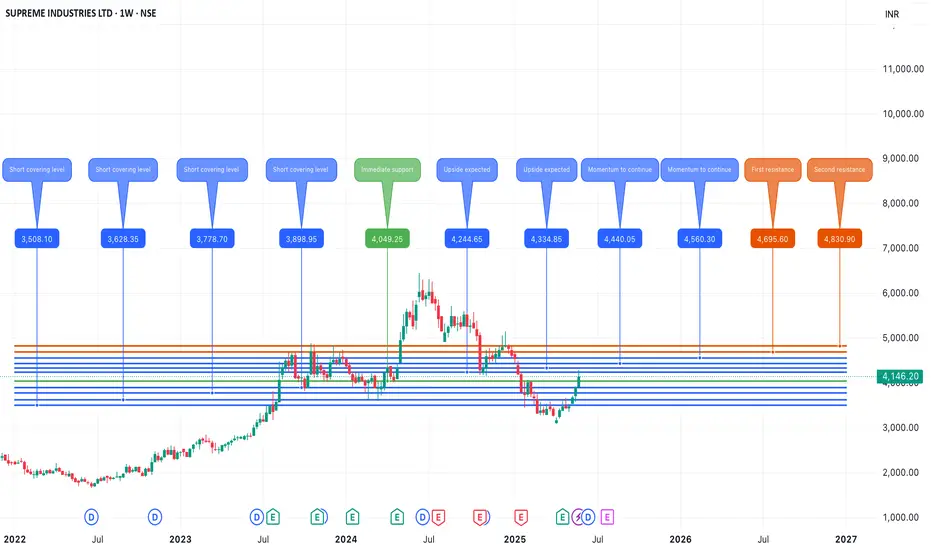
SUPREME INDUSTRIES SHORT TO MEDIUM TERM ANALYSISSupreme Industries is looking positive post recent short covering , now trading at 4165 indicating upside momentum to continue . An important level to watch for further upside would be 4244 and it can continue its upside upto levels of 4695-4830 in the short to medium term . On the downside, imp support would be 4049 and if it breaches this support then we can expect short covering at marked levels in the chart posted. THIS VIEW REMAINS INVALIDATED IF SUPREME IND BREACHES 3500 ON THE DOWNSIDE.
THIS IS MY PERSONAL VIEW AND NOT A BUY/SELL RECOMMENDATION.
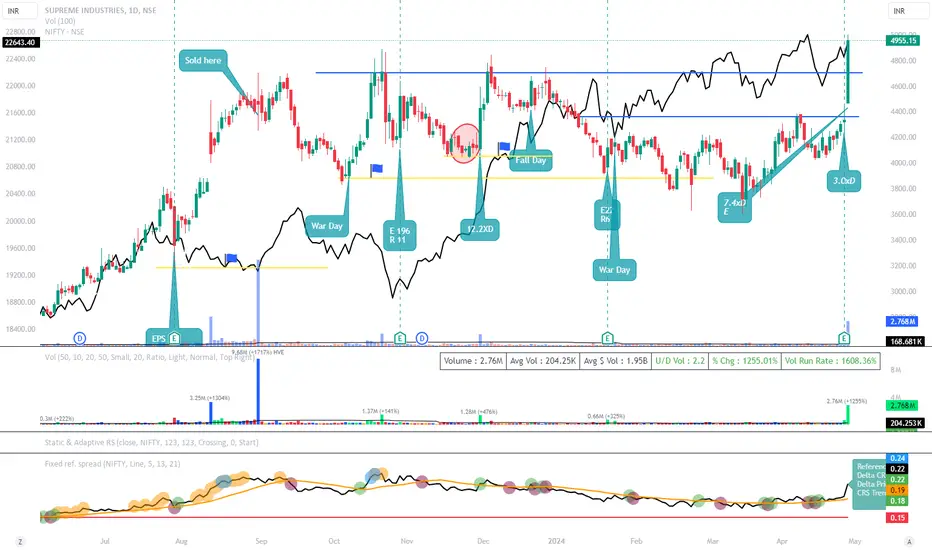
SUPREME INDUSTRIES LTD SWING TRADE SETUP📊 Price Action & Trend Analysis
Analyzing market trends using price action, key support/resistance levels, and candlestick patterns to identify high-probability trade setups.
Always follow the trend and manage risk wisely!
Price Action Analysis Interprets Market Movements Using Patterns And Trends On Price Charts.
👉👉👉Follow us for Live Market Views/Trades/Analysis/News Updates.
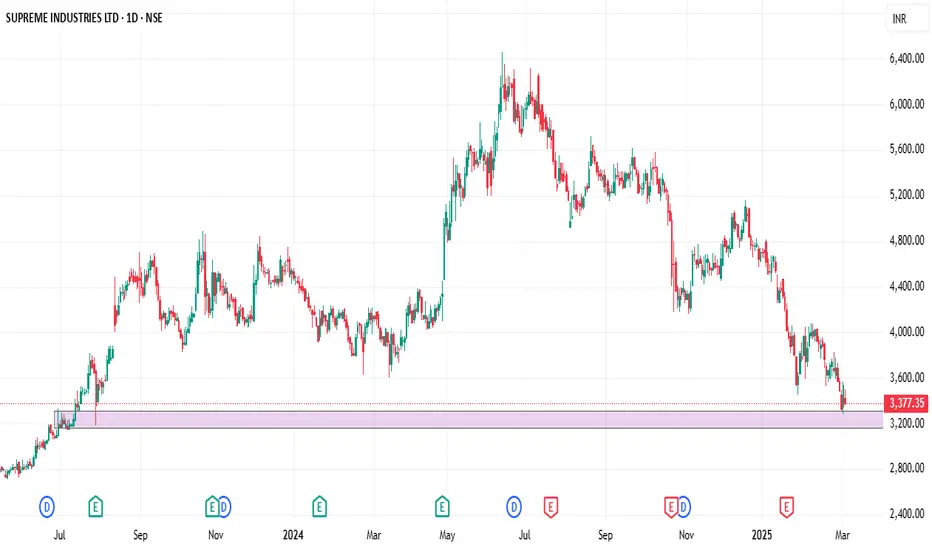
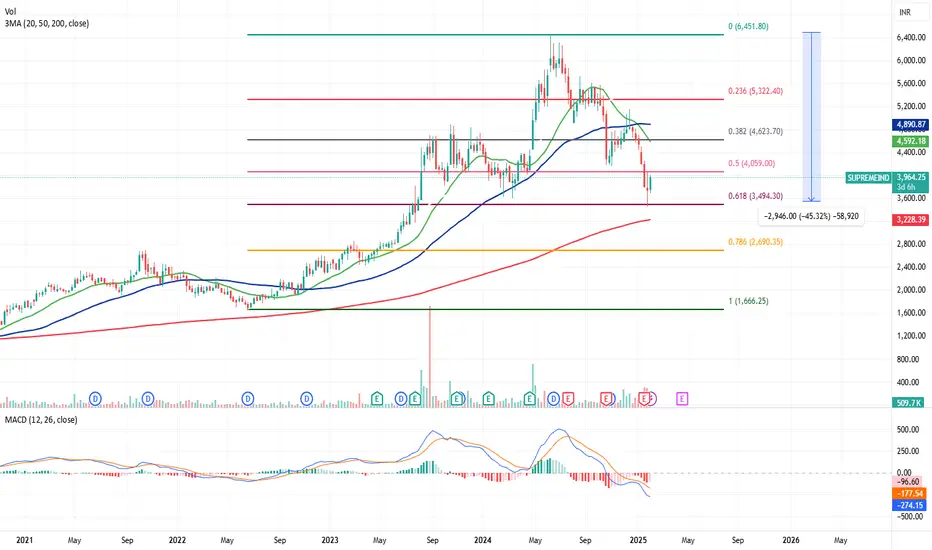
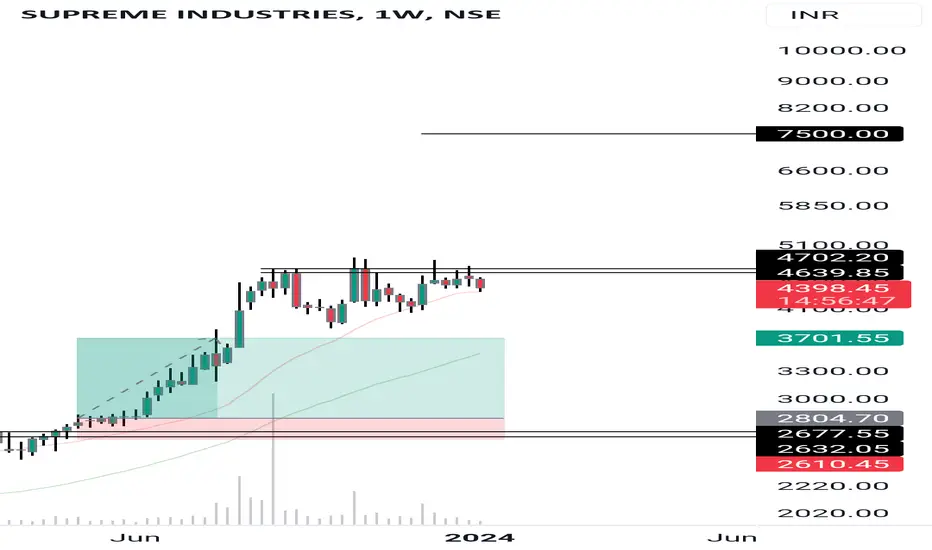
SUPREME INDUSTRIES: Key Support Zone – Accumulation or Relief ?📉 Stock Correction: Supreme Industries has seen a sharp decline of nearly 45% from its all-time high, bringing it down to a critical support zone.
📊 Technical Setup:
✅ 200-Week SMA Test: The stock is currently hovering around its 200-week simple moving average (SMA), considered strong support level.
✅ Fibonacci 0.618 Retracement: The price has corrected up to ₹3,494, aligning with the 0.618 Fibonacci retracement from its recent high of ₹6,451 – a key level where buyers often step in.
✅ MACD Analysis: Momentum indicators suggest oversold conditions, hinting at a potential relief rally or a trend reversal.
📌 Trading Perspective:
🔹 If the stock holds above the ₹3,494 - ₹3,228 zone, we might witness accumulation leading to a potential upmove.
🔹 A breakout above ₹4,059 (0.5 Fibonacci level) could signal further upside potential.
🔹 A failure to hold support might push the stock towards ₹2,690 (0.786 Fib level).
🎯 Levels to Watch:
🔸 Support: ₹3,494 | ₹3,228
🔸 Resistance: ₹4,059 | ₹4,623
📢 What's your view? Will this level hold, or do we see more downside? Share your thoughts in the comments! 🚀📈
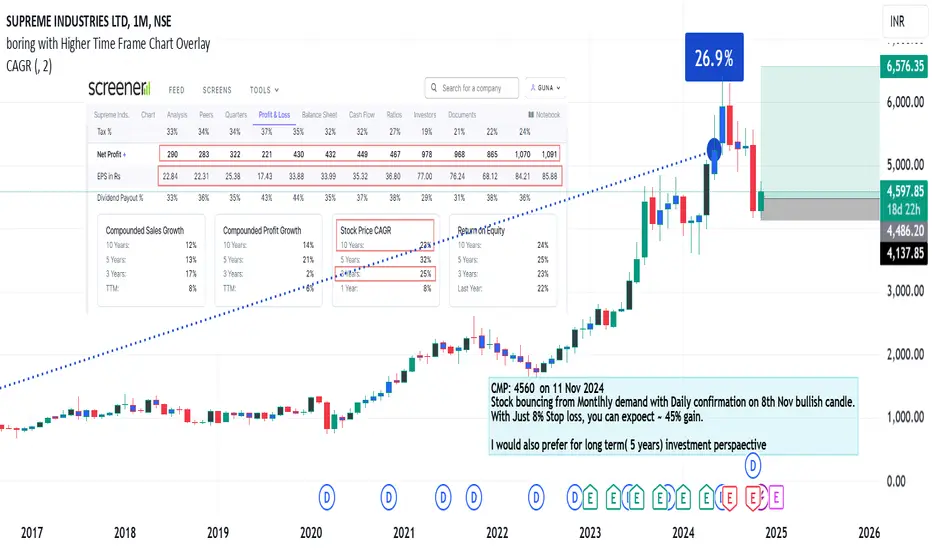
bouncing from Montlhly demand ,With Just 8% Stop lossCMP: 4560 on 11 Nov 2024
Stock bouncing from Montlhly demand with Daily confirmation on 8th Nov bullish candle.
With Just 8% Stop loss, you can expoect ~ 45% gain.
I would also prefer for long term( 5 years) investment perspaective
SUPREME S/R Support and Resistance Levels:
Support Levels: These are price points (green line/shade) where a downward trend may be halted due to a concentration of buying interest. Imagine them as a safety net where buyers step in, preventing further decline.
Resistance Levels: Conversely, resistance levels (red line/shade) are where upward trends might stall due to increased selling interest. They act like a ceiling where sellers come in to push prices down.
Breakouts:
Bullish Breakout: When the price moves above resistance, it often indicates strong buying interest and the potential for a continued uptrend. Traders may view this as a signal to buy or hold.
Bearish Breakout: When the price falls below support, it can signal strong selling interest and the potential for a continued downtrend. Traders might see this as a cue to sell or avoid buying.
20 EMA (Exponential Moving Average):
Above 20 EMA(50 EMA): If the stock price is above the 20 EMA, it suggests a potential uptrend or bullish momentum.
Below 20 EMA: If the stock price is below the 20 EMA, it indicates a potential downtrend or bearish momentum.
Trendline: A trendline is a straight line drawn on a chart to represent the general direction of a data point set.
Uptrend Line: Drawn by connecting the lows in an upward trend. Indicates that the price is moving higher over time. Acts as a support level, where prices tend to bounce upward.
Downtrend Line: Drawn by connecting the highs in a downward trend. Indicates that the price is moving lower over time. It acts as a resistance level, where prices tend to drop.
RSI: RSI readings greater than the 70 level are overbought territory, and RSI readings lower than the 30 level are considered oversold territory.
Combining RSI with Support and Resistance:
Support Level: This is a price level where a stock tends to find buying interest, preventing it from falling further. If RSI is showing an oversold condition (below 30) and the price is near or at a strong support level, it could be a good buy signal.
Resistance Level: This is a price level where a stock tends to find selling interest, preventing it from rising further. If RSI is showing an overbought condition (above 70) and the price is near or at a strong resistance level, it could be a signal to sell or short the asset.
Disclaimer:
I am not a SEBI registered. The information provided here is for learning purposes only and should not be interpreted as financial advice. Consider the broader market context and consult with a qualified financial advisor before making investment decisions.

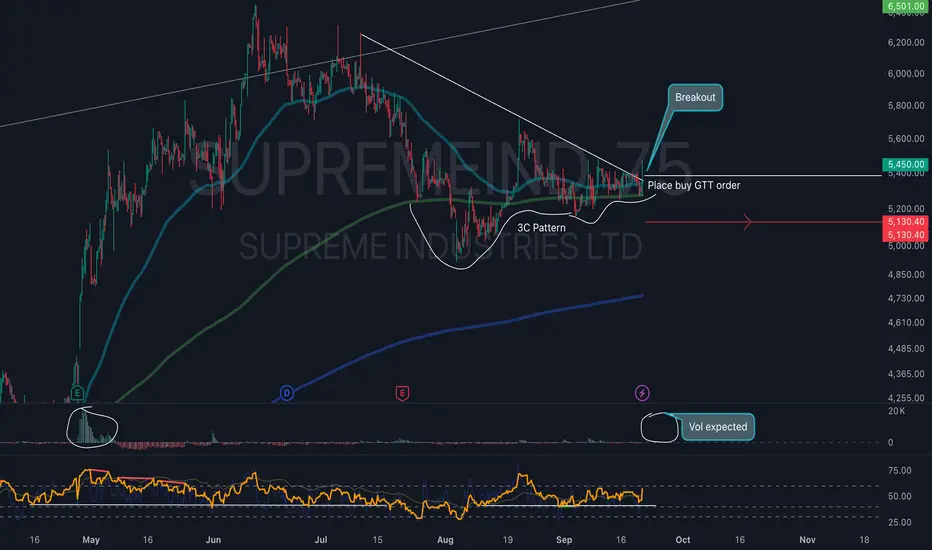
MV's 3C Pattern20 EMA>100EMA>200EMA>500EMA. price above 20 EMA and 50 % retracement from ATH. RSI is in bull range.Already given breakout. Good time to enter.
SUPREME INDUSTRIES TRADING IDEACup & Handle Breakout with good volume.
Stock can go as marked on the chart
Technicals
—Bullish Crossover
—Above 20 EMA
—Higher High breakout
—RSI 71
Fundamental
Stock P/E 44.2
ROCE 26.8%
ROE 21.0 %
Market Cap ₹38,226Cr.
educational purpose only!✨
Do your research before making any investment🥂

SUPREMEIND giving BOSupremeind is giving BO on a huge volume. Delivery volume is also good. R:R is not that favorable. Plastic stocks also reviving now. This can be a leader in the plastic industry. Keep a watch for a better entry.
200 Moving average support with elephant Bar200 Moving average support with elephant Bar with volume increase also

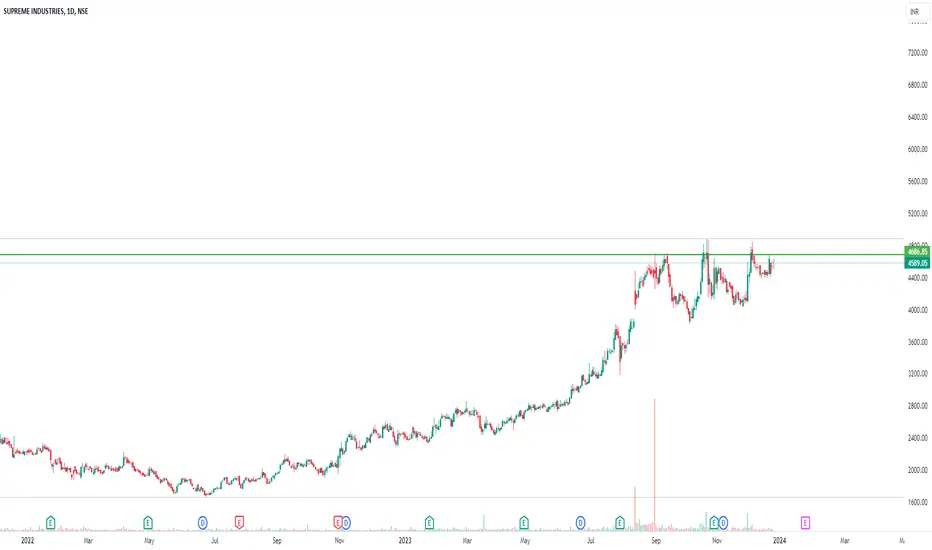
GREAT OPPORTUNITY 'SUPREME IND'Entry above 4700
Sl 4000
Target 7500
Continuation breakout buy
Moving average support
Supreme IndustriesBreakout Soon Candidate. Keep it on your radar. Will breakout very soon. A huge rally possible.
Cup with handle Bullish pattern having Cup with handle pattern in chart at life time High
May give opportunity to get high levels

Triangle Pattern breakoutPlease look into the chart for a detailed understanding.
Consider these for short-term & swing trades with 2% profit.
For BTST trades consider booking
target for 1% - 2%
For long-term trades look out for resistance drawn above closing.
Please consider these ideas for educational purpose
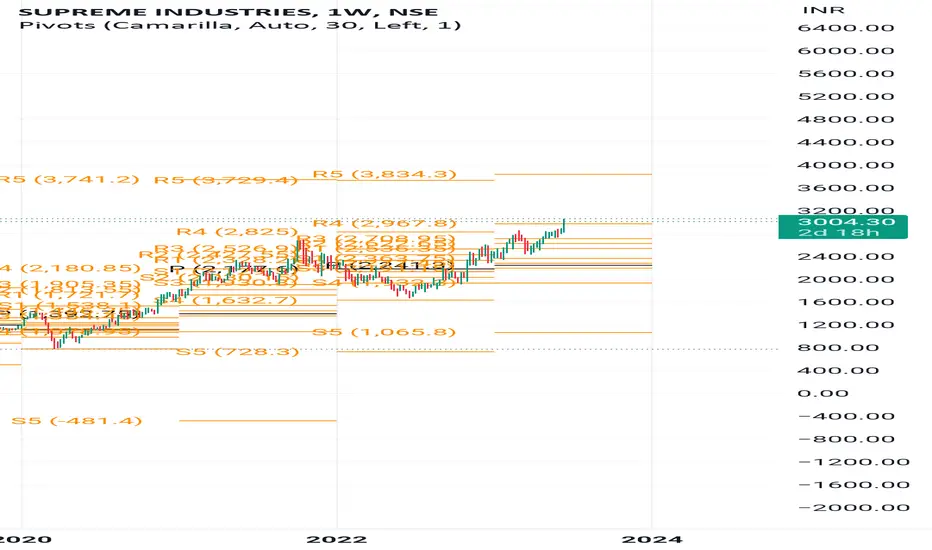
Supreme Industries-Nice breakoutSupreme Industries-Nice breakout.
Capital to be deployed- 20k
Price -2980-90
Stoploss-2708
Targets-3834
#Supreme #nifty50 #NiftyBank #investment #StockMarket #StocksToBuy
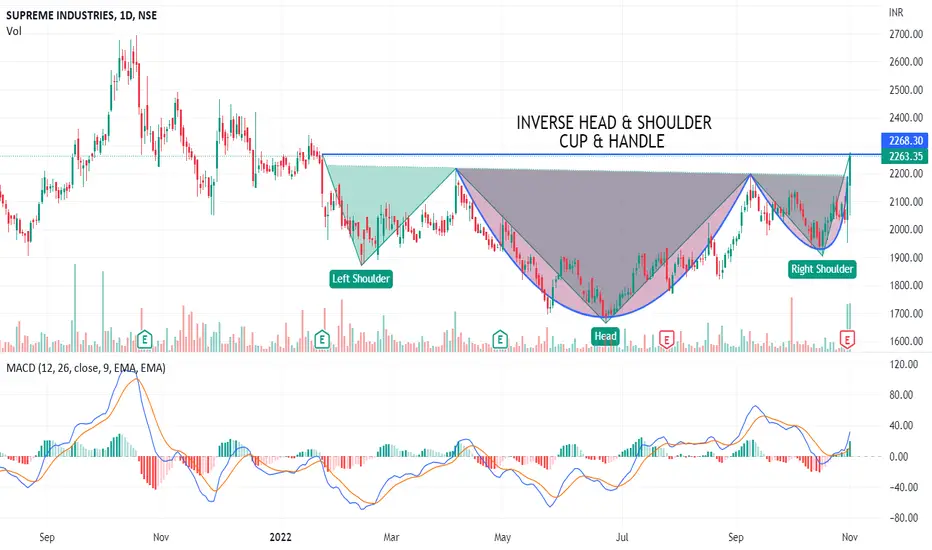
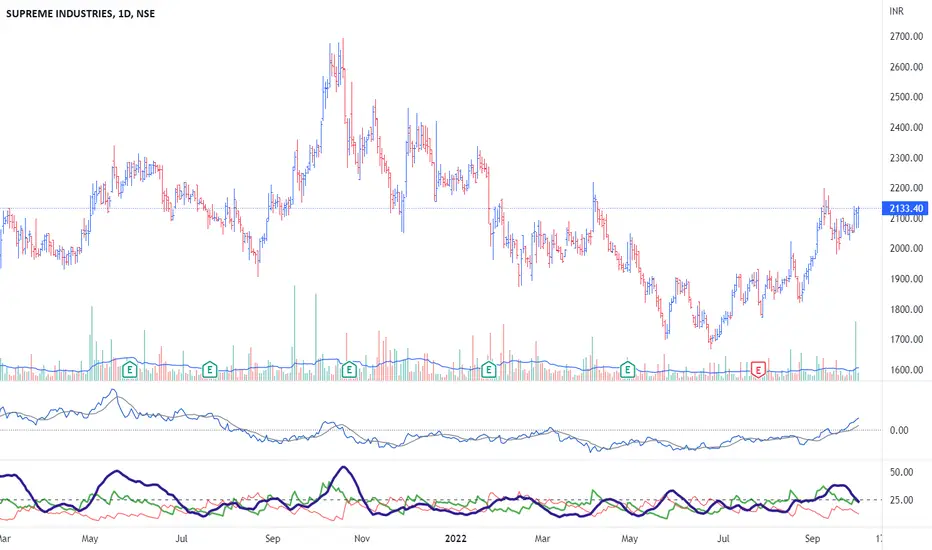
SUPREME INDUSTRIES LTD - Inverse Head & Shoulder + Cup & Handle 📊 Script: SUPREMEIND (SUPREME INDUSTRIES LIMITED)
📊 Nifty50 Stock: NO
📊 Sectoral Index: NIFTY 500 / NIFTY MIDCAP
📊 Sector: Industrials Capital Goods
📊 Industry: Plastic Products - Industrial
Key highlights: 💡⚡
📈 Script is trading at upper band of Bollinger Bands (BB) and giving breakout of it.
📈 MACD is giving crossover.
📈 Double Moving Averages also giving crossover.
📈 Volume is increasing along with price which is volume breakout.
📈 Script is giving breakout of Inverse Head & Shoulder + Cup & Handle + trendline.
📈 Current RSI is around 68.
📈 One can go for Swing Trade.
⏱️ C.M.P 📑💰- 2263
🟢 Target 🎯🏆 - 2474
⚠️ Stoploss ☠️🚫 - 2131
⚠️ Important: Always maintain your Risk & Reward Ratio.
⚠️ Purely technical based pick.
✅Like and follow to never miss a new idea!✅
Disclaimer: I am not SEBI Registered Advisor. My posts are purely for training and educational purposes.
Eat🍜 Sleep😴 TradingView📈 Repeat🔁
Happy learning with trading. Cheers!🥂
SUPREME INDUSRIES HAVE GIVING BREAKOUT head and shoulder pattern i have mark level on chart be ready for it follow the level
Supreme Industries Falling Wedge Pattern Breakout*Supreme Industries*
Time Frame: Daily
Observation:
* Falling Wedge Pattern Breakout
* Mean (EMA) Diversion
Resistance/Target: 2345 2899 2860 3015
Support: 1969 1830; Dynamic Support at 200EMA

SUPREME INDUSTIRES LOOKS BULLISH
=Took Support From trendline
=Head and Shoulder pattern breakout (H&S)with high volume
=Price consolidated at 200 EMA before neckline of H&S pattern
=monthly close above resistance
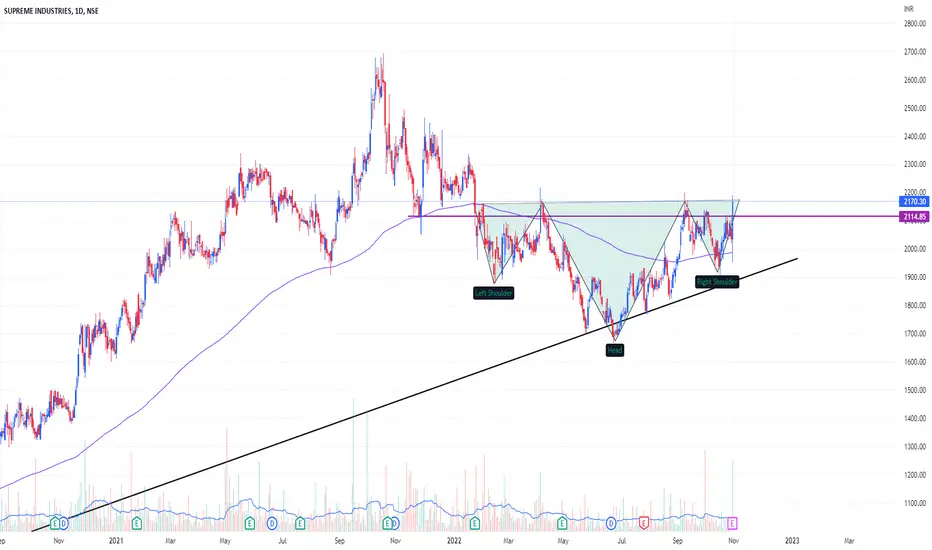
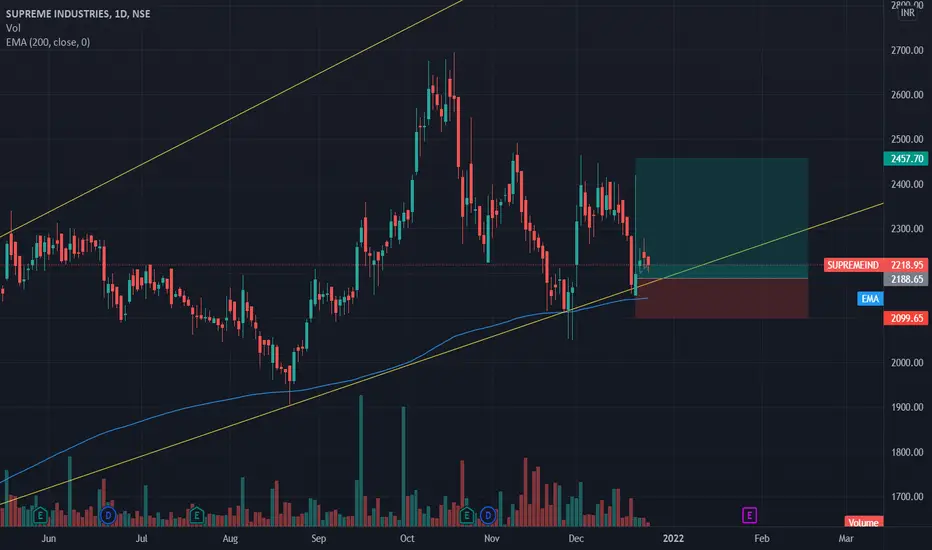
Supreme Industries - Positional long ideaInverse head and shoulder pattern, Bullish RSI divergence. Levels are mentioned on chart.
Buy at CMP and add more on dips, Target 2100, SL 1820.
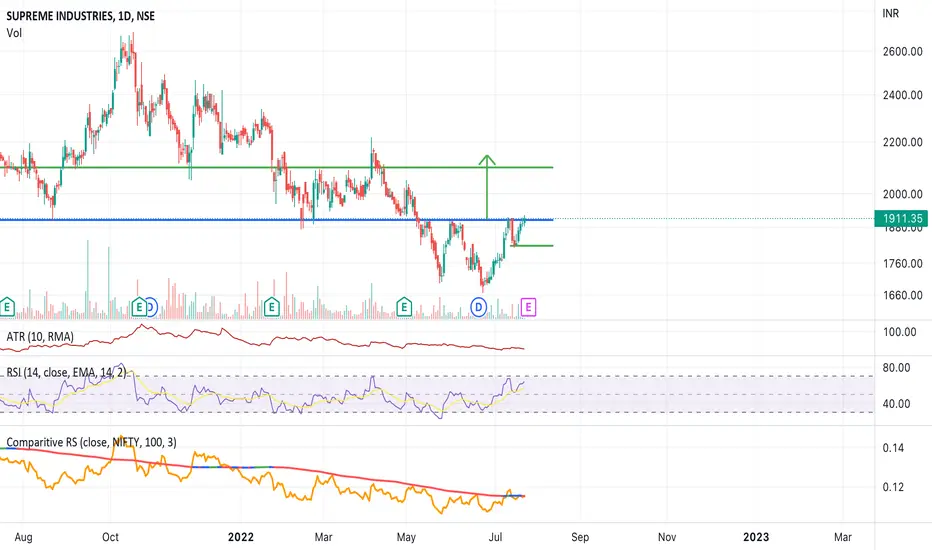
Supreme Industries Reversal TradeThe stock has reached lower trendline and may undergo a reversal rally. Trade is supported by brokerage calls and Supports Nearby.
Risk Reward Ratio - 3:1
SL is placed below support zone, 200 EMA & the lower trendline. The target is placed near resistance.