TATAMOTORS trade ideas

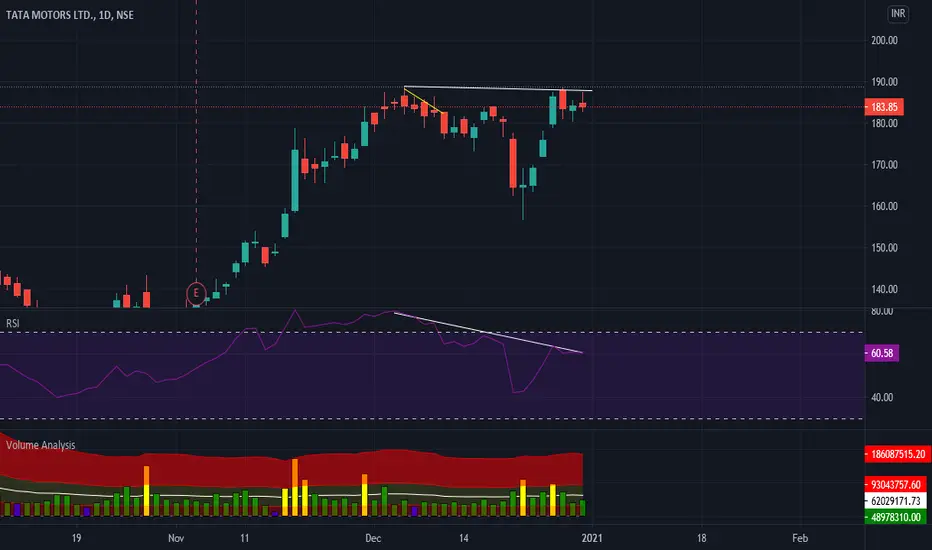
divergence and price action strategySee all my Publications if it seems to give you both knowledge and profit then only like subscribe and share to your near and dear.
thanks for my masters trading panthulu, day trader telugu, and nayan pokarkar.
These are all for educational purpose please consult your financial advisor before investing your hard earned money.

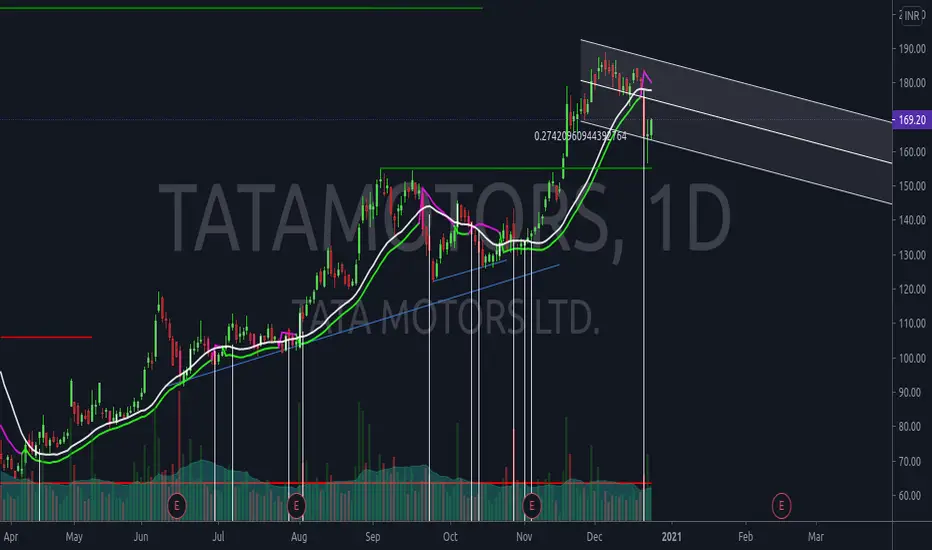
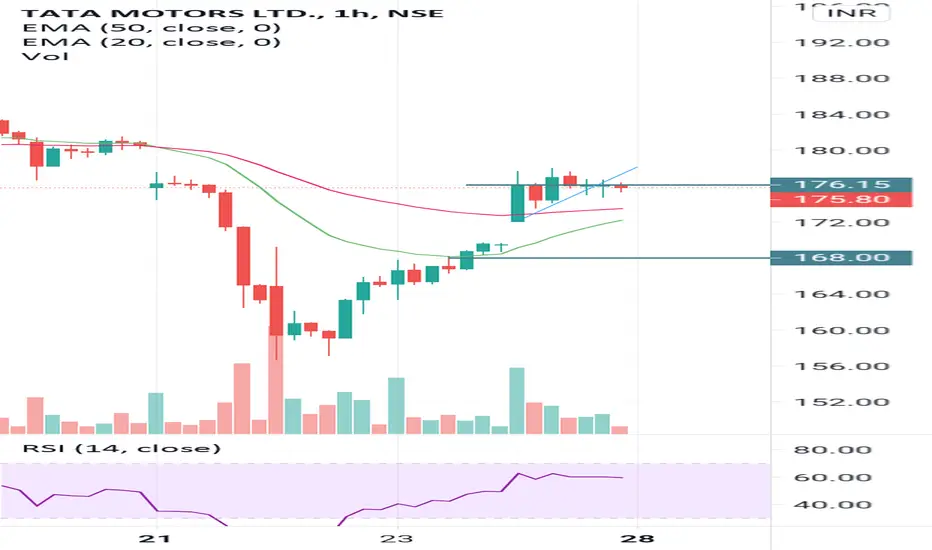
short term tradetata motors lenier regression channel shows a clear downtrend. however, due to market correction the stock has touched lower band of the channel.
expecting a rise till 175 levels only post which all positions need to be squared off. fresh longs can be initiated only after pprice crosses the upper band.
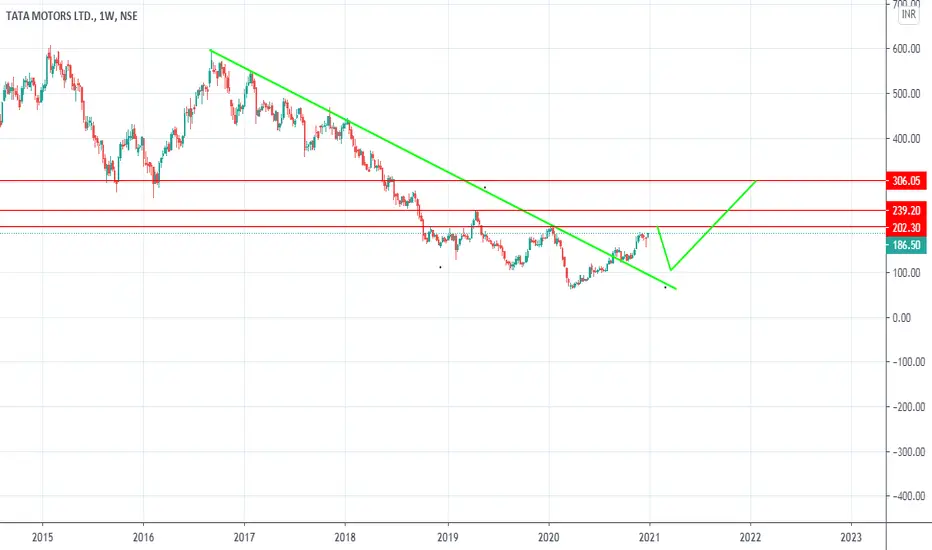
TATA MOTORS - Travelling in ChannelsAfter it broke the downward channel , it took support at the downward channel border and is now travelling in an upward channel.
May face some resistances upto 202.

Tata motors going to longWait moving averages cross over & next correction resolution, then make a position for long short term purpose
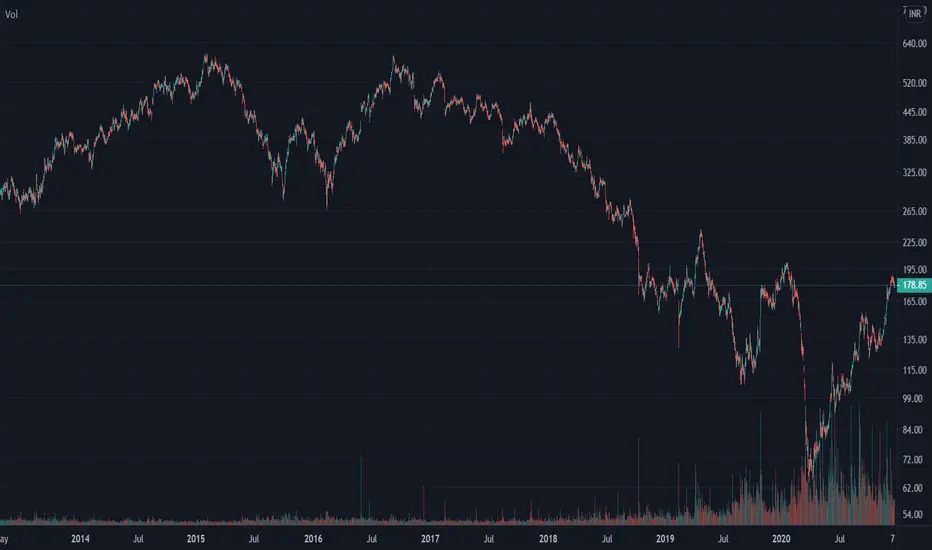
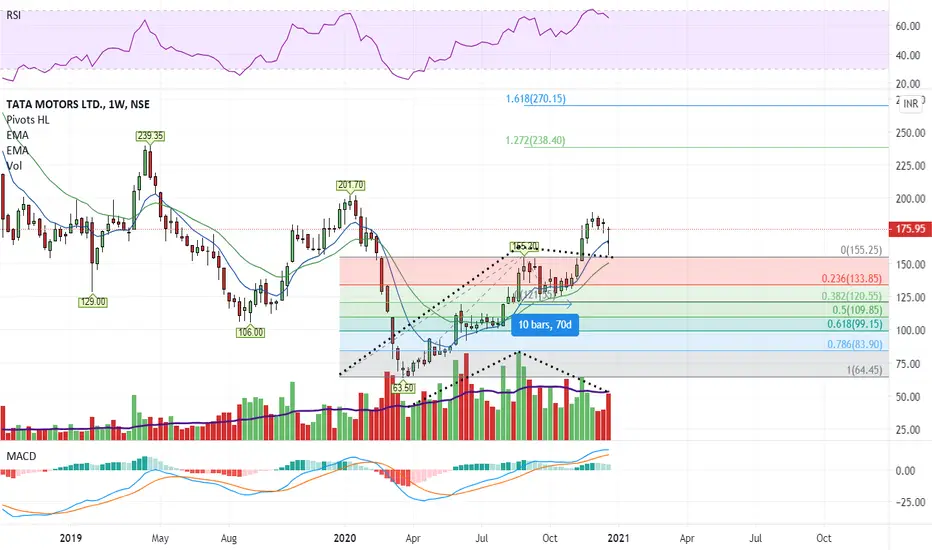
ELLOIT WAVE - TATAMOTORS WEEKLY CHART ELLOIT WAVE - TATAMOTORS WEEKLY
As seen on the chart I have drawn from the low of March .
I feel we are on wave 3 cause from 24th August till 2nd of November it was sideways indicating wave 2.
You could ask why not the previous sideways movement from 1st of June till 3rd of August as wave 2 , because it on retraced on 1 candle in the weekly time frame.
Further more volume is also decreasing. Therefore I feel we are on wave 3 for a target of 270.15 as 1.618
I would appreciate your feedback on my analysis of this
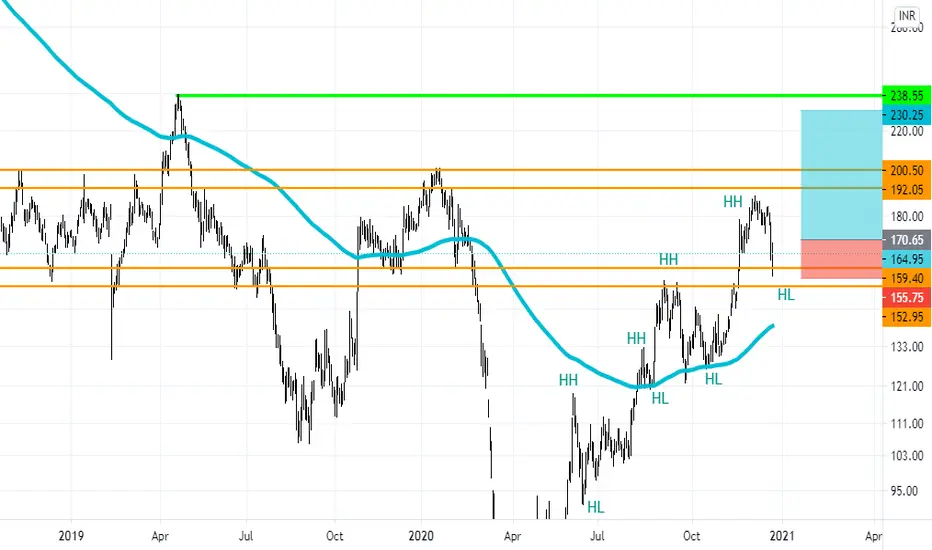
LONG OPPORTUNITY IN TATA MOTORSREASONS-
1) WEEKLY & DAILY TREND IS UP.
2) MAKING HIGHER HIGHS & HIGHER LOWS ON DAILY.
3) TRADING ABOVE THE ICHIMOKU CLOUD ON THE WEEKLY AS WELL AS ON THE DAILY.
4) PULLBACK/DIP RETESTED ON HISTORIC KEY LEVEL ACTING AS SUPPORT THIS TIME.
5) SOME NOOBS MIGHT THINK THAT STOCK GONNA CRASH AND WE CAN BENEFIT FROM THEIR SHORT COVERING.
PARTIAL PROFITS MUST BE BOOKED AS THE TRADE GOES IN THE FAVOURABLE DIRECTION.
KINDLY TRADE AT YOUR OWN RISK.
GOOD LUCK ^^
TATAMOTORS - SHORTCNXAUTO remains heavy and within that TATA Motors printing the medium term cycle peak around the 180-190 area. Now ideally if we assume NIFTY capped 13780; AUTO would participate in the downside momentum. Short with stop 181 (one can add any rallies). First take profit is 165 and then 157 (out side chance of 148).

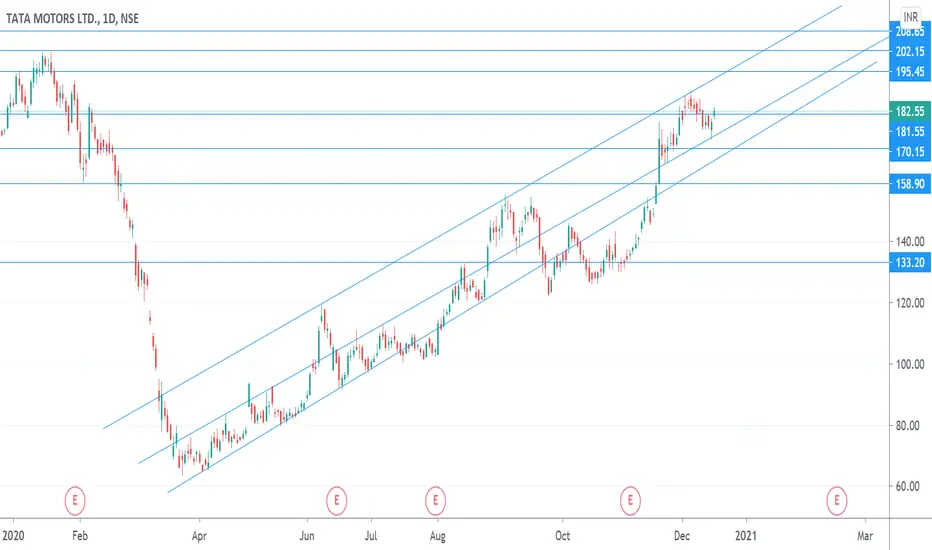
Tata Motors - Bullish interms of the patternTata Motors is following a good pattern as you can see from the charts(Pattern from the march lows) and it is good to go for the long term.
The support and resistance with a long term and short term view are shown in the chart. It is bullish until and unless it breaks the major supports-170 and then 158 until then it is good to accumulate. The first major resistance or the target is at 195.45.
Disclaimer: Please check with your analysis before investment- It is for educational purpose only and solely based on my view.
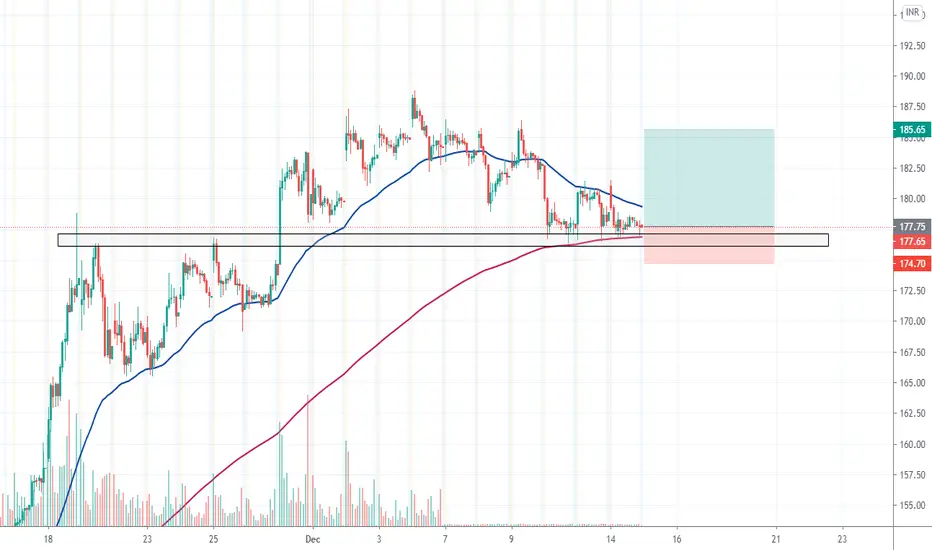
Tata Motors standing over a support zonesThe previous resistance of 176 price zone on Tata Motors charts will act as a support and 200EMA is also lying on the same level. A good positional buy trade entry can be made at the CMP with a low risk against a good rewards. ( RR ratio of 2.5)
(Note:- This is my personal views. Please consult with your financial advisor before taking trade.)
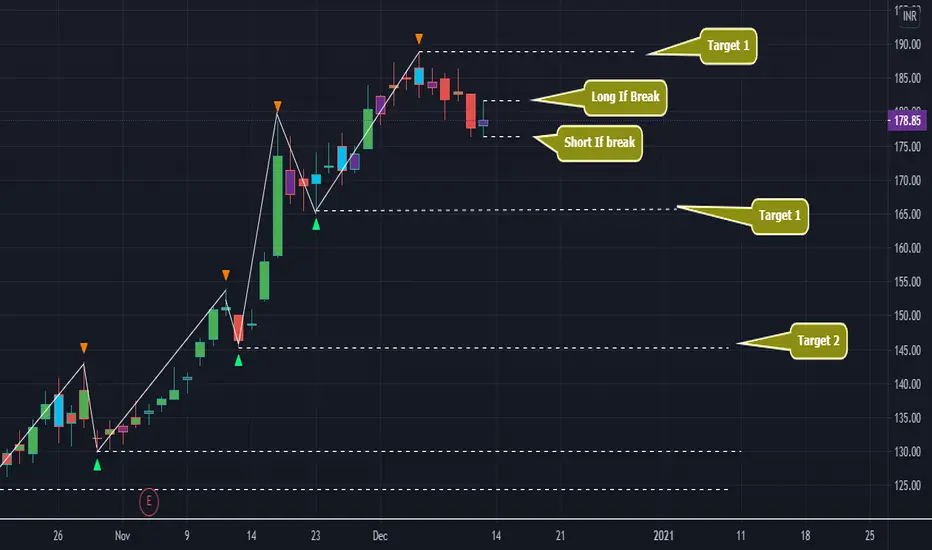
Tata Motor { D Frame Positional }Stock in uptrend in D Frame forming new higher Low's . Also it formed IB on Friday. We can both Long And Short ( Also take intraday, by proper
Entry in 15 m tf ). Rest is as per given in charts
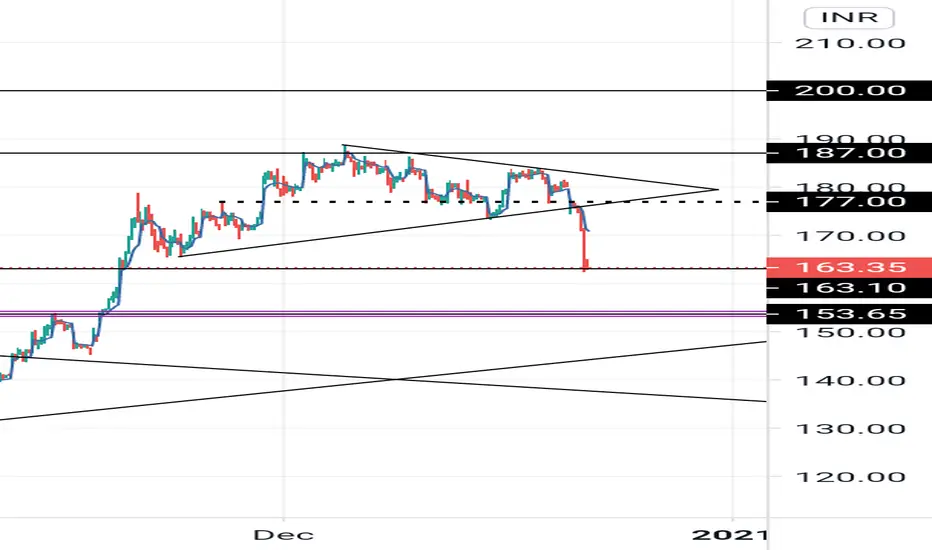
Taat motors @ supportTata motors is forming a base @177. As per fibbonacci levels it is at 50% level of support. After a week of downtrend it may consolidate and move up further.
Just a logical study No buy or sell signal💯