TCS HARMONIC LEVELS FOR POSITIONAL TRADINGTCS is currently in a correction mode, and it is likely that we may see further weakness in the stock, and stock could move lower to 3400 to 3200 levels in the near term.
This is a great stock for Investment and for positional trading also.
I can see butterfly pattern formation on its daily chart, which is suggesting a good support area around 3400 -3367 levels and at 3180-3208
Stock can be bought in tranches as both of these levels can be seen in the stocks.
Disclaimer: Not a recommendation to trade.
TCS trade ideas

TCS 1DTCS currently at the bottom of a crucial zone. It can give a good move either side.
If it breaks down expected target can be around 3100.
If reverses from this zone one can expect a target of 4050+
Trade safe. Manage risk. Be profitable.
Please follow us for more simple trading analysis and setups. Also let me know in the comment in case you have any queries.
Disclaimer :- This is just my view. Please analyze charts yourself and then decide to take any trades.

TCS a good buy near 3715Buy TCS near 3715 and now at 3735. Wait for it to retrace so that you can buy at the advised level. Hold for a min target of Rs.100

TCS: Hide or Ride !!Folks!!
Looks like we are about to complete the third Elliott wave in this chart.
I see strong newsflow overpowering traders.
So TCS can retest all time high again which could support Nifty.
All the Best!!


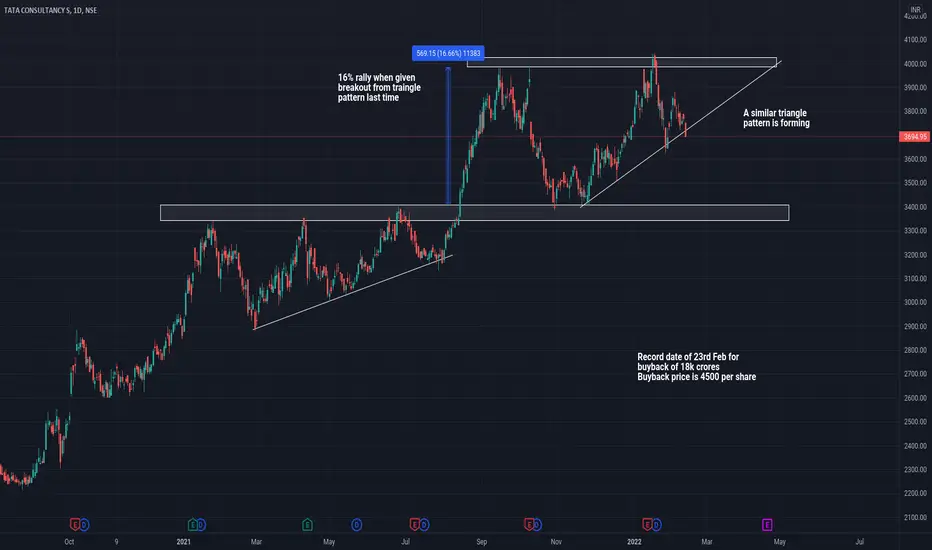
TCS buyback strategyForming a triangle pattern.... looking like it is ready to give a blast with buyback as the trigger.... Can apply for buyback when it comes and sell remaining at market price.... break even point of buyback should be around 3.2k assuming 60% acceptance rate.... 3.3k is a very good support region, so no need to worry about loss at all
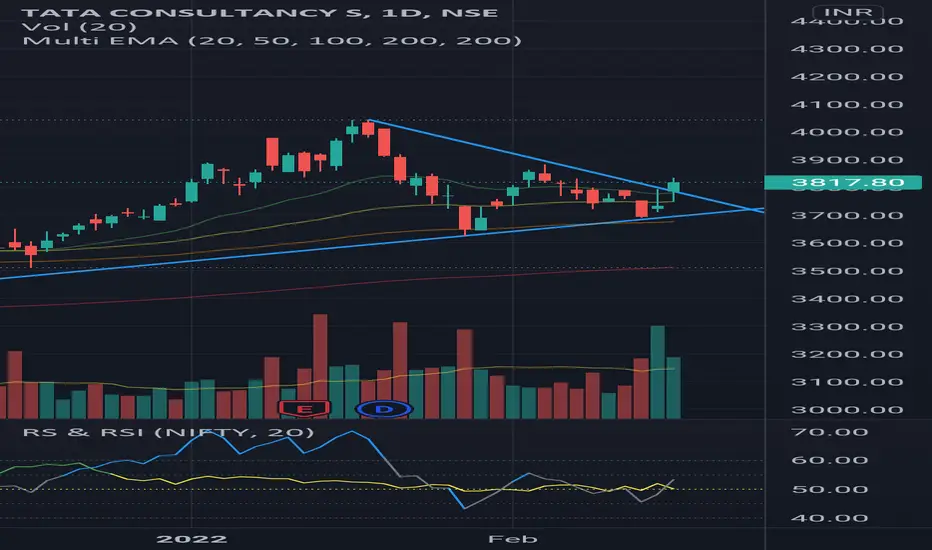
TCS Triangle formationPossible triangle breakout, the direction is not clear as of now also there is a consolidations of moving averages . Putting an alert on both the trendlines.

TCS is in a Important Breakout Point, Buy/Sell after BreakoutTCS Intraday Strategy for 10/02/2022
TCS is in a Important Breakout Point, Buy/Sell after Breakout

TCS LongTCS has been a fundamentally good stock which ultimately is good to hold for a long time. However, The recent budget has also been focused on IT which is an added advantage for IT Sector.
At present, the chart shows Cup and handle pattern which will fetch 10% and above on breakout. I'm holding TCS for quite a while now and looking forward to investing more.

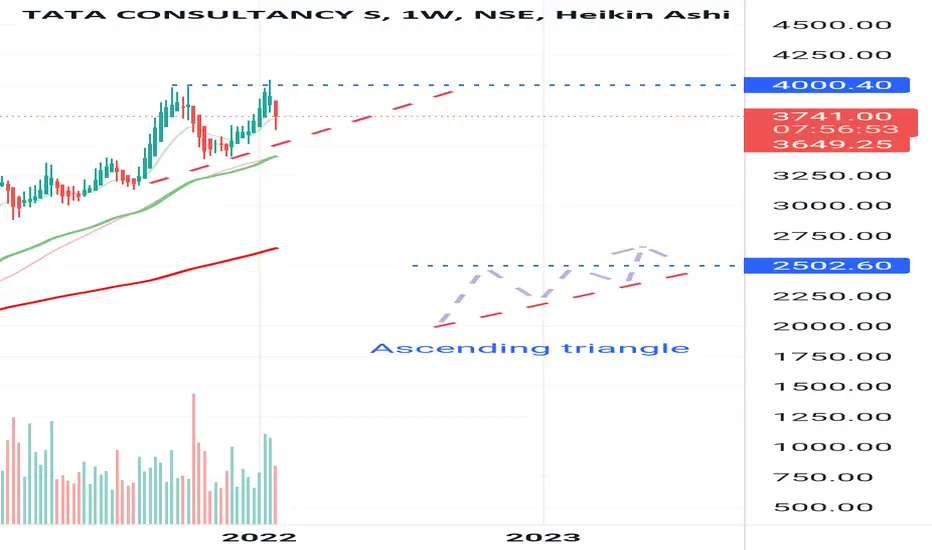
Tcs inrTcs forms asending triangle in weekly time frame soon expect good bounce.
Moving average also shows good sign.
TCS AnalysisSymmetric Triangle Pattern
Resistance Zone: 3720-3730
Upside Targets: 3764-3774, 3800-3805, 3837-3845
Support Zone: 3675-3685
Downside Targets: 3645-3650,3620-3630

TCS Share Intraday (28/1/22)Hello Guys,
I am Nilay Chopda, I am not a SEBI resigtered person. I GIve Call for Educational Purpose Only..
In this Chart There is a Proper Selling Pressure is there..Which means More Downfall will come
One Can Take A TRADE in this as per my Chart.
If TCS Opens Down then One can Short Sell the Share
Strictly Follow STOPLOSS and TARGET.
!!Don't Follow Me Blindly!! Do your Own Research too🤙🤙
SELL CALL
⭐TCS⭐
@CMP (if market opens Down)
SL:- 3688
TARGET 1:- 3569
TARGET 2:- 3525
❤Intraday Call (28/1/22)❤

TCSTCS - Seems very positive
RSI: Over Bought Zone - 73 - Hence we might see a slight correction
Target of 4095 Levels
Support levels : 3989 & 3981
Like & Follow
Happy Trading :)

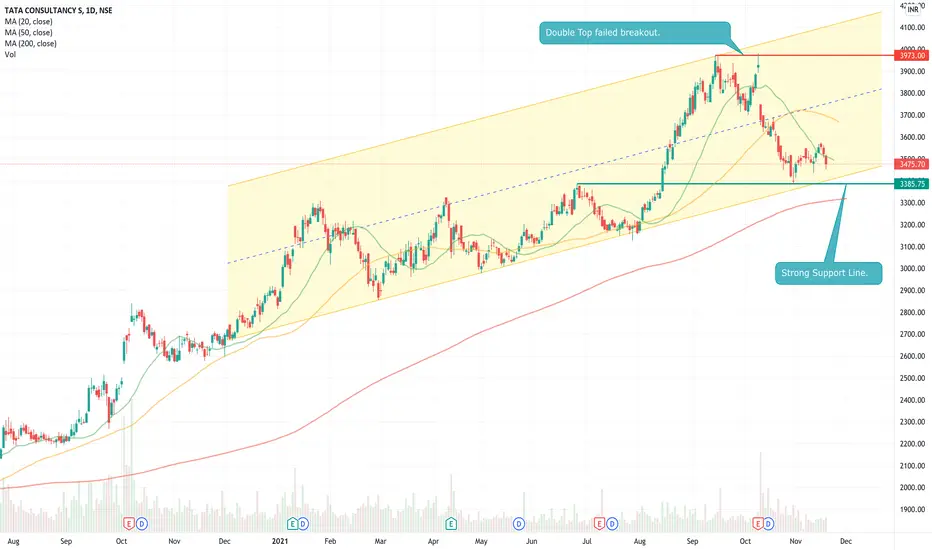
TCS Buy -Long Term Bullish Channel, at key support levels nowTCS has been in long term bullish channel for few years now and has been moving within the parallel channel for a while. Right now it's consolidating at the lower end of the channel and might test key support levels at the lower channel trend line and 3385 levels. Long term investors can start accumulating at these levels even if there's a slight risk of pull back. TCS will hit the all time high above 4000 by Jan 2022 with stronger quarterly results.
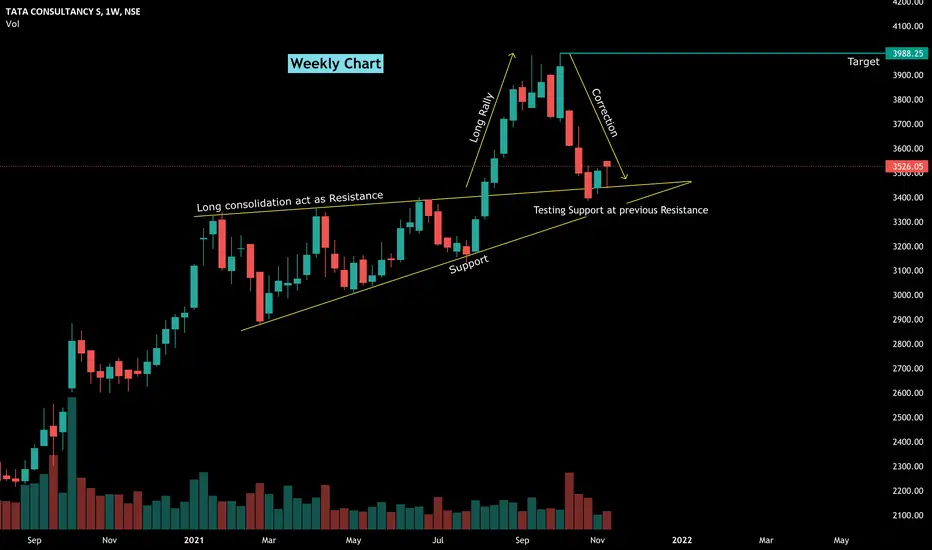
Retest Support at previous Resistance done ?Retesting the level at previous resistance.
We can see rally to new high, if reaches the previous high levels.
TCS intraday long tradeAn obvious flag and pole pattern in TCS on 15 mint time frame.
On breakout it can give a minimum target of 4050
Buy onlu after a breakout and carry the position if it closes above 4053 on daily basis.

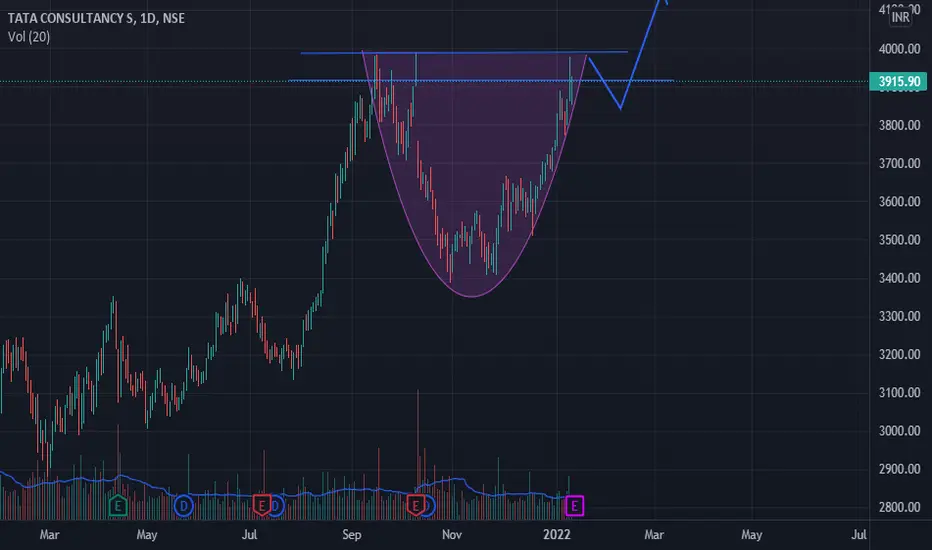
Rounding bottom on daily time frame, Target 4500 next 6 month...Excellent rounding bottom form on daily time frame, Target 4500 in next 6 month
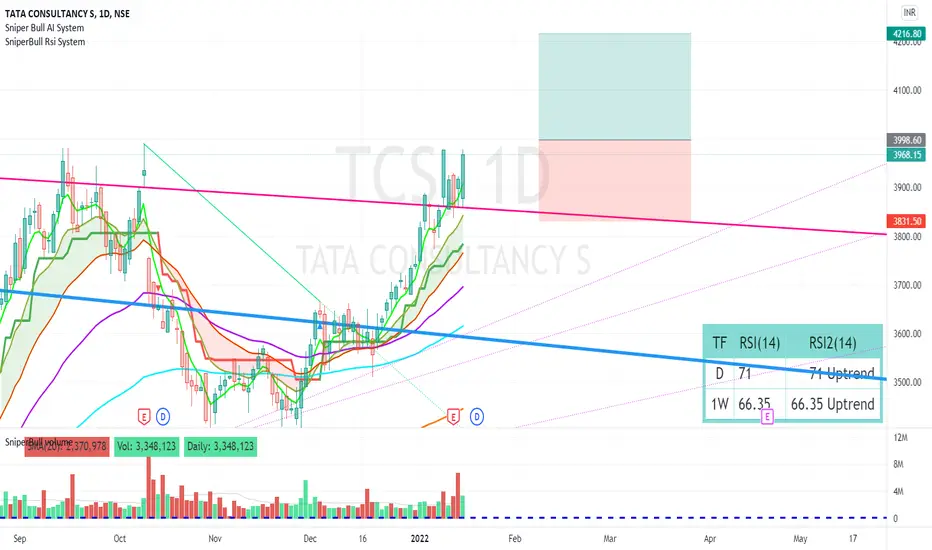
TCS New Record high Possibilty- 4216TCS - now tcs price is 3998 so if break 4000 level so new high possibility in tcs -4216.
TCS Rounding Bottom in TCS
Good rally in TCS as per our Prediction
Now either Breakout or Breakdown
Breakout above 3990 if sustained
Lots of positive new about the Stock
Stock is in Good Uptrend
But we will play as per the charts
If Breakout Buy - May Rise
If Breakdown Sell - May Fall (Don't negate the fall side)
If Breakout Fails be ready for a Quick downside selling profit
Buy above 3990
TGT 4500
SL 3915
Sell below 3930
TGT 3800 - 3725
SL 3995
Please do correlate by yourself also on charts. This is for paper trading and educational purpose only. Must consult your Financial advisor before investing.

TCS IndiaSun Storm Investment Trading Desk & NexGen Wealth Management Service Present's: SSITD & NexGen Portfolio of the Week Series
Focus: Worldwide
By Sun Storm Investment Research & NexGen Wealth Management Service
A Profit & Solutions Strategy & Research
Trading | Investment | Stocks | ETF | Mutual Funds | Crypto | Bonds | Options | Dividend | Futures |
USA | Canada | UK | Germany | France | Italy | Rest of Europe | Mexico | India
Disclaimer: Sun Storm Investment and NexGen are not registered financial advisors, so please do your own research before trading & investing anything. This is information is for only research purposes not for actual trading & investing decision.
#debadipb #profitsolutions
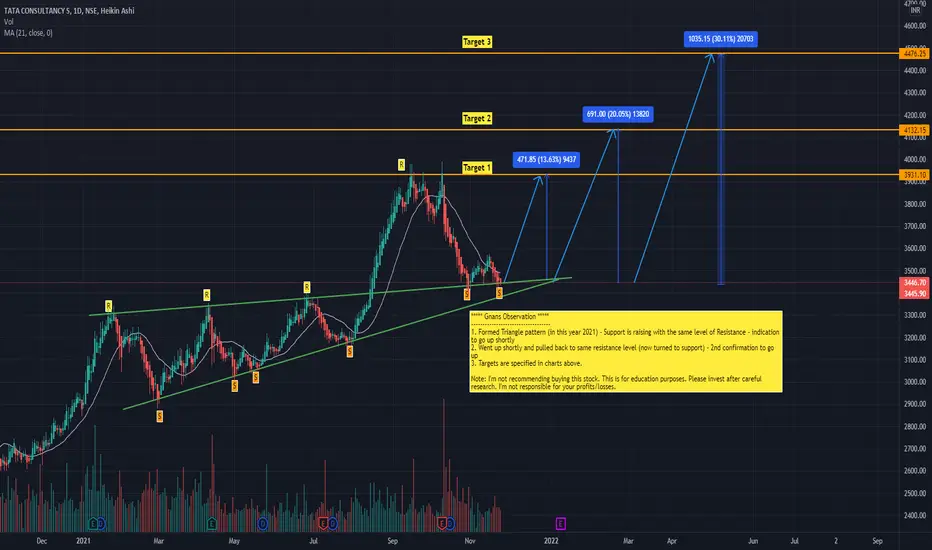
TCS - Pullback completed - Ready to Go upObservations:
1. Formed Triangle pattern (in this year 2021) - Support is raising with the same level of Resistance - indication to go up shortly
2. Went up shortly and pulled back to same resistance level (now turned to support) - 2nd confirmation to go up
3. Targets are specified in the charts above.
Note:
I'm not recommending buying this stock. This is for education purposes.
Please invest after careful research. I'm not responsible for your profits/losses.
- Gnanasekaran
Trade Cup and Handle PatternsRecognizing Cup and Handle Patterns
When evaluating whether a cup and handle pattern is real, it is important to look at the shapes of both the cup and the handle.
The cup should be more U-shaped than V-shaped, as a gentle pullback from the high is more indicative of consolidation than a sharp reversal. The U-shape also demonstrates that there is strong support at the base of the cup and the cup depth should retrace less than 1/3 of the advance prior to the consolidation pullback. However, cup depths between 1/3 to ½ the level of the prior advance are possible in volatile markets, and even cup depths retracing 2/3 of the prior advance are possible in extreme setups. The cup can develop over a period of one to six months on daily charts, or even longer on weekly charts. Ideally, the highs on the left and right side of the cup are at roughly the same price level, corresponding to a single resistance level.