A Step-by-step Guide to One of the Chart Analysis MethodHello Friends,
Welcome to RK_Chaarts,
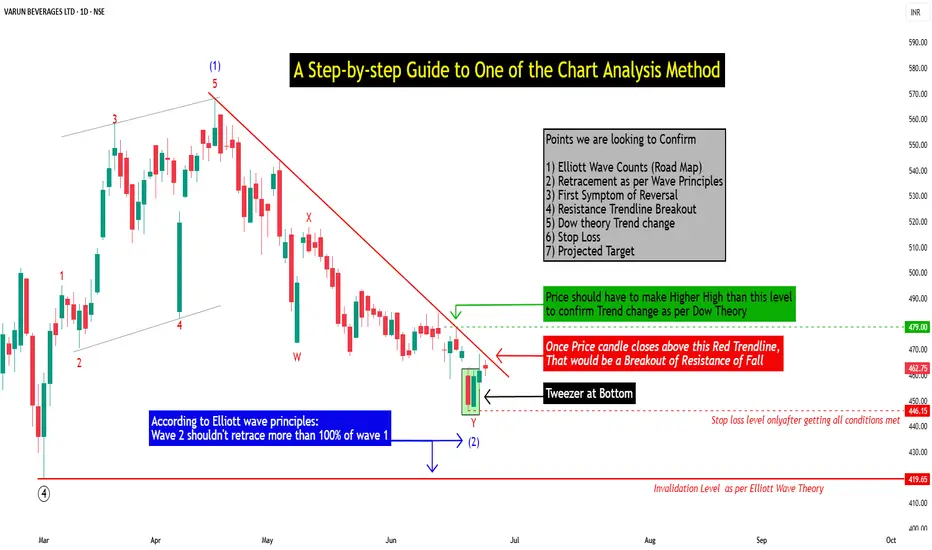
Today we're going to learn step-by-step guide to one of the chart analysis Method by analyzing a chart of " Varun Beverages Ltd. (VBL) " to identify a trend change opportunity.(Educational Post).
Let's get started!
Applying Elliott Wave Theory
First, we can see that the bottom formed in March 2025 is likely a Wave ((4)) in Black as a bottom, marked as such on the chart. From there, Wave 5 should move upwards. Looking at the daily timeframe, we can see that price gone up in five sub-divisions of Wave (1) in Blue of Wave ((5)) in Black have completed, marked as Red 1-2-3-4-5, that means blue intermediate Wave (1) has ended, and Wave (2) has begun, which is unfolded in corrective nature marked as WXY in Red of Wave (2) in Blue.
According to the wave principle, Wave (2) should not retrace more than 100% of Wave (1), which started from the 419.65 bottom. Therefore, 419.65 becomes our invalidation level. If the price moves below this level, it would invalidate our Wave (2) principle.
Assuming our wave counts are correct, the upward movement is in the five sub-divisions, and the downward movement is in the three sub-divisions. Definitely, the conviction is increasing that we have correctly identified Waves (1) and (2). Shown in chart image below
Tweezers at Bottom
Now, we can see that Wave 2 has retraced more than 70% and has formed a Tweezer candlestick pattern at the bottom. A bearish candle was followed by a bullish candle, both with a Tweezer-like shape, with the second candle being green. This could indicate a potential reversal. Moreover, the latest candle has also taken out the high of the previous two candles, showing follow-through. The price has also shown follow-through on the upside after that. So, this can be considered as the first sign that Wave 2 might be ending, marked by a significant Tweezer pattern at the bottom with a follow-through candle. Shown in chart image below
Significant Breakout Pending Yet
Secondly, from the top where Wave 1 ended, we've been considering the decline from around 560.50 as a resistance. We drew a resistance trend line, and if the price breaks out above it, we can say that the resistance trend line has been broken, indicating a breakout above the last fall's trend line, Which is not Broken yet. Shown in chart image below
Dow Theory
The Dow Theory states that when the price moves up, it forms a Higher High, Higher Low pattern, and when it moves down, it forms a Lower High, Lower Low pattern. Somehow, the Dow Theory also needs to change, as the last swing was forming a Lower High, Lower Low pattern. The last swing high was at 479, which we marked with a green arrow. If the price crosses above it, we can say that the price is now forming a Higher High pattern. This indicates that the Dow Theory is changing from a falling trend to a rising trend. Shown in chart image below
Stop Loss
Once the Dow Theory also changes, we can use the last swing low at 446.15 as our stop loss. However, this stop loss will only be valid after the Dow Theory changes; otherwise, the invalidation level will remain at 419. Shown in chart image below
Projected Target of Wave (3)
So, friends, we've applied the Elliott Wave principle, and there's been a significant retracement, all within the valid range, without violating any rules or triggering invalidation. There's limited room left on the downside, and then we have the Tweezer candlestick pattern, which is a significant sign. We're expecting a reversal from there, and the price has followed up with an upward move.
What's left now is the breakout above the resistance trend line and a change in the Dow Theory. Once these two conditions are confirmed, all parameters will match, and we can add a position to our portfolio using the last swing low as our stop loss, instead of the invalidation level.
This is how chart analysis is done for investment purposes. We've seen many signs in our favor, and yet we still use a stop loss to prevent significant losses in case the stock or market moves unexpectedly. This is what stop loss is all about - minimizing potential losses.
We've also discussed the target projection based on Wave theory, 161.8% level, which we explained through an image. So, friends, I hope you've understood the entire conclusion and learned how to analyze charts using different methods, one of which we shared with you today.
I am not Sebi registered analyst.
My studies are for educational purpose only.
Please Consult your financial advisor before trading or investing.
I am not responsible for any kinds of your profits and your losses.
Most investors treat trading as a hobby because they have a full-time job doing something else.
However, If you treat trading like a business, it will pay you like a business.
If you treat like a hobby, hobbies don't pay, they cost you...!
Hope this post is helpful to community
Thanks
RK💕
Disclaimer and Risk Warning.
The analysis and discussion provided on in.tradingview.com is intended for educational purposes only and should not be relied upon for trading decisions. RK_Chaarts is not an investment adviser and the information provided here should not be taken as professional investment advice. Before buying or selling any investments, securities, or precious metals, it is recommended that you conduct your own due diligence. RK_Chaarts does not share in your profits and will not take responsibility for any losses you may incur. So Please Consult your financial advisor before trading or investing.
VBL trade ideas

Levels to watch out We've seen this cycle play out repeatedly—FOMO, driving retail investors to pile into rallies, only for many to get trapped as markets turn. It's the same story: retailers get caught in the hype, while brokers rake in commissions. Unfortunately, it's the retail investors who often pay the price.
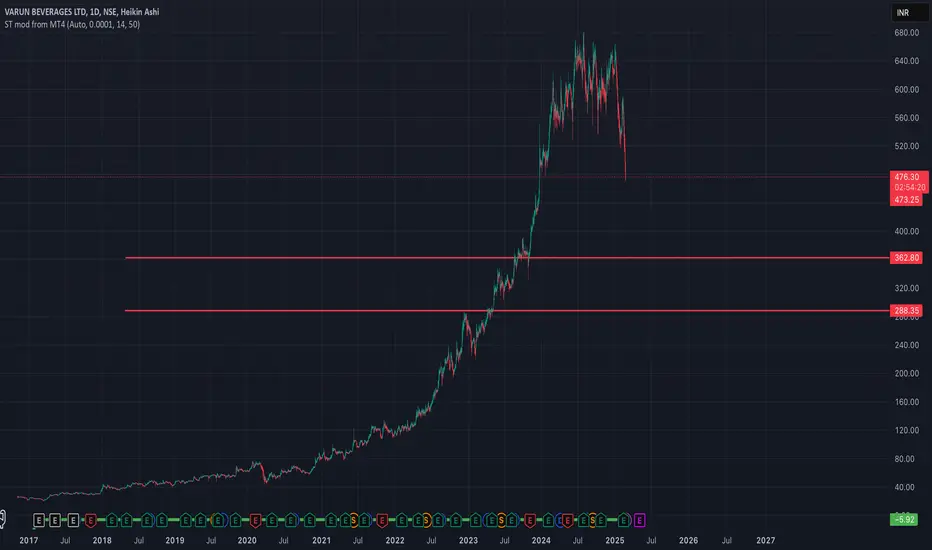
Right now, the market is in a correction phase, and we can expect volatility with choppy or downward movements in the coming months. This could present a good opportunity for long-term investors to buy the dip.
Personally, I’ll be eyeing potential buying opportunities around the 360 and 280 price levels. In the long-term, I believe these levels could set up for strong gains as the market eventually recovers and reaches new highs. Patience is key—don’t get swept up in the short-term noise.

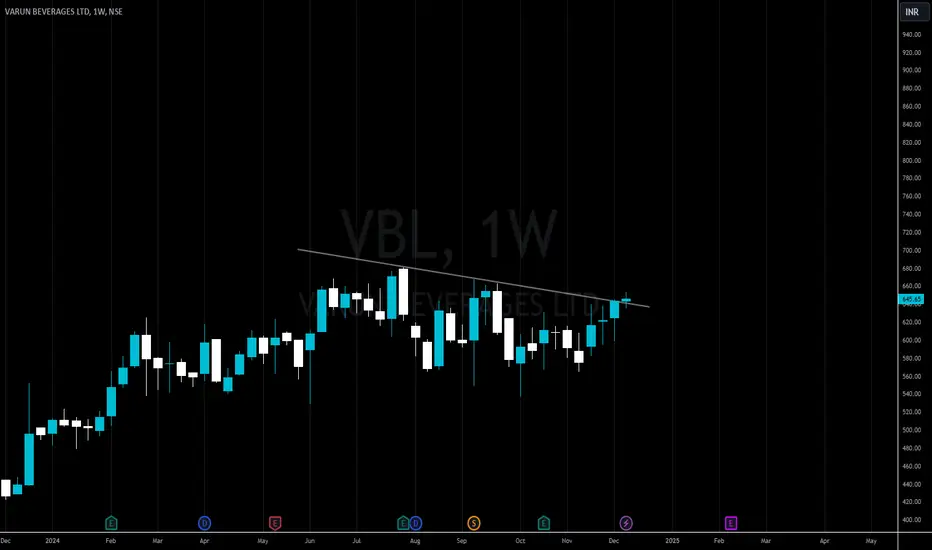
VBL - SHORTNSE:VBL Weekly short setup with distribution to decline phase. Momentum also going to down ward.

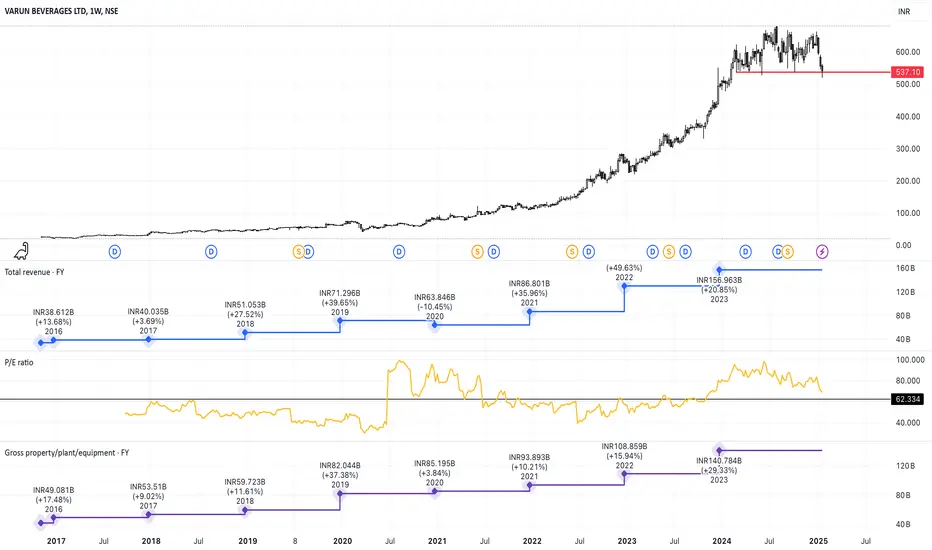
Crucial support Area Trading near it Crucial Support, with Historical PE of 65%, looks attractive for long term, of swing trading. with year on year revenue increase.
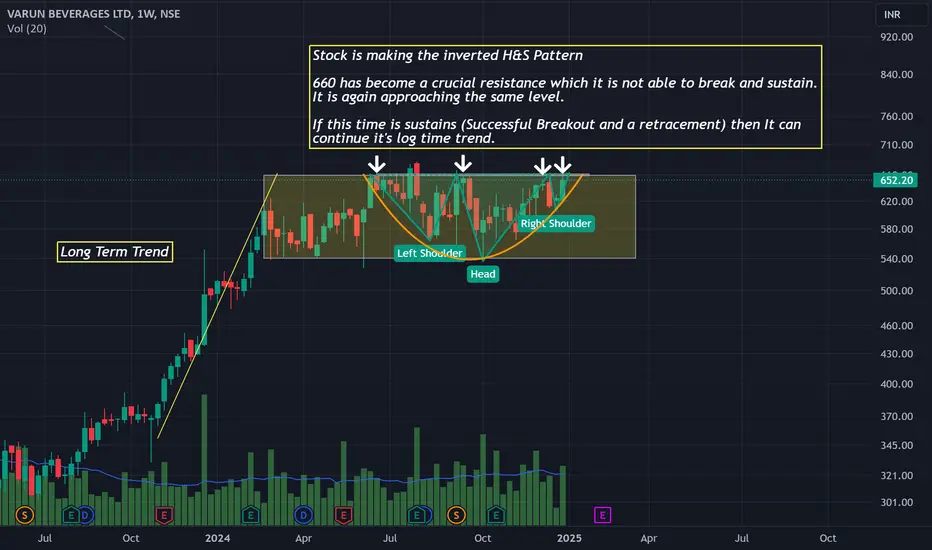
VBL: A Multibagger ready to break Key Resistance LevelTechnical Pattern :: Inverted Head & Shoulder
Key Resistance :: 660 has become a crucial resistance which it is not able to break and sustain.
It is again approaching the same level.
Possibility and Possible Move :: If this time is sustains (Successful Breakout and a retracement) then It can continue it's log time trend. (Bullish --> confirmed by a Pole and Flag pattern on weekly and monthly chart)
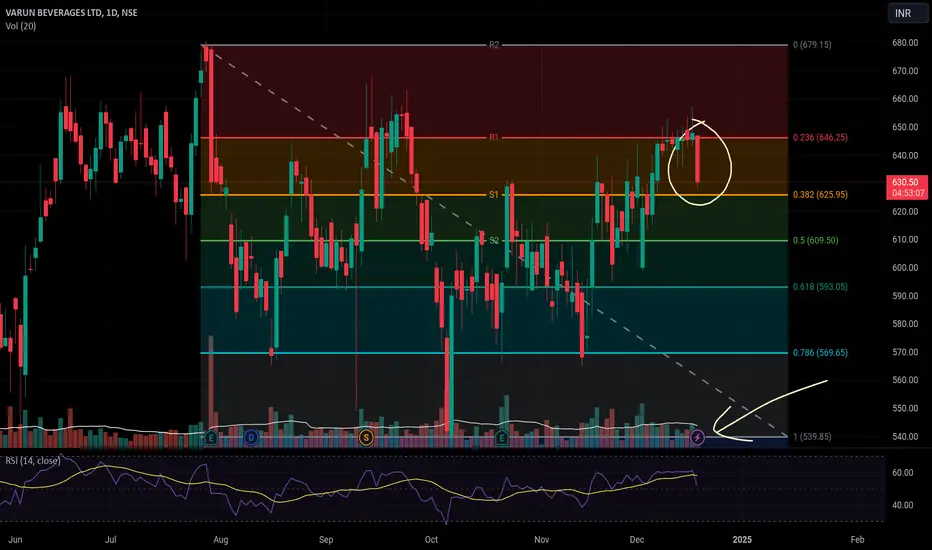
Vbl crash with Low volume can give reversal When a stock (or any tradable asset) experiences a volume breakout level crash but does so with low trading volume, it can often signal a potential reversal rather than further downside movement.
Here’s why:
1. Weak Commitment: A price break below a significant support level on low volume indicates there isn't strong conviction among market participants. In other words, sellers are not aggressively dumping shares, and buyers are likely cautious. This implies the move could lack sustainability.
2. Reversal Potential: Low-volume breakdowns often reflect temporary price movement caused by minor selling pressure, rather than a trend-defining event. If demand re-emerges or larger buyers enter the market at these lower prices, the stock may rebound above the support, triggering a reversal.
3. Significance of Support: Support levels act as zones where buying interest historically outpaces selling pressure. A false breakdown (especially on low volume) below such a level can prompt a "trap," where sellers expecting further decline are forced to cover when prices rebound, amplifying the reversal.
Key Considerations:
Volume Analysis: Always compare the volume during the support breach to the average volume. A convincing breakdown requires high volume to confirm significant selling pressure.
Catalysts: Check for underlying reasons, such as news, sector performance, or earnings reports, which could explain low-volume moves.
Price Action Afterward: Watch for a reversal candle pattern (like hammer or engulfing candle) at the breached level to validate reversal potential.
To summarize: A crash below support on low volume often indicates an unreliable breakdown and increases the probability of a reversal, especially if significant buyers step in at the lower price zone.
Amazing breakout on Weekly Timeframe - VBLCheckout an amazing breakout happened in the stock in Weekly timeframe, macroscopically seen in Daily timeframe. Having a great favor that the stock might be bullish expecting a staggering returns of minimum 25% TGT. IMPORTANT BREAKOUT LEVELS ARE ALWAYS RESPECTED!
NOTE for learners: Place the breakout levels as per the chart shared and track it yourself to get amazed!!
#No complicated chart patterns
#No big big indicators
#No Excel sheet or number magics
TRADE IDEA: WAIT FOR THE STOCK TO BREAKOUT IN LOWER TIMEFRAME AND RETRACE IF NEEDED. SL IS NEARER SUPPORT ZONE IN Daily TIMEFRAME.
Checkout an amazing breakout happened in the stock in Weekly timeframe.
Breakouts happening in longer timeframe is way more powerful than the breakouts seen in Daily timeframe. You can blindly invest once the weekly candle closes above the breakout line and stay invested forever. Also these stocks breakouts are lifelong predictions, it means technically these breakouts happen giving more returns in the longer runs. Hence, even when the scrip makes a loss of 10% / 20% / 30% / 50%, the stock will regain and turn around. Once they again enter the same breakout level, they will flyyyyyyyyyyyy like a ROCKET if held in the portfolio in the longer run.
Time makes money, GREEDY & EGO will not make money.
Also, magically these breakouts tend to prove that the companies turn around and fundamentally becoming strong. Also the magic happens when more diversification is done in various sectors under various scripts with equal money invested in each N500 scripts.
The real deal is when to purchase and where to purchase the stock. That is where Breakout study comes into play.
LET'S PUMP IN SOME MONEY AND REVOLUTIONIZE THE NATION'S ECONOMY!
VBL swing trade | visit chart for detailsHello,
Trend-Based Analysis. Buy the Dips, Sell The Rallies, Also Following the Trend. Let's see where the Price Action takes us, Riding the wave. Potential trade setups based on trend momentum.
Technical analysis based on trend identification and momentum, Looking for high-probability setups within the prevailing trend.
Analyzing the current market trend and potential future price movement. Focusing on risk management and reward-to-risk ratios.
Details is Mentioned in Chart, Read carefully.. .
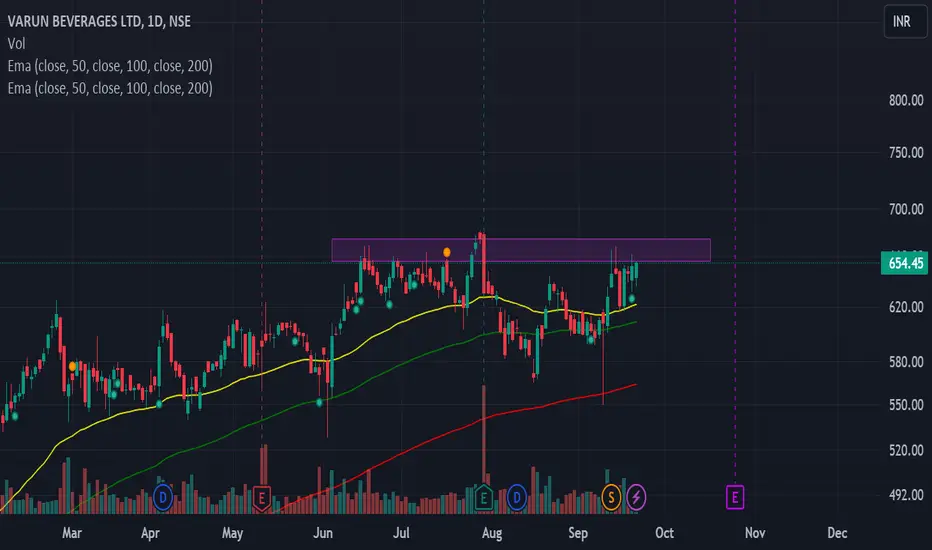
POV on VBLPOV @ VBL : Varun Beverages Ltd
Trade and Momentum Seems in Sync. Market Corrected but VBL not take part in it.
3 days ago result release and accepted by market, little pullback on friday give us good risk reward to play I am expecting breakout from here
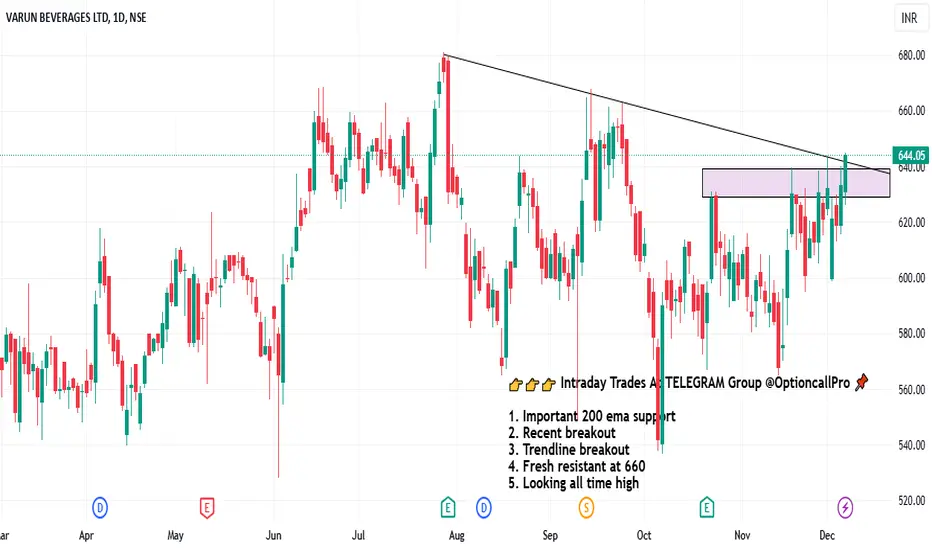
Varun Beverages ltd view for Intraday 14th October #VBL Varun Beverages ltd view for Intraday 14th October #VBL
Buying may witness above 596
Support area 587. Below ignoring buying momentum for intraday
Selling may witness below 595-596
Resistance area 490
Above ignoring selling momentum for intraday
Charts for Educational purposes only.
Please follow strict stop loss and risk reward if you follow the level.
Thanks,
V Trade Point
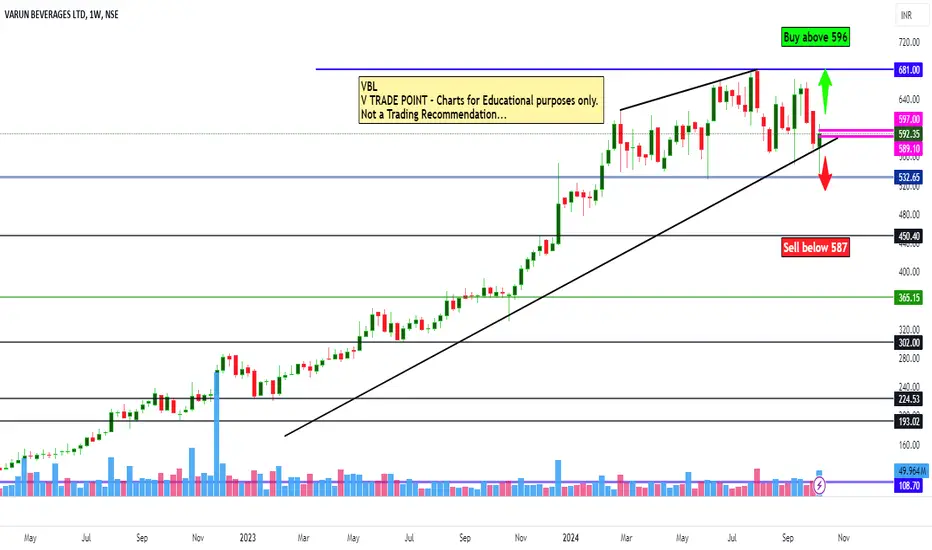
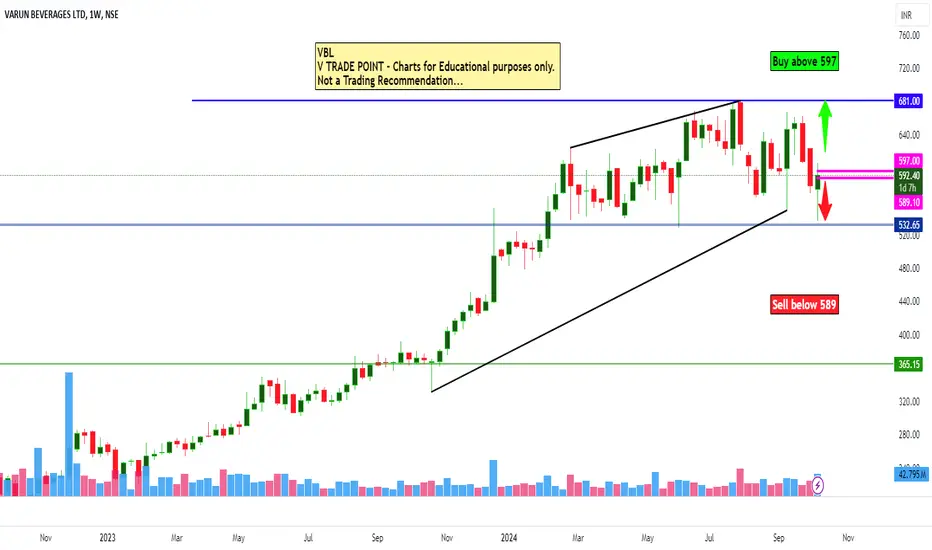
Varun Beverages Ltd view for Intraday 10th October #VBL Varun Beverages Ltd view for Intraday 10th October #VBL
Buying may witness above 597
Support area 589-590. Below ignoring buying momentum for intraday
Selling may witness below 589
Resistance area 595-597
Above ignoring selling momentum for intraday
Charts for Educational purposes only.
Please follow strict stop loss and risk reward if you follow the level.
Thanks,
V Trade Point
VBL would likely to tough monthly supportVBL would likely to come down to its monthly support 589.60 and then it will go up. so keen an eye on VBL it would be good chance for swing traders like me.
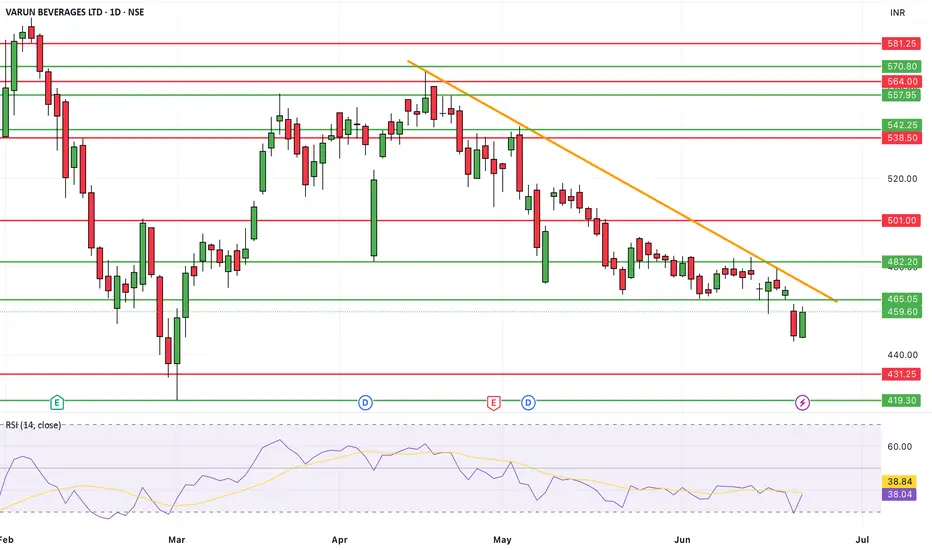
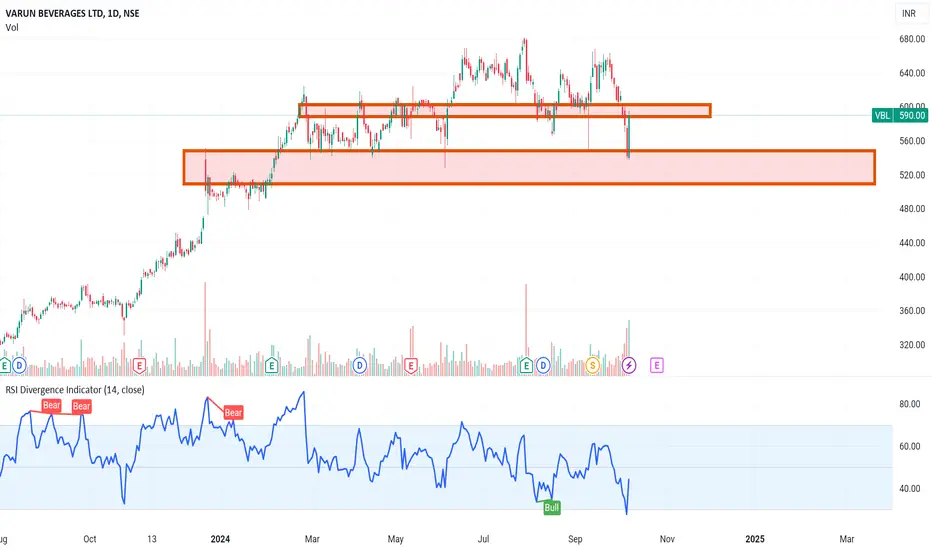
VARUN BEVERAGES LTD S/R Support and Resistance Levels:
Support Levels: These are price points (green line/shade) where a downward trend may be halted due to a concentration of buying interest. Imagine them as a safety net where buyers step in, preventing further decline.
Resistance Levels: Conversely, resistance levels (red line/shade) are where upward trends might stall due to increased selling interest. They act like a ceiling where sellers come in to push prices down.
Breakouts:
Bullish Breakout: When the price moves above resistance, it often indicates strong buying interest and the potential for a continued uptrend. Traders may view this as a signal to buy or hold.
Bearish Breakout: When the price falls below support, it can signal strong selling interest and the potential for a continued downtrend. Traders might see this as a cue to sell or avoid buying.
20 EMA (Exponential Moving Average):
Above 20 EMA: If the stock price is above the 20 EMA, it suggests a potential uptrend or bullish momentum.
Below 20 EMA: If the stock price is below the 20 EMA, it indicates a potential downtrend or bearish momentum.
Trendline: A trendline is a straight line drawn on a chart to represent the general direction of a data point set.
Uptrend Line: Drawn by connecting the lows in an upward trend. Indicates that the price is moving higher over time. Acts as a support level, where prices tend to bounce upward.
Downtrend Line: Drawn by connecting the highs in a downward trend. Indicates that the price is moving lower over time. It acts as a resistance level, where prices tend to drop.
RSI: RSI readings greater than the 70 level are overbought territory, and RSI readings lower than the 30 level are considered oversold territory.
Combining RSI with Support and Resistance:
Support Level: This is a price level where a stock tends to find buying interest, preventing it from falling further. If RSI is showing an oversold condition (below 30) and the price is near or at a strong support level, it could be a good buy signal.
Resistance Level: This is a price level where a stock tends to find selling interest, preventing it from rising further. If RSI is showing an overbought condition (above 70) and the price is near or at a strong resistance level, it could be a signal to sell or short the asset.
Disclaimer:
I am not a SEBI registered. The information provided here is for learning purposes only and should not be interpreted as financial advice. Consider the broader market context and consult with a qualified financial advisor before making investment decisions.
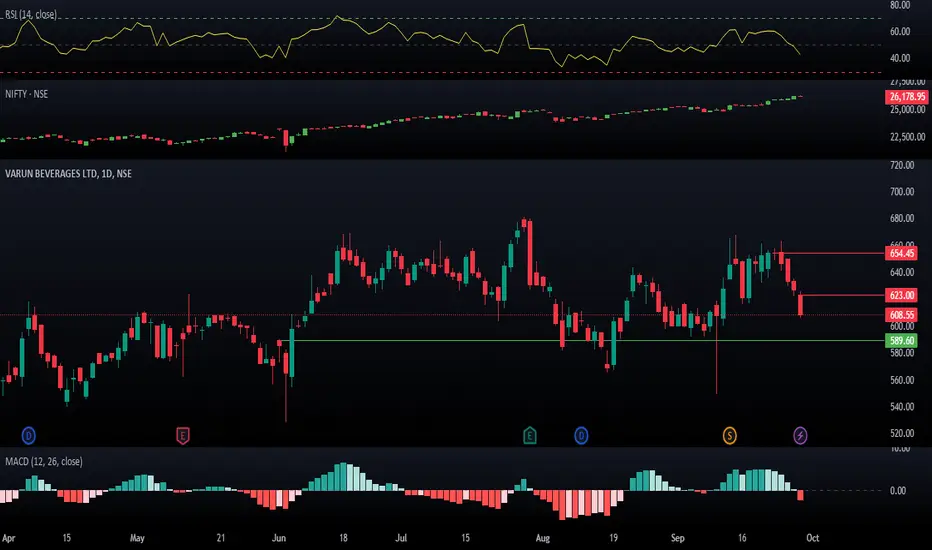
VBL Breakin out?buy above 655
Sl 642
Taret upto 740
classical arc formation
rsi aroun 60
MACD bullis diverencr
strictly for educational purpose and not invest advise
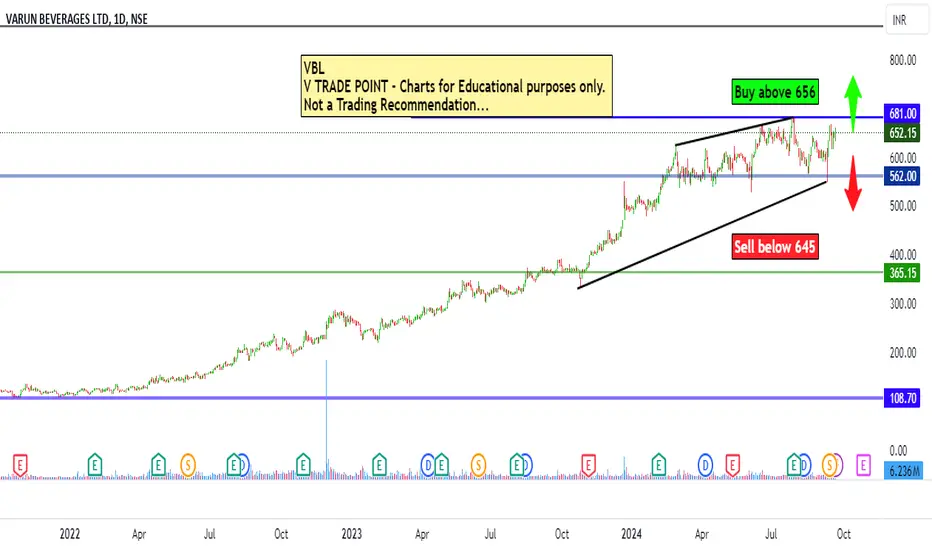
Varun Beverages Ltd view for Intraday 20th September #VBL Varun Beverages Ltd view for Intraday 20th September #VBL
Buying may witness above 656
Support area 645. Below ignoring buying momentum for intraday
Selling may witness below 645
Resistance area 655-656
Above ignoring selling momentum for intraday
Charts for Educational purposes only.
Please follow strict stop loss and risk reward if you follow the level.
Thanks,
V Trade Point
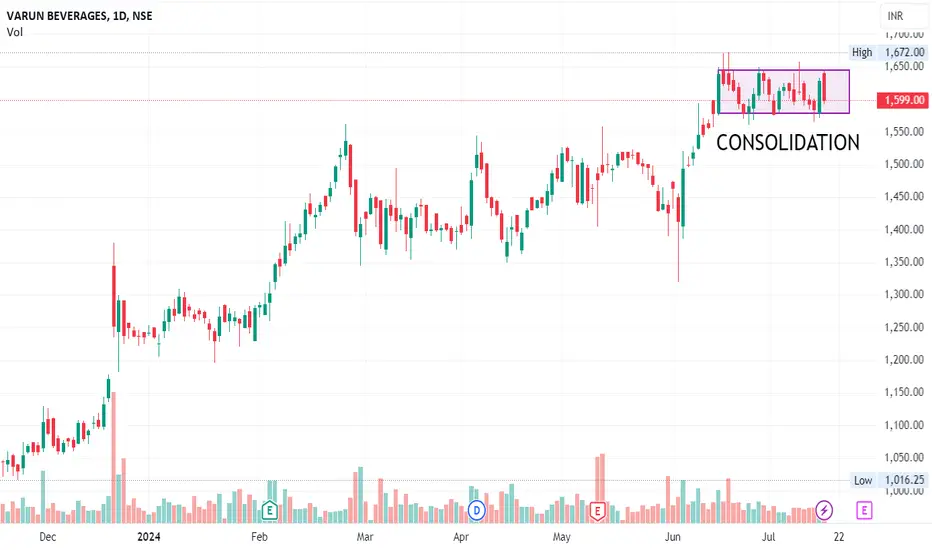
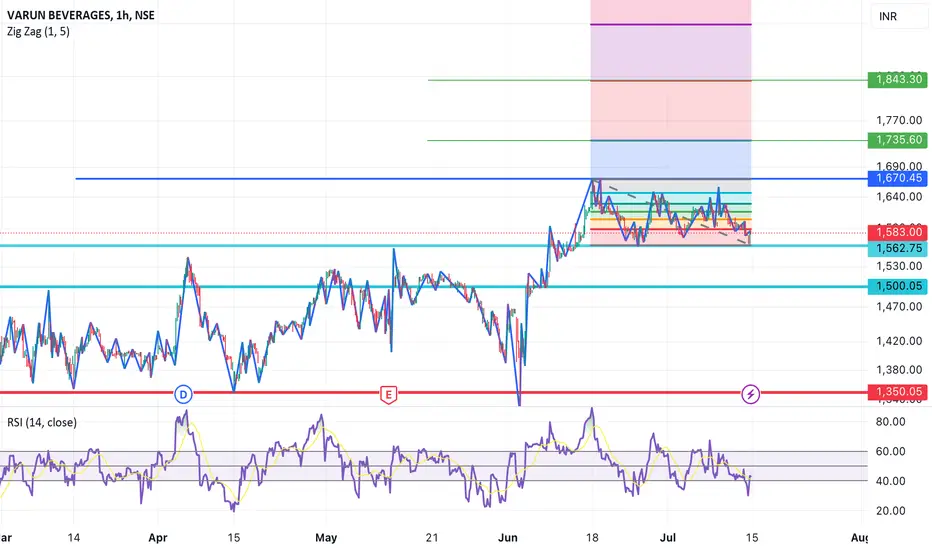
Varun BeveragesStock is consolidating between 1550 to 1600 range since June 2024.
this stock can be bought in every dips and the accumulation zone is between 1500- 1600. but 1562 is a great support for the stock
Short term trades can maintain a stop-loss at 1350.
First Target - 1670
Second Target - 1735
Third Target - 1843
this idea is for only eduction purpose and not for realtime trading. kindly consult your financial advisor before investing
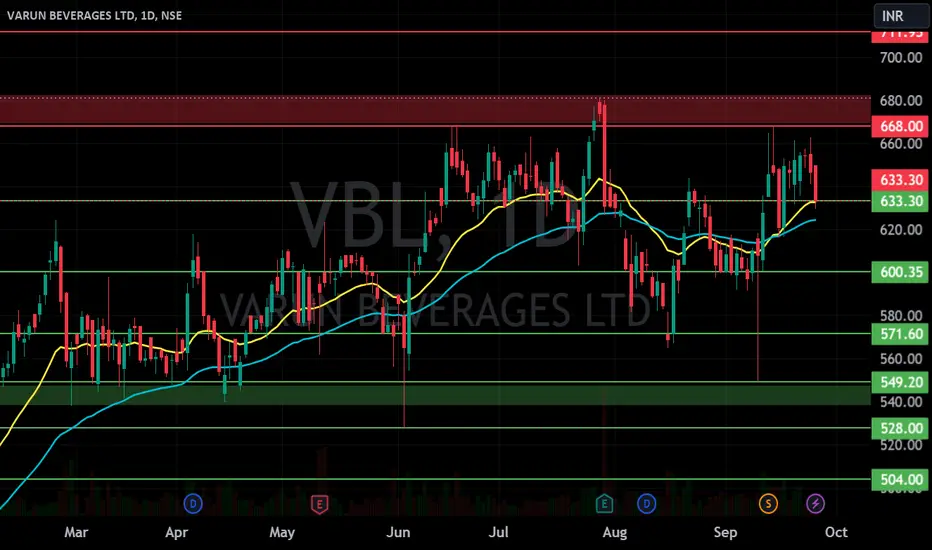
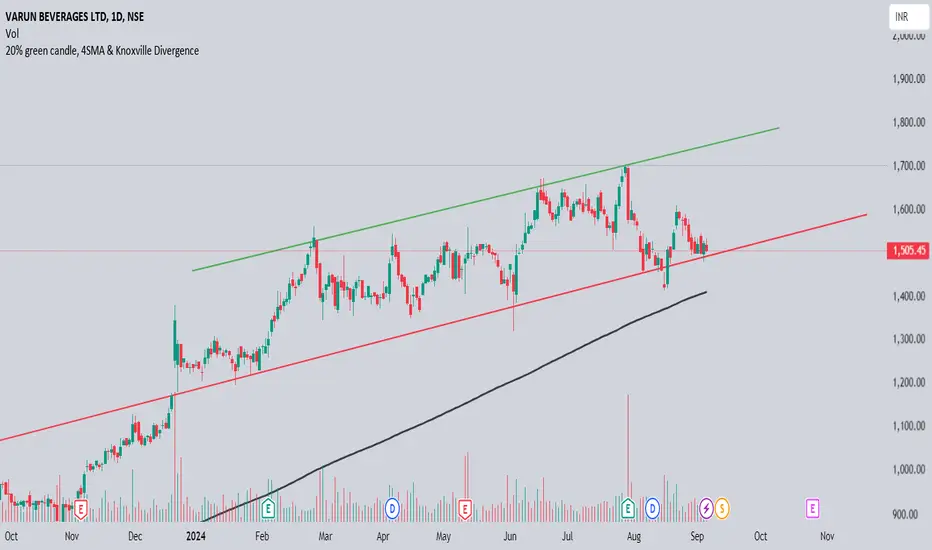
VBL on support line in Daily chartVBL moving in channel and it's on support line now
Good fundamentals
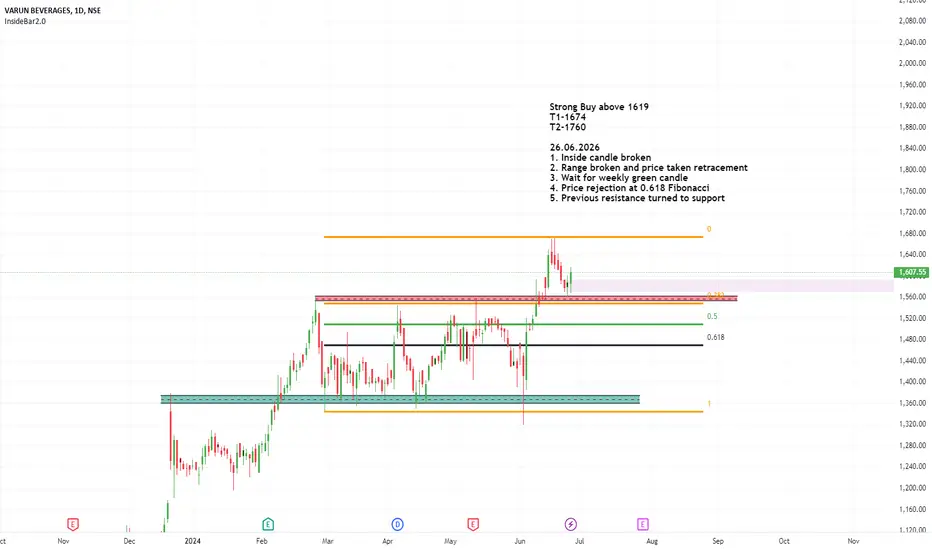
Strong Buy-Varun Beverage-VBL
Strong Buy above 1619
T1-1674
T2-1760
SL-1551
26.06.2026
1. Inside candle broken
2. Range broken and price taken retracement
3. Wait for weekly green candle
4. Price rejection at 0.618 Fibonacci
5. Previous resistance turned to support
Just A View - VBL 📊 Script: VBL
📊 Sector: FMCG
📊 Industry: Food - Processing - Indian
Key highlights: 💡⚡
📈 Script is trading in consolidation zone since last few trading session.
📈 Script has to give breakout or breakdown to came put of consolidation zone.
📈 For breakout script has to give closing above 1644, and for breakout script has to give closing below 1578
KEEP AN EYE ON STOCK
⚠️ Important: Always maintain your Risk & Reward Ratio.
✅Like and follow to never miss a new idea!✅
Disclaimer: I am not SEBI Registered Advisor. My posts are purely for training and educational purposes.
Eat🍜 Sleep😴 TradingView📈 Repeat 🔁
Happy learning with trading. Cheers!🥂