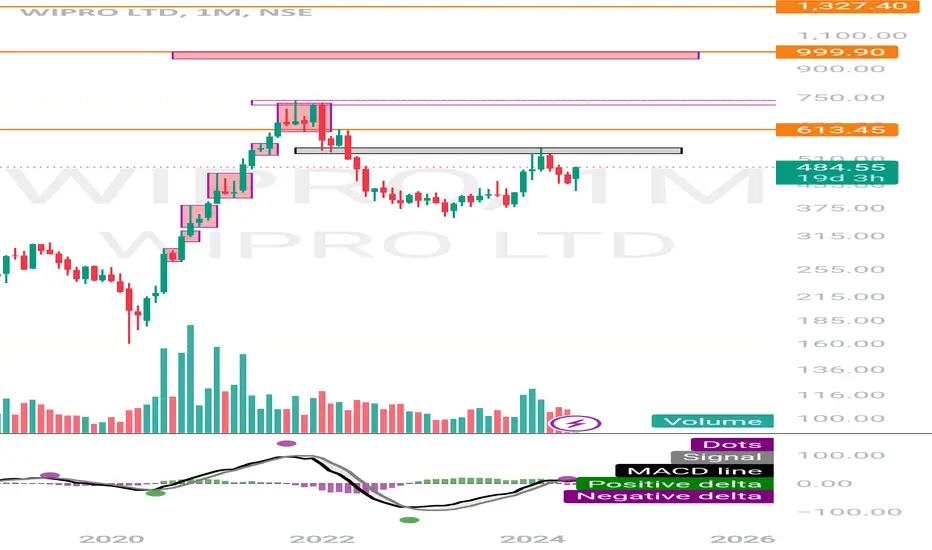
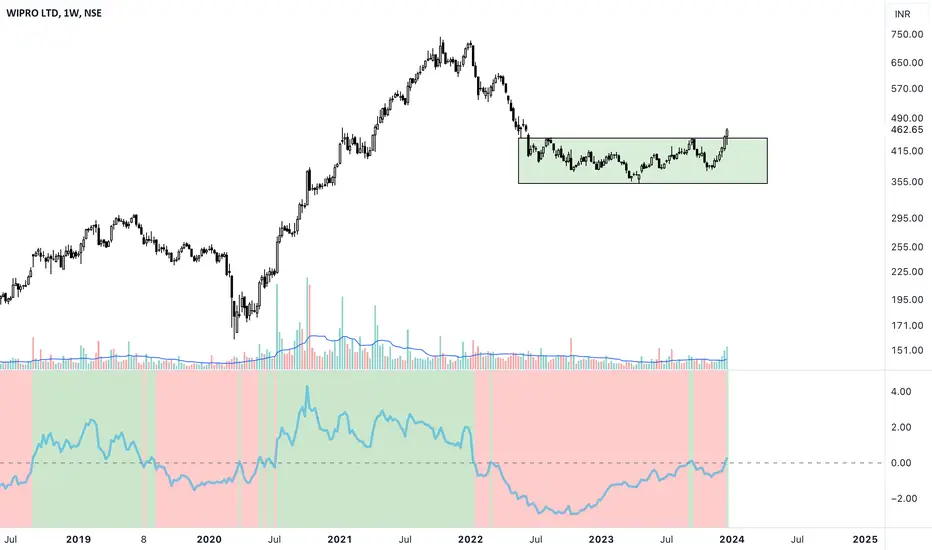
WIPRO leaving the stationAnother company which has the time lag to the whole economy growth is WIPRO. The price has break the important level with the strong impulse, and has retested it after 5000 days since the first day of this level formation. Expecting that the price will stay above this strong level, and the asset will continue to grow.
Targets are mentioned on chart.
Trade cancellation will occur, if the price wouldn't manage to stay above the support zone.
DYOR
WIPRO trade ideas
WIPRO S/R for 19/8/24Support and Resistance Levels:
Support Levels: These are price points (green line/share) where a downward trend may be halted due to a concentration of buying interest. Imagine them as a safety net where buyers step in, preventing further decline.
Resistance Levels: Conversely, resistance levels (red line/shade) are where upward trends might stall due to increased selling interest. They act like a ceiling where sellers come in to push prices down.
Breakouts:
Bullish Breakout: When the price moves above resistance, it often indicates strong buying interest and the potential for a continued uptrend. Traders may view this as a signal to buy or hold.
Bearish Breakout: When the price falls below support, it can signal strong selling interest and the potential for a continued downtrend. Traders might see this as a cue to sell or avoid buying.
20 EMA (Exponential Moving Average):
Above 20 EMA: If the stock price is above the 20 EMA, it suggests a potential uptrend or bullish momentum.
Below 20 EMA: If the stock price is below the 20 EMA, it indicates a potential downtrend or bearish momentum.
Trendline: A trendline is a straight line drawn on a chart to represent the general direction of a data point set.
Uptrend Line: Drawn by connecting the lows in an upward trend. Indicates that the price is moving higher over time. Acts as a support level, where prices tend to bounce upward.
Downtrend Line: Drawn by connecting the highs in a downward trend. Indicates that the price is moving lower over time. It acts as a resistance level, where prices tend to drop.
Disclaimer:
I am not a SEBI registered. The information provided here is for learning purposes only and should not be interpreted as financial advice. Consider the broader market context and consult with a qualified financial advisor before making investment decisions.

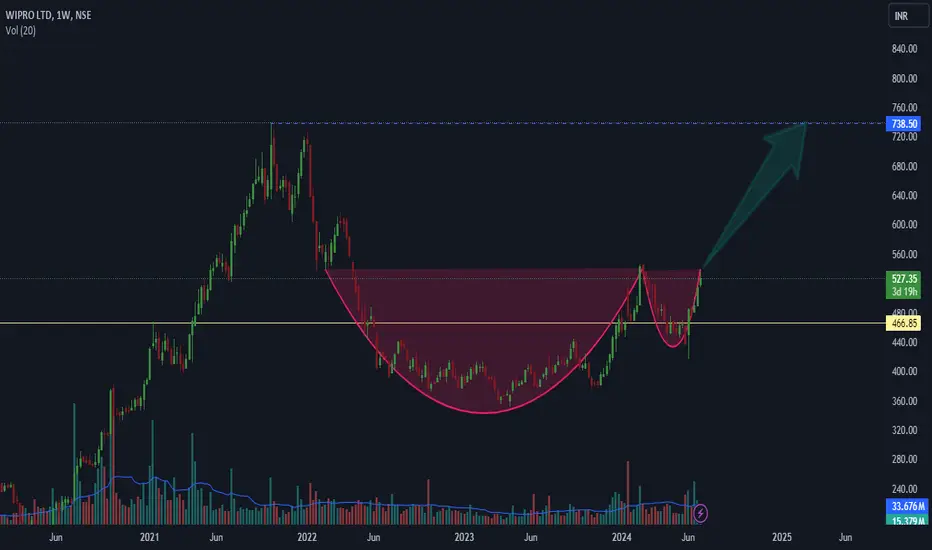
WIPRO AnalysisWipro the IT giant of Bharat has given us a cup with handle pattern. The buy point in anywhere below 545 and sell point is all time high. The company has posted consistent profits and has maintained its revenue in such difficult time for the industry. It has given a profit of 3000+ crore after 4 quarters and currently the stock is 30% lower from its lifetime high when the profit was 3000+ crore. So there is a clear opportunity in the stock.
Hope you like my analysis.
Please do your own analysis before investing.
Do like and follow and share among your friends and family.
Thank you.
Wipro After breakdown Wipro recoverd and now sideways. Marked with blue line.
If it break cup pattern on higher side then a big gap to be filled.
Overall a move in IT sector is due.
This is just for educational purpose

Wipro Case Study: Elliott Wave Analysis for Educational PurposesWIPRO multi time frames charts updated
Weekly Chart
Daily Chart
4 Hourly
60 Min
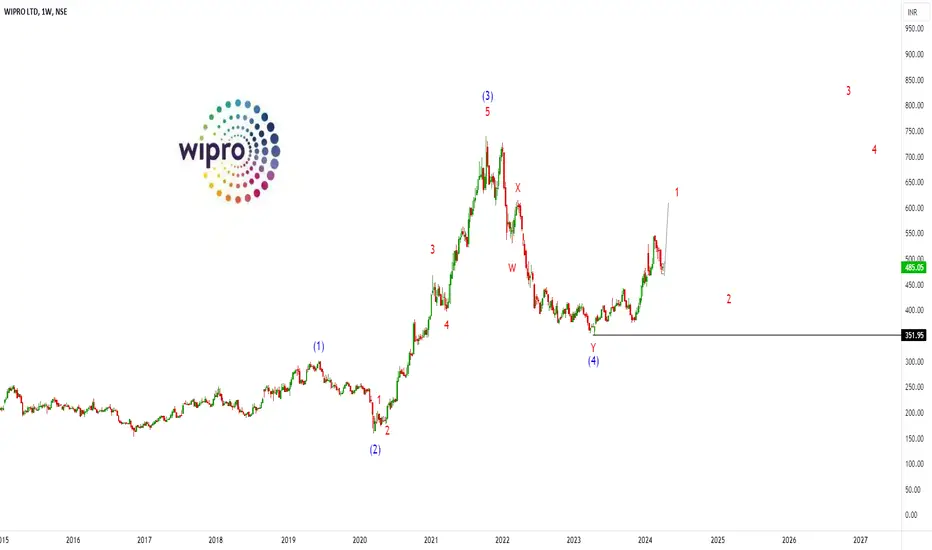
In this educational case study, we delve into the chart analysis of Wipro using Elliott Wave Theory. Our analysis focuses on identifying potential wave patterns and understanding the current wave structure for educational purposes only.
Overview:
After a significant decline in the larger Wave (4), Wipro appears to have initiated Wave 1 of (5). Within Wave 1 of (5), we have observed completion of sub-waves (i)-(ii)-(iii), and (iv) is nearing completion. The current structure suggests that sub-wave (v) of Wave 1 of (5) could soon commence.
Detailed Analysis:
Wave (4) Correction: Wipro experienced a notable decline in Wave (4), signaling a potential shift in sentiment.
Wave 1 of (5): Following Wave (4), the stock initiated Wave 1 of (5), marked by the completion of sub-waves (i)-(ii)-(iii).
Current Structure: We are currently witnessing the final stages of sub-wave (iv) of Wave 1 of (5), with sub-waves i-ii-iii-iv completed.
Anticipated Movement: Sub-wave (v) of Wave 1 of (5) is expected to commence soon, potentially marking the final fall before an upward move.
Risk Management and Wave Highlights:
It's essential to implement proper risk management strategies, including setting stop-loss levels to mitigate potential losses.
Traders should exercise caution and remain vigilant for any deviations from the expected wave counts.
Understanding Elliott Wave Theory can provide valuable insights into market trends and potential price movements.
Remember, this analysis is for educational purposes only and should not be considered as trading advice.
I am not Sebi registered analyst.
My studies are for educational purpose only.
Please Consult your financial advisor before trading or investing.
I am not responsible for any kinds of your profits and your losses.
Most investors treat trading as a hobby because they have a full-time job doing something else.
However, If you treat trading like a business, it will pay you like a business.
If you treat like a hobby, hobbies don't pay, they cost you...!
Hope this post is helpful to community
Thanks
RK💕
Disclaimer and Risk Warning.
The analysis and discussion provided on in.tradingview.com is intended for educational purposes only and should not be relied upon for trading decisions. RK_Charts is not an investment adviser and the information provided here should not be taken as professional investment advice. Before buying or selling any investments, securities, or precious metals, it is recommended that you conduct your own due diligence. RK_Charts does not share in your profits and will not take responsibility for any losses you may incur. So Please Consult your financial advisor before trading or investing.
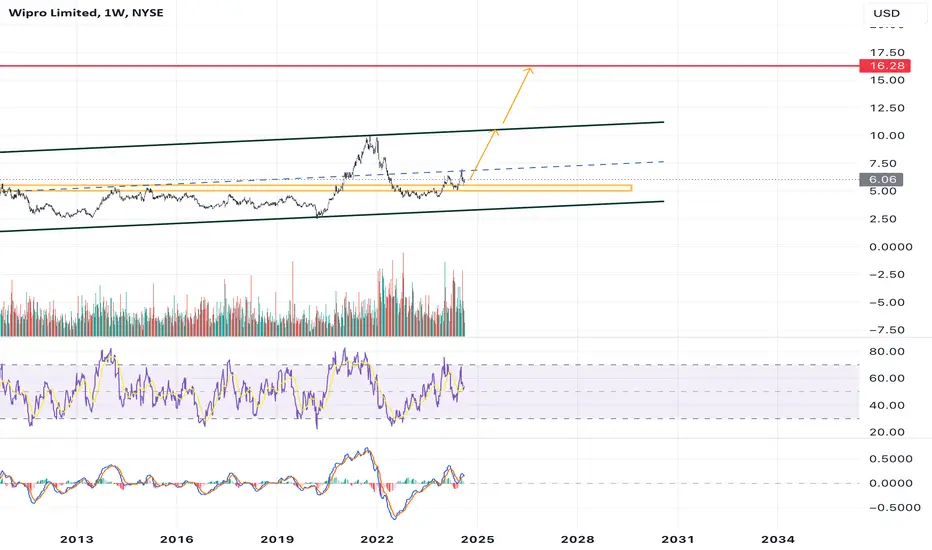
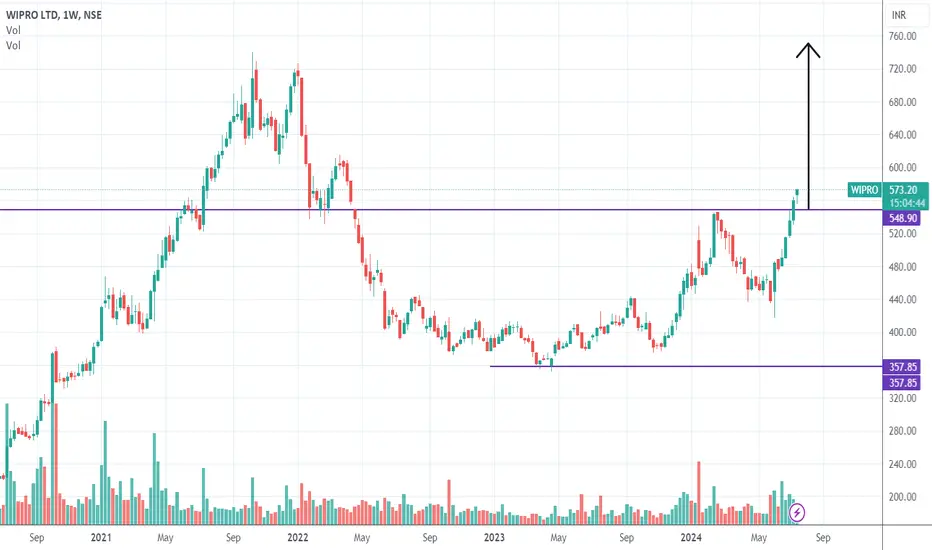
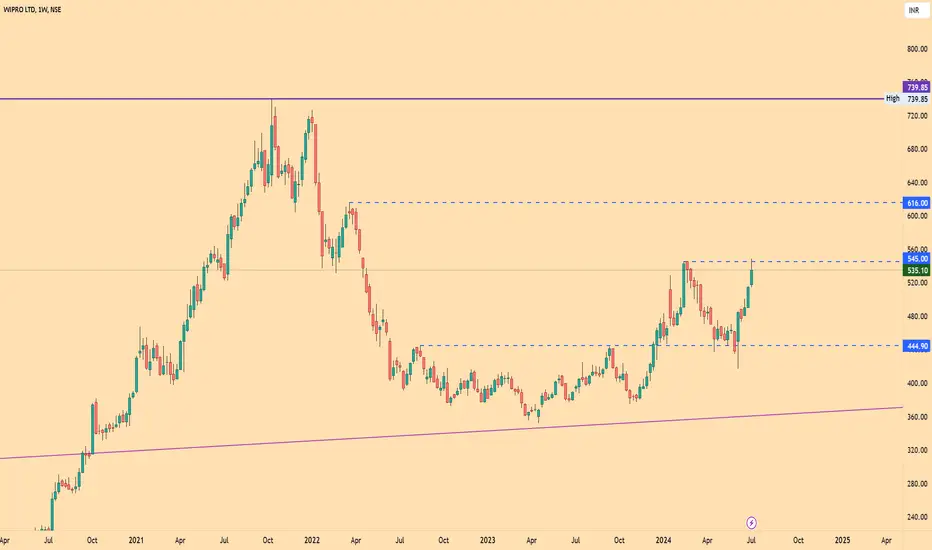
Wipro ready for a turnaroundIn the recent bull rally, a strong stock has been consolidating in one of the underperforming sectors (IT) in the recent bull run. The sector is coming out of consolidation and Wipro looks strong to head upward from here
Entry above 575
Stop loss below 520
Target 722/752
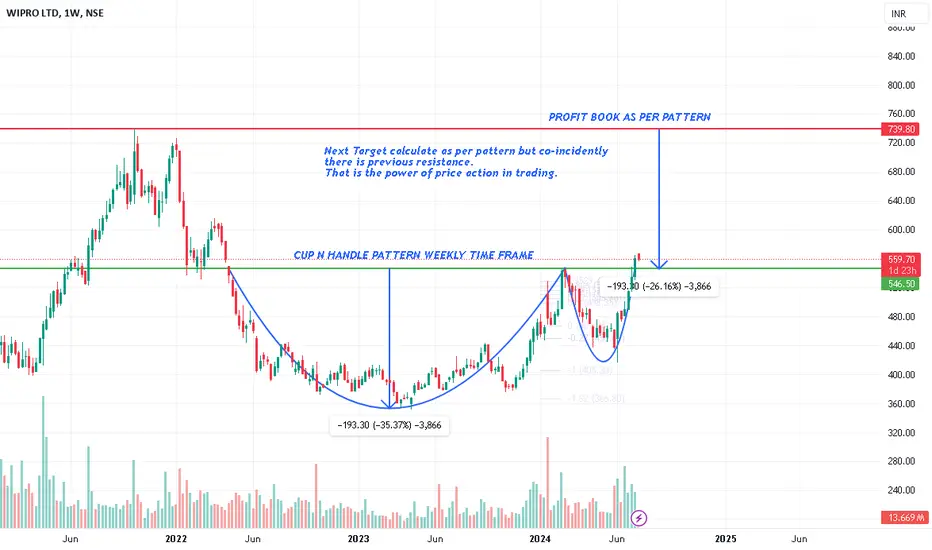
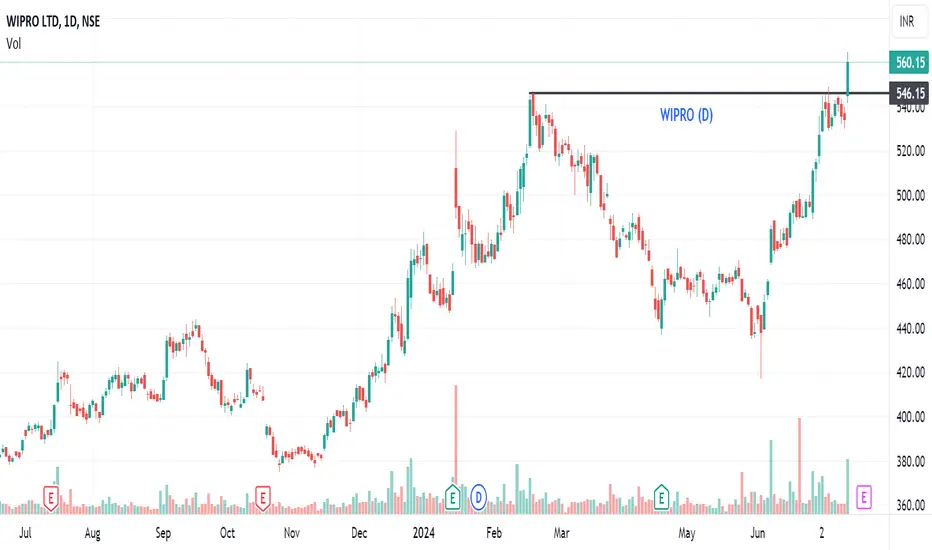
Wipro weekly time frame ananlysisWipro formed a Cup n Handle Pattern in weekly time frame. Level 546 is neckline of pattern, Breakout of this level confirmation of pattern breakout so you can bullish in this stock for the target of 725-740 approx. Happy Trading.
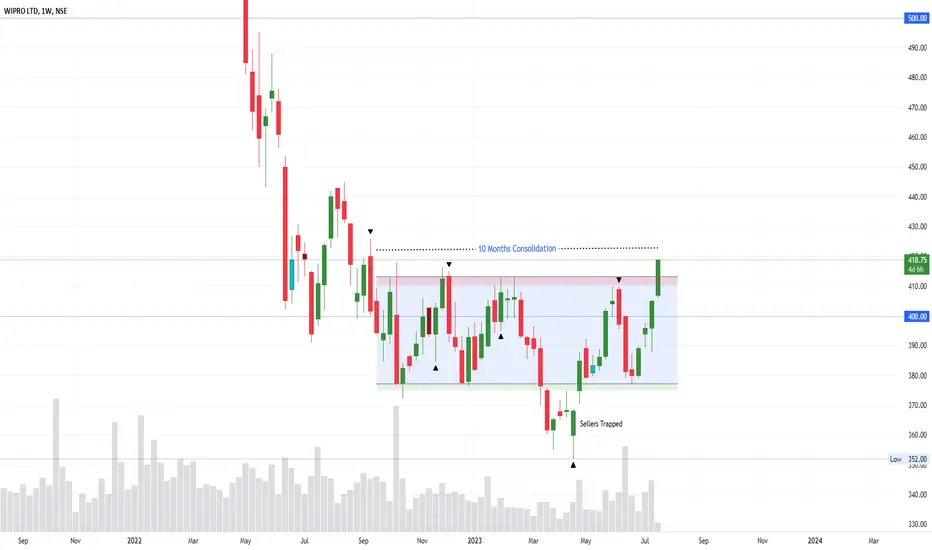
WIPRO: Out of the shell ?- The chart is pretty self-explanatory but here is the gist:
- 10 months of pure sideways consolidation (I get it. Wipro tested Investor's patience, the most)
- Breaks the support only to reverse back into the range, trapping sellers
- On the verge of breaking its range for the cage-free price momentum
- Also, the Indian IT sector is approaching its critical resistance for the third time. (link in the comment section)
- Don't let the analysis end here! Boost, comment, and follow for more such insightful posts
⚠️Disclaimer: We are not registered advisors. The views expressed here are merely personal opinions. Irrespective of the language used, Nothing mentioned here should be considered as advice or recommendation. Please consult with your financial advisors before making any investment decisions. Like everybody else, we too can be wrong at times ✌🏻

SWING IDEA - WIPRORetesting Current S/R zone @ 455.
Weekly closing above 455 levels should see a good move toward 500-520 in the coming weeks
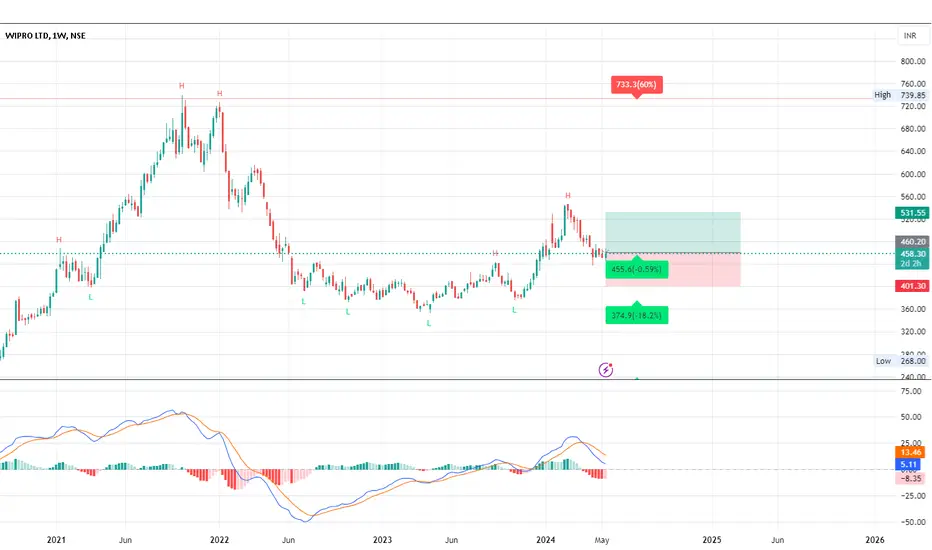
WIPRO - The IT sector pick with Minimal Downside Risk!Overview:
- Entry Point: Current Market Price (CMP) 475
- Target: Around All-Time High (ATH) 740
- Risk-Reward Ratio: With a downside risk of just 10% and aiming for a 50% upside, this trade offers an impressive 1:5 RR ratio.
Aiming for a significant upside with well-managed risk. Let's see if we can capture this opportunity right!
Stay tuned for updates and trade safely! Happy trading!
Disclaimer: This is NOT a buy/sell recomendation. This post is meant for learning purposes only. Please, do you due diligence before investing.
Thanks & Regards,
Anubrata Ray

WIPRO, Cup and HandlePotential breakout from the cup and handle,
Target at 713, Stoploss at 431
Disclaimer : I am a aspiring swing trader, i have only started to learn to catch the pattern. So, please take this only as a idea

WIPRO SHORT `POSITIONHi traders,
Turning our attention to WIPRO , we can observe that the price has been traded inside the upward-sloping channel .On another hand , relative strength index indicates an overbought territory and the price is approaching the resistance line , therefore we believe that the short position can be taken when the price retests this resistance line . The target would be at the up-slopping support . Invalidation of this thesis would be successful close above the up-sloping resistance line.

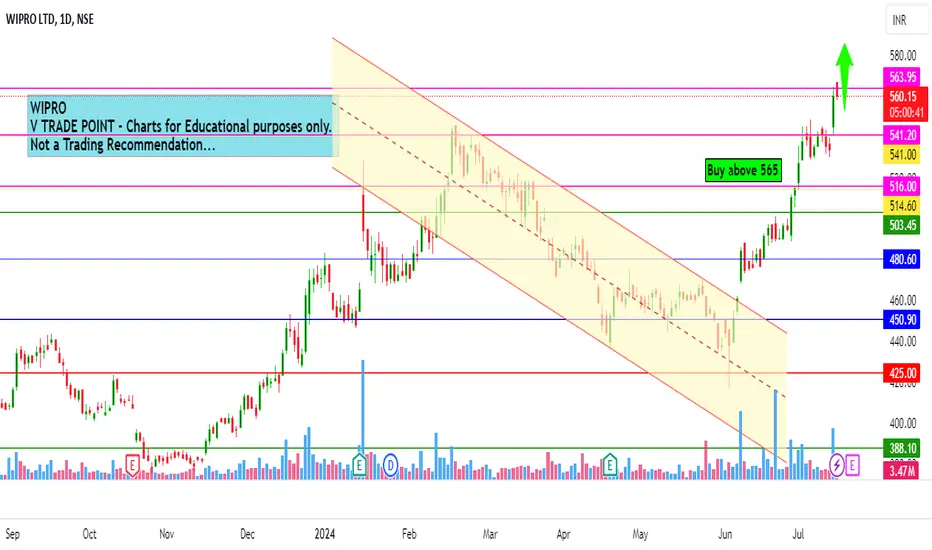
Wipro Intraday level for 15th July #WIPRO
Wipro Intraday level for 15th July #WIPRO
Buying opportunity above 565
Support area 560. Below ignoring buying opportunity
Charts for Educational purposes only.
Please follow strict stop loss and risk reward if you follow the level.
Thanks,
V Trade Point
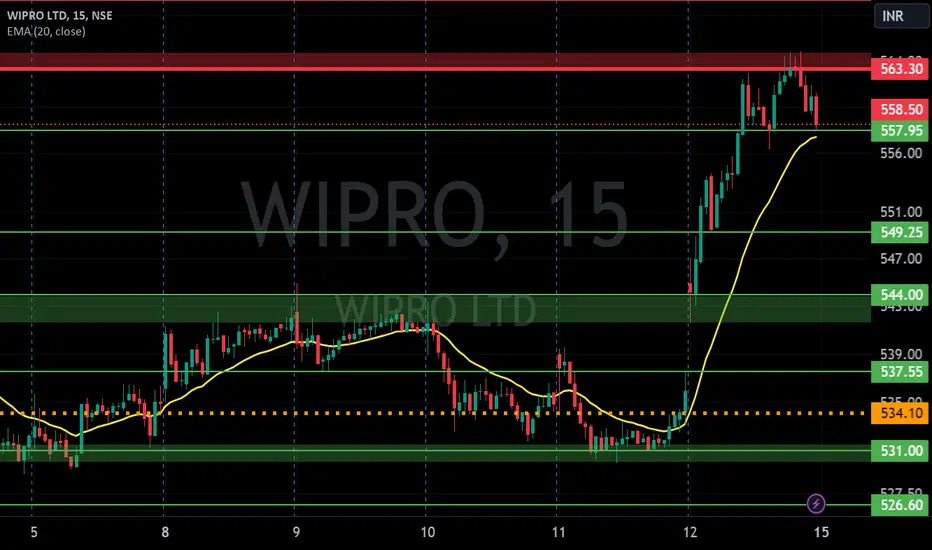
WIPRO LTD S/R for 15/7/24Support and Resistance Levels: In technical analysis, support and resistance levels are significant price levels where buying or selling interest tends to be strong. They are identified based on previous price levels where the price has shown a tendency to reverse or find support.
Support levels are represented by the green line and green shade, indicating areas where buying interest may emerge to prevent further price decline.
Resistance levels are represented by the red line and red shade, indicating areas where selling pressure may arise to prevent further price increases. Traders often consider these levels as potential buying or selling opportunities.
Breakouts: Breakouts occur when the price convincingly moves above a resistance level (red shade) or below a support level (green shade). A bullish breakout above resistance suggests the potential for further price increases, while a bearish breakout below support suggests the potential for further price declines. Traders pay attention to these breakout signals as they may indicate the start of a new trend or significant price movement.
20 EMA: The yellow line denotes 20 EMA, to interpret the 20 EMA, you need to compare it with the prevailing stock price. If the stock price is below the 20 EMA, it signals a possible downtrend. But if the stock price is above the 20 EMA, it signals a possible uptrend.
Disclosure: I am not SEBI registered. The information provided here is for learning purposes only and should not be interpreted as financial advice. It is important to consult with a qualified financial advisor before making any investment decisions. Tweets neither advice nor endorsement.
WIPRO Cup&HandleThis stock has formed a Bullish structure pattern - Cup & Handle and have given a Neckline breakout, may retest the neckline and head for making targets of CUP & Handle. Even Data is also supporting as i see largest OI at 600 strike, Just a View not a Reco..

Wipro strong breakoutin my opinion now wipro share give strong breakout
for 1st Traget 610
2nd target 713
what you think guys?

WIPROSupport and Resistance Levels: In technical analysis, support and resistance levels are significant price levels where buying or selling interest tends to be strong. They are identified based on previous price levels where the price has shown a tendency to reverse or find support.
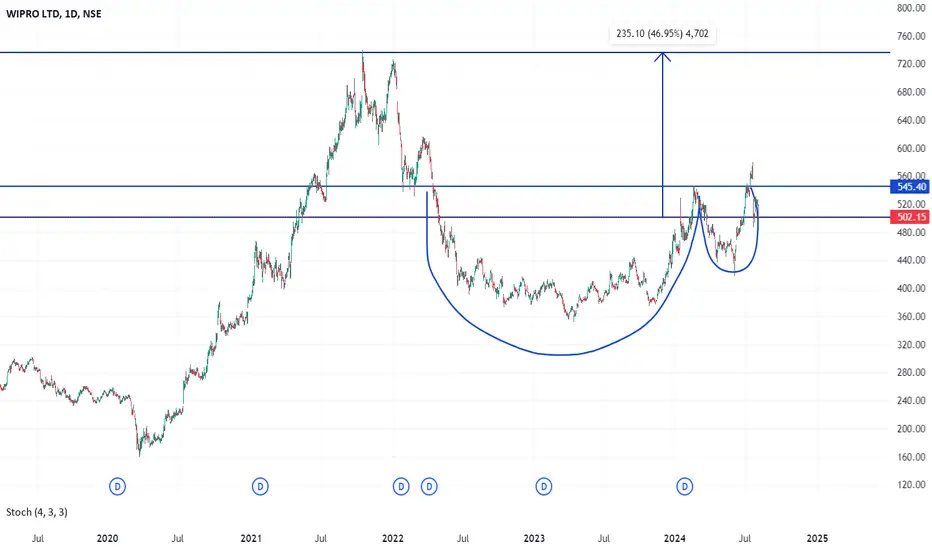
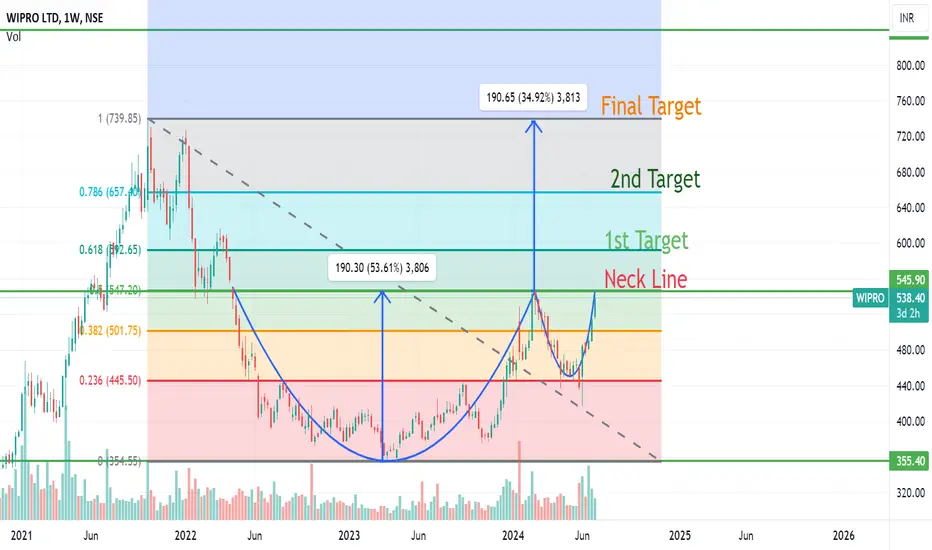
Wipro forming CUP & Handle PatternWipro just going to complete Cup & Handle pattern ,Buy above neck line with a stop loss of 501 .As per Fib Retracement ,Target mention on chart .Final target as per Fib Retracement , Cup & handle method will be arround 700
Wipro will be the future PRO in IT Group Wipro has shown huge consolidation in lower levels and now the time has come for the bull run in IT pack