ZEEL trade ideas
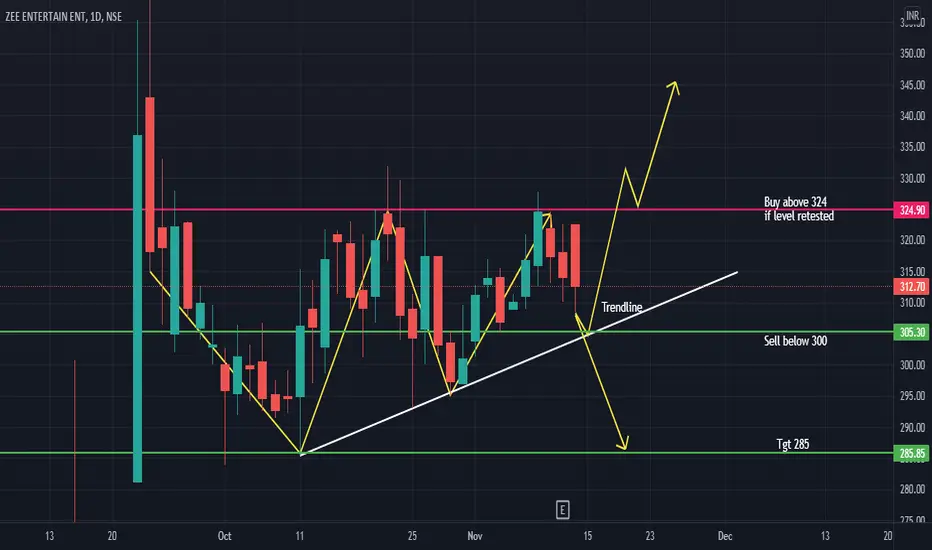
ZEEL LevelsStock is has made W pattern.
Moving Sideways
volume reducing
rest all level as shown on charts
requested by many so uploading Zeel chart
Must Correlate yourself also on charts before taking an entry. This is for Educational purposes only. Please consult your Financial advisor before investing.
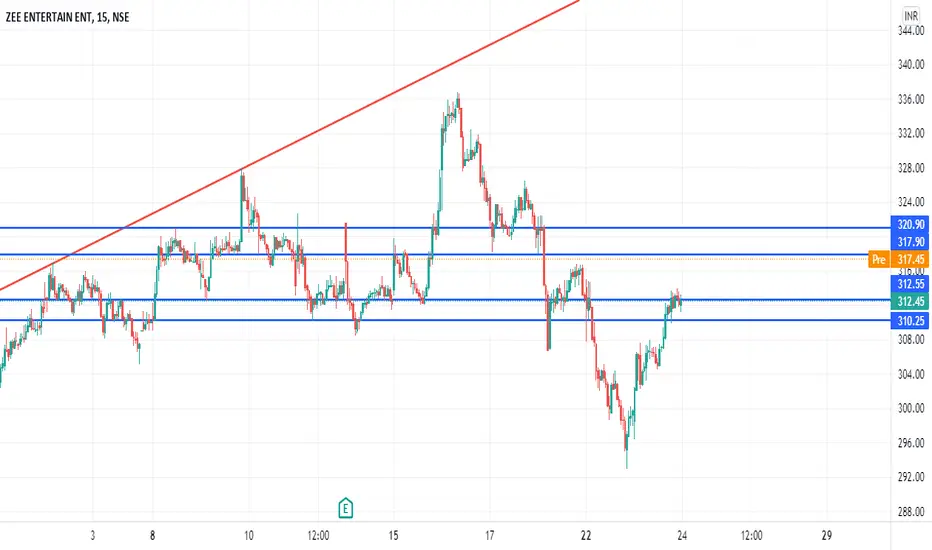
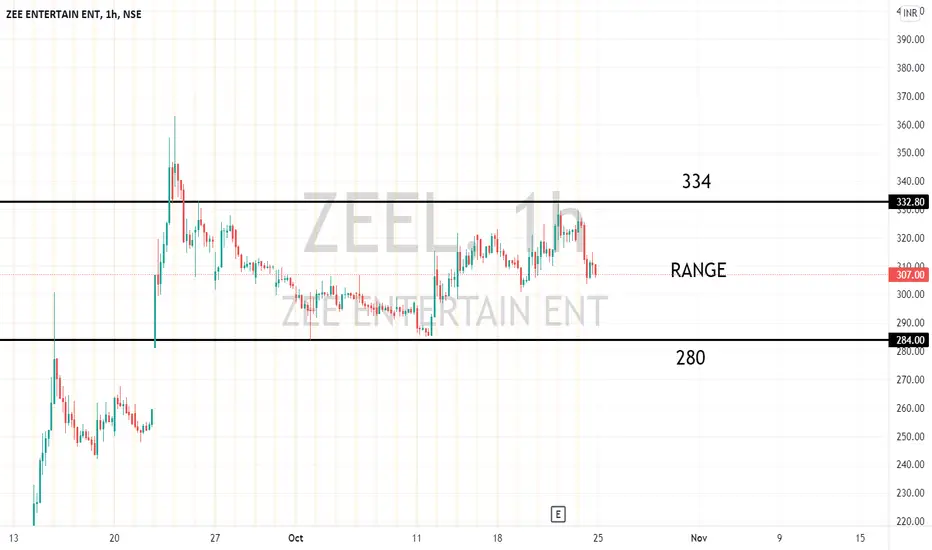
Zee Entertainment ZEELZeel is trading in Range of 50 Points since last month.
Upside : - 334'
Downside : - 280.
When this Range Break either on upside or downside.
One can expect good momentum in this stock.
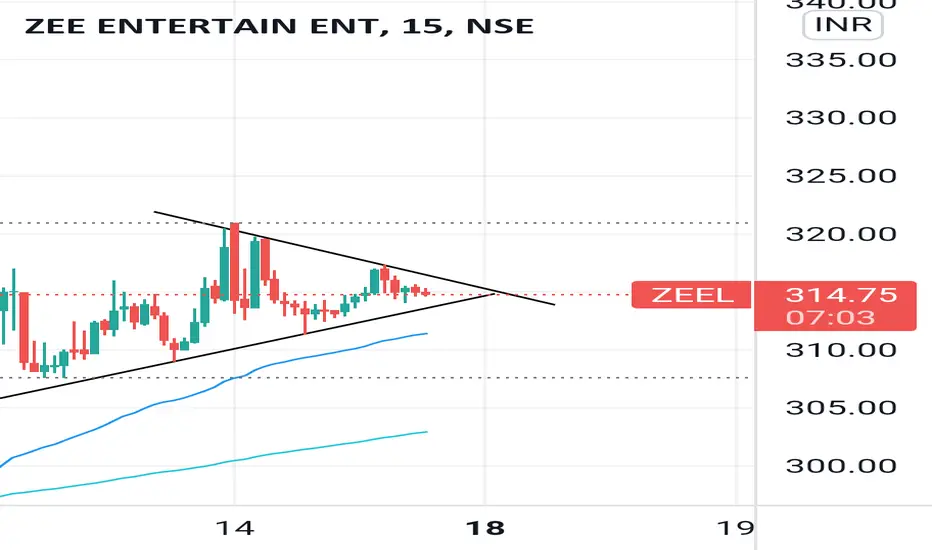
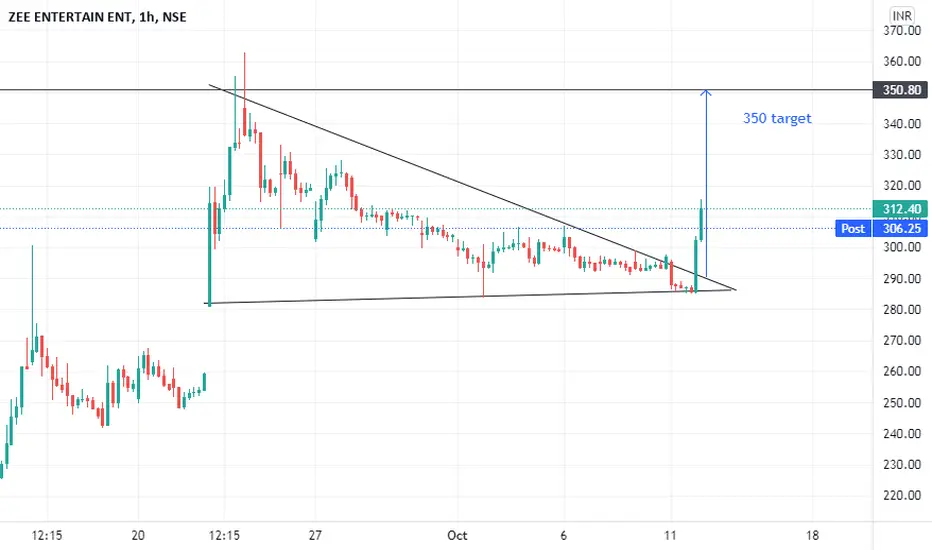
ZEEL TARGET SHORT TERMThe chart has formed a descending triangle and we can expect a short time target of 350.
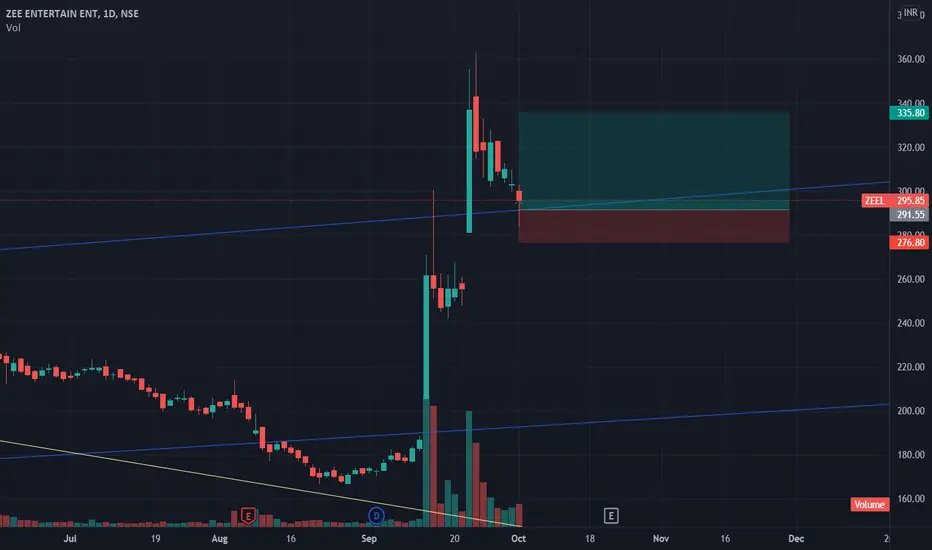
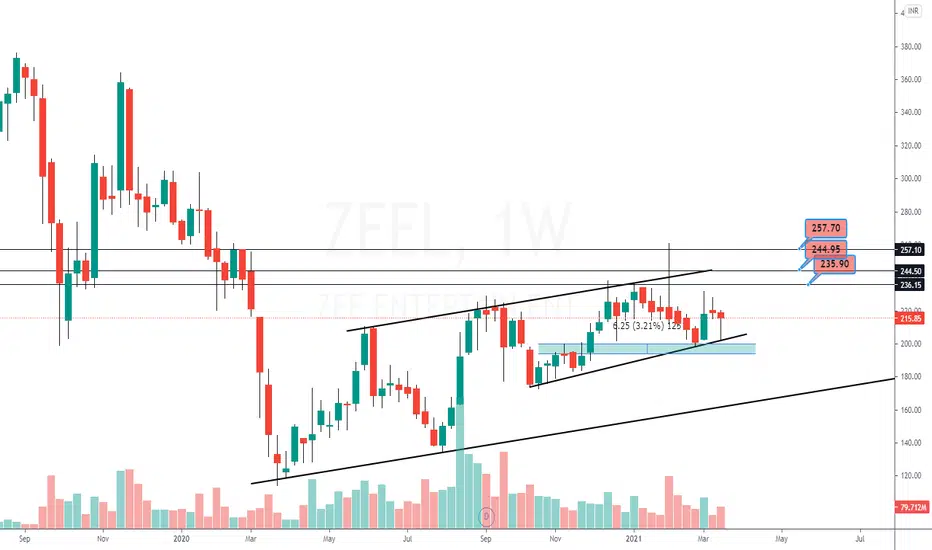
ZEE Breakout and Medium Term InvestmentThe stock has broken out and retested, so it may undergo a rally. Trade is supported by brokerage calls and Supports Nearby.
Risk Reward Ratio - 3:1
SL is placed below support zone & the previously upper trendline. The target is placed based on fundamentals and near swing high.
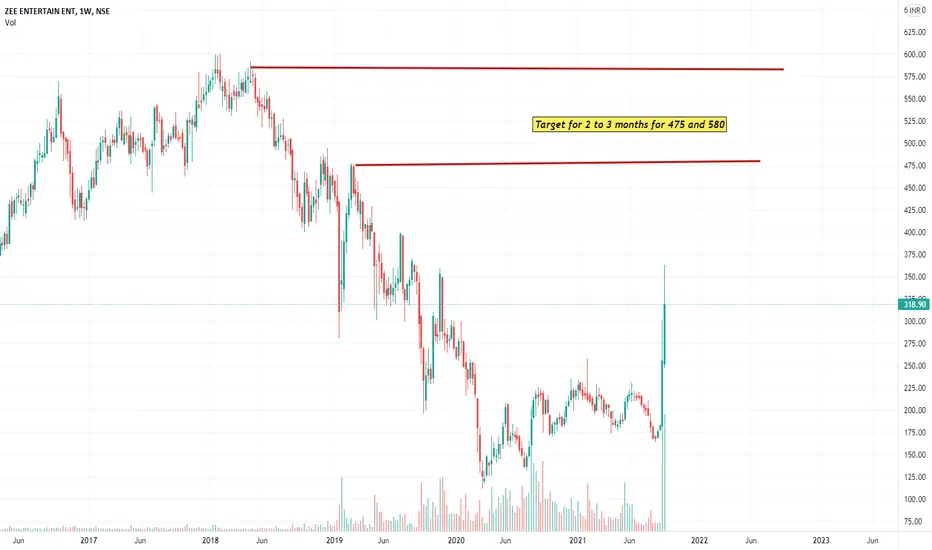
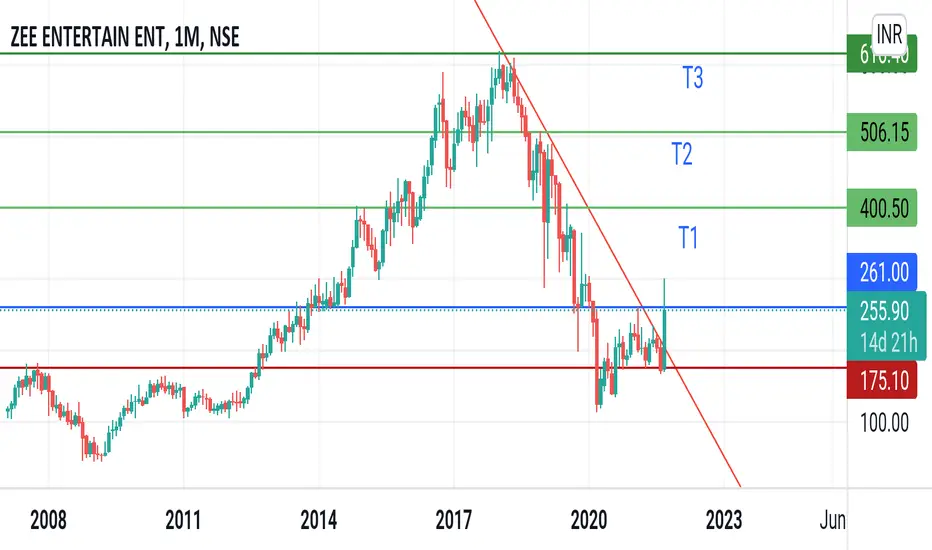
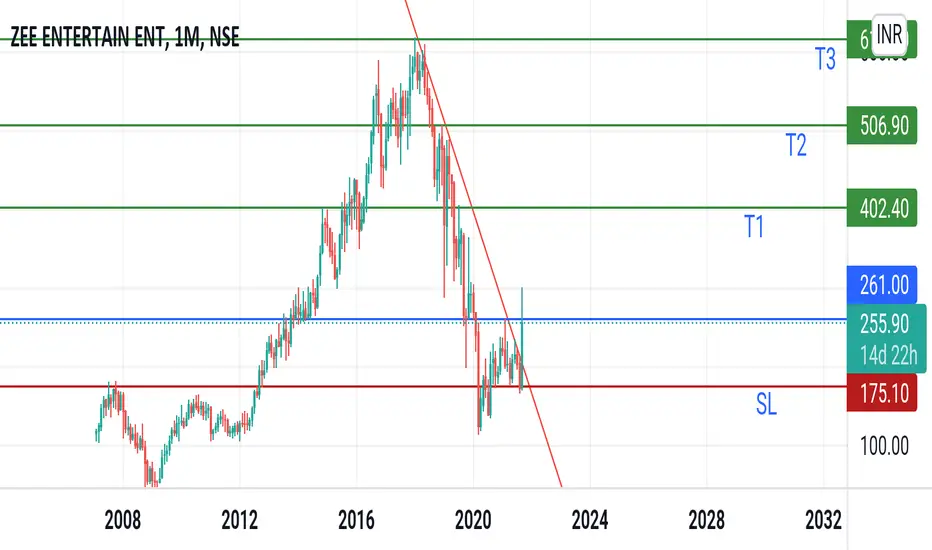
ZEElTarget for 2 to 3 months for 475 and 580
.............................................................
ZEELOpen 322.00
Previous Close 318.20
UC Limit 350.00
LC Limit 286.40
Volume 73,023,126
VWAP 320.65
Mkt Cap (Rs. Cr.) 30,630
20D Avg Volume 51,281,140
20D Avg Delivery 10,477,078
Beta 1.07
Face Value 1
TTM EPS 10.24
TTM PE 31.14
Sector PE 28.04
Book Value Per Share 105.23
P/B 3.04
Dividend Yield 0.78
P/C 24.53
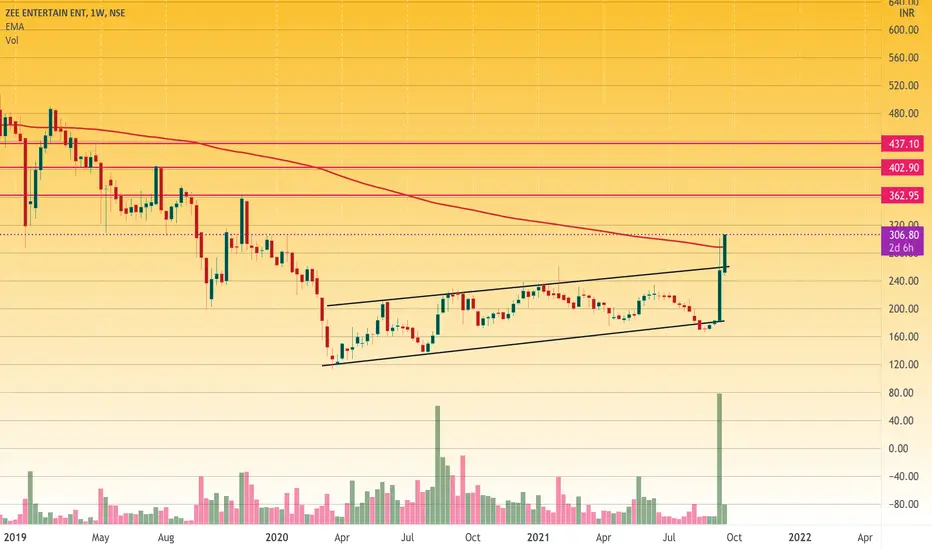
Big Volume breakoutZee has been trading with good volumes since some sessions...BO from channel and most importantly trading ABOVE 200 EMA ( wavy RED line). Anyone following me knows how important 200 EMA is. Targets marked.
Caution - Zee has slid from its highs of 600 Rs to half that value..business is not too good ( compared with say Sun TV)....but one can never know why the market does what it does...right now Zee has got a green signal from market.
Zee ent target 325 to 330Zee entertainment if closed above 275 on daily chart buy for target of 325rs... nearly 15 to 18% returns
ZEEL COMEOUT FROM FALLING TREND LINE RESISTANCEAfter long time fall ZEEL clear break out from falling trend line resistance
ZEEL break out from falling trend line resistanceZEEL GIVEN CLEAR BREAK OUT 19 MONTHS HORIZONTAL RESISTANCE AND LONG TIME FALLING TREND LINE RESISTANCE.target ans stoploss in chart
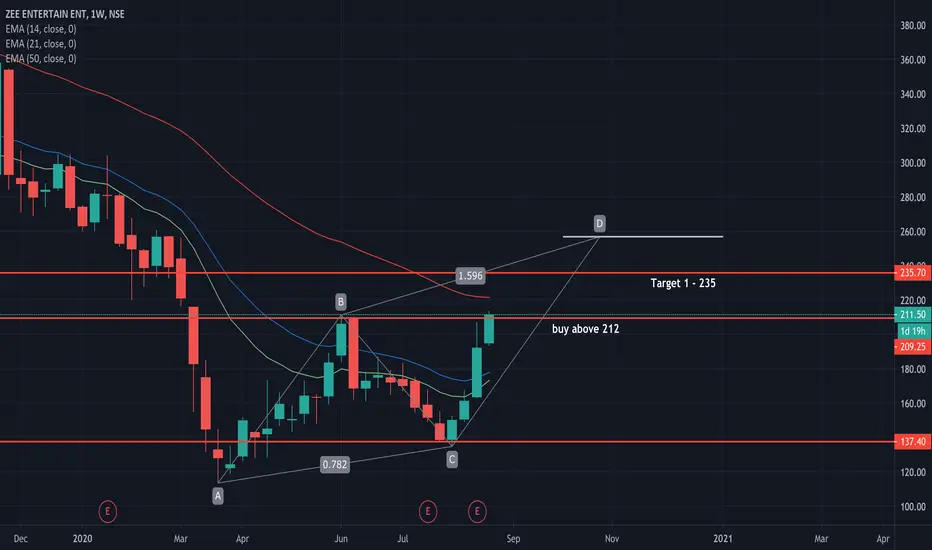
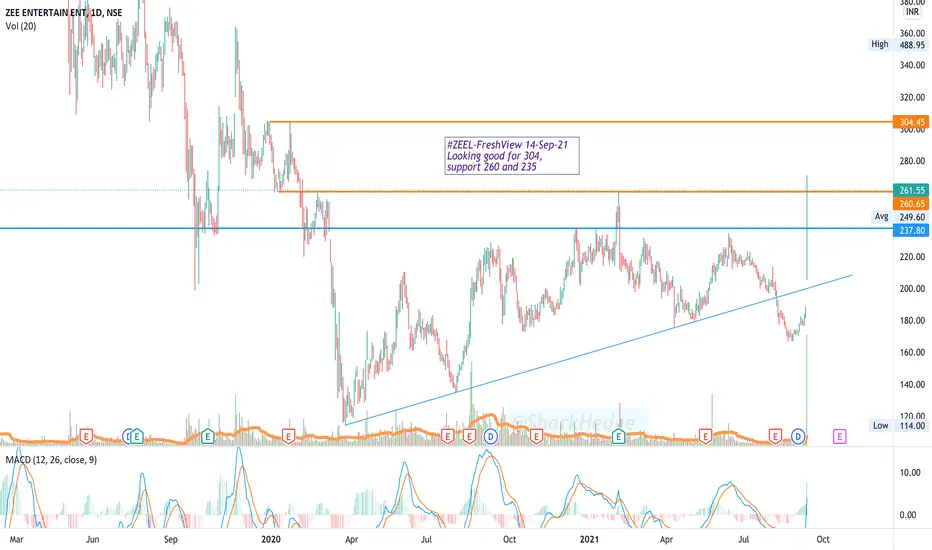
ZEEL entertainment ka baap!!ZEEL technically looking very strong, it can move to 300 plus in no time. Detailed levels given in the idea.
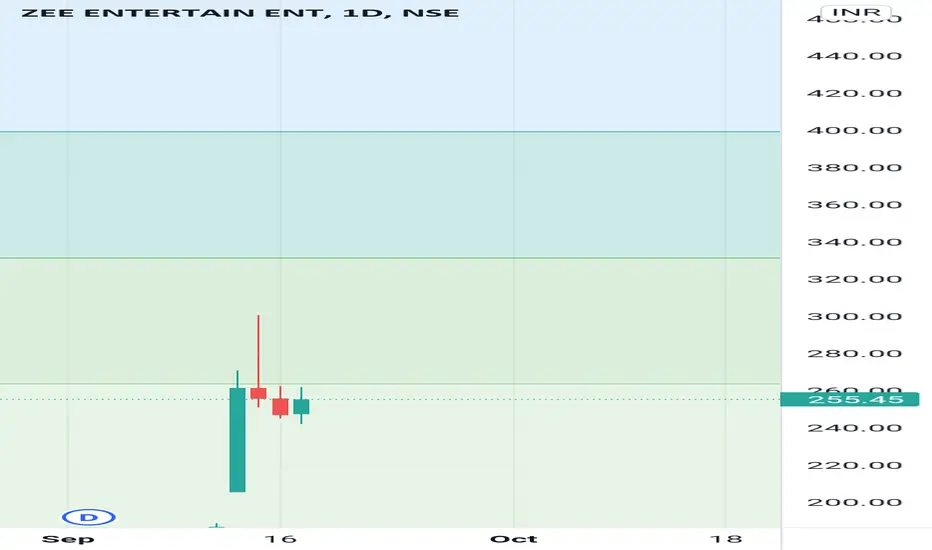
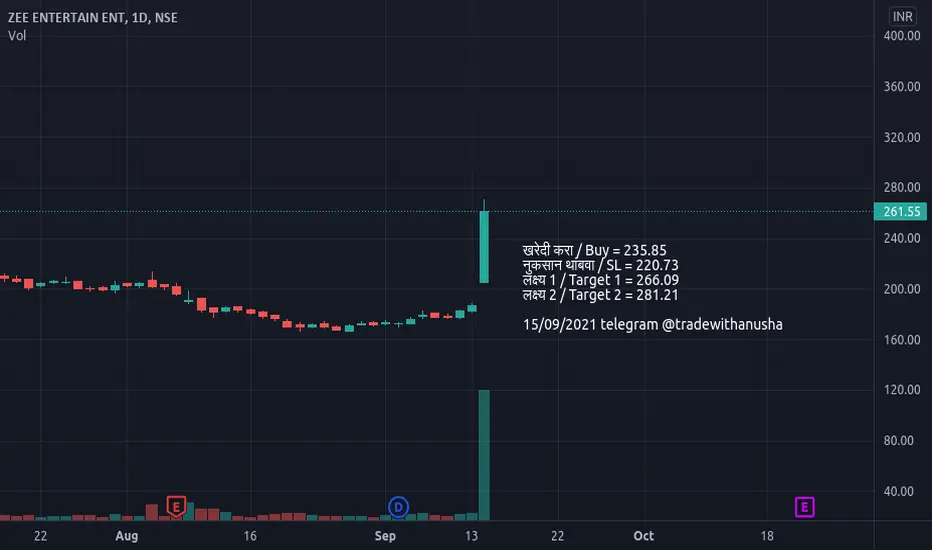
Bullish NSE:ZEELBuy = 235.85
SL = 220.73
Target 1 = 266.09
Target 2 = 281.21
15/09/2021
Bullish NSE:ZEEL-->Zee Entertainment Enterprises Limited Fully Paid Ord. Shrs
Buy for short term
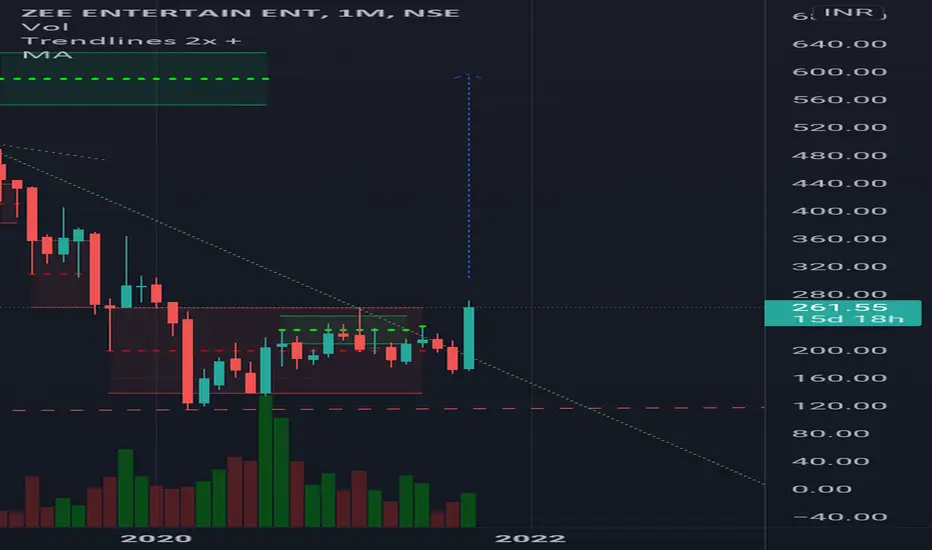
ZEEL Breakout after longtime Zeel breakout after long time on monthly chart ..
1 year trade below this zone 161 and today finally broke with highest volume
Short term target 400++ sl 210 longterm target 600++ time frame 2 to 3 year
Cmp 161 today 40% up
Falling Channel and Demand ZoneStock Analysis: Zeel has taken support from marked demand zone (green area) as long as price is not closing the below the demand zone expected to reach the target given on the chart. Let's see
Happy Investing!
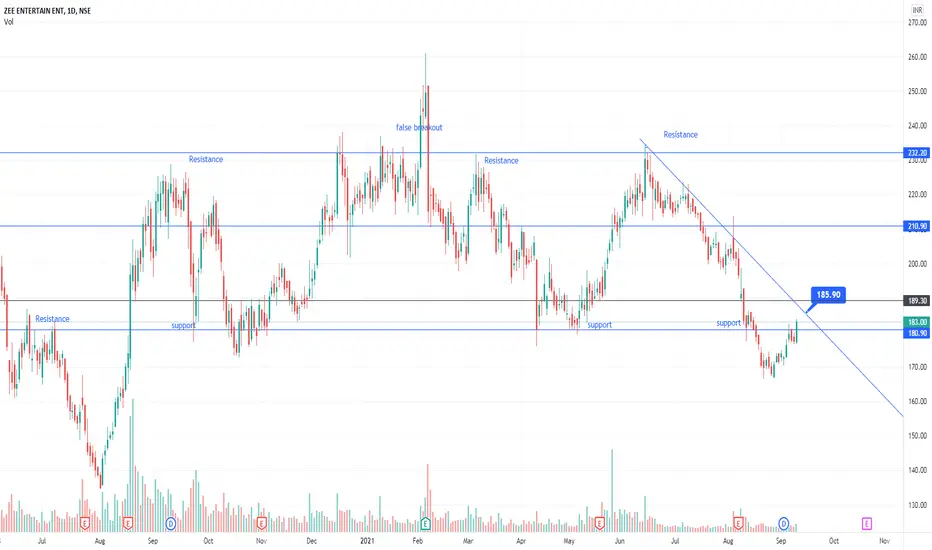
Seems trend line will act as resistance continues bearish tendI am a beginner and trying to analyze the charts , lets see if my prediction goes well or not
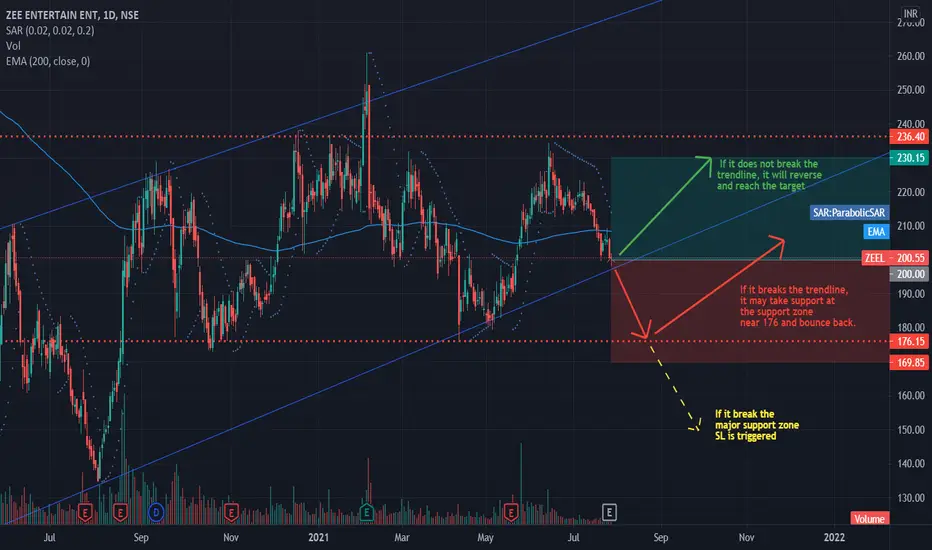
ZEE Entertainment Ltd Short Term ReversalThe stock has reached lower trend line and looks to take support and may undergo a reversal rally. Trade is supported by brokerage calls and Supports Nearby.
SL is placed below major support zone and target is place near swing and channel high.
Note: As the market is under selling pressure, enter only after confirming a reversal
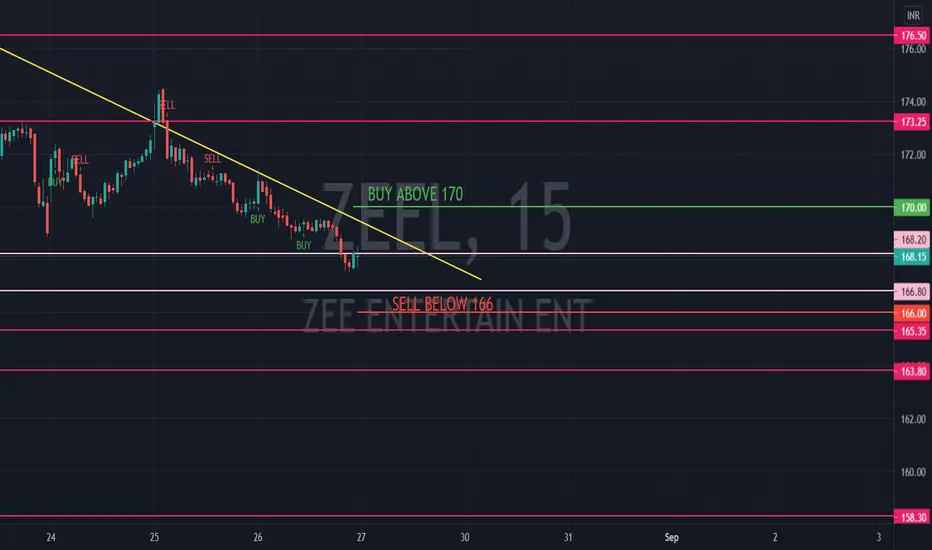
ZeeL for small term holdingStock- ZeeL
Entry price-174,176
Exit 188
It's going bullish for 1 week,
If trend fall I notice you

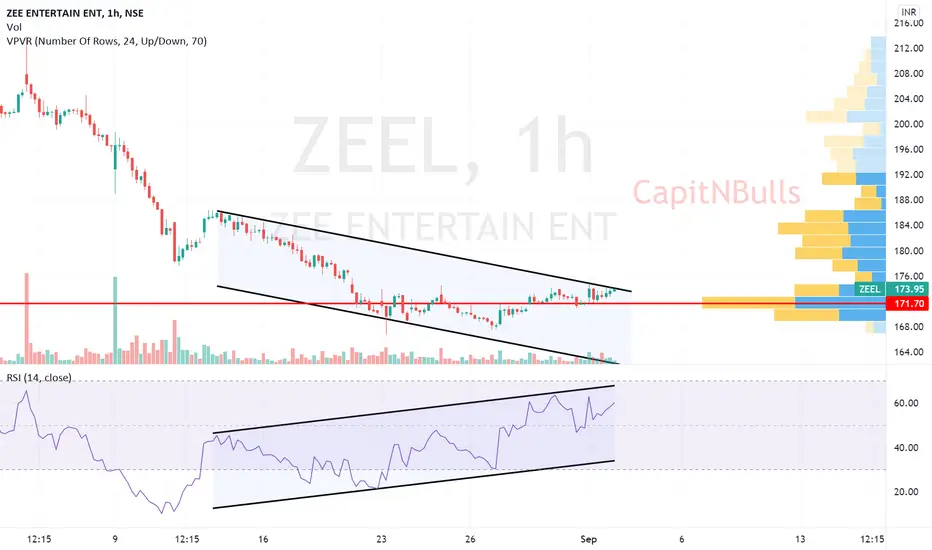
zeel In hourly tf we can see that even though the rice is falling, The RSI has been building up momentem.
Keep zeel in watchlist.
a bottom has been made at 178.
Good risk reward entry