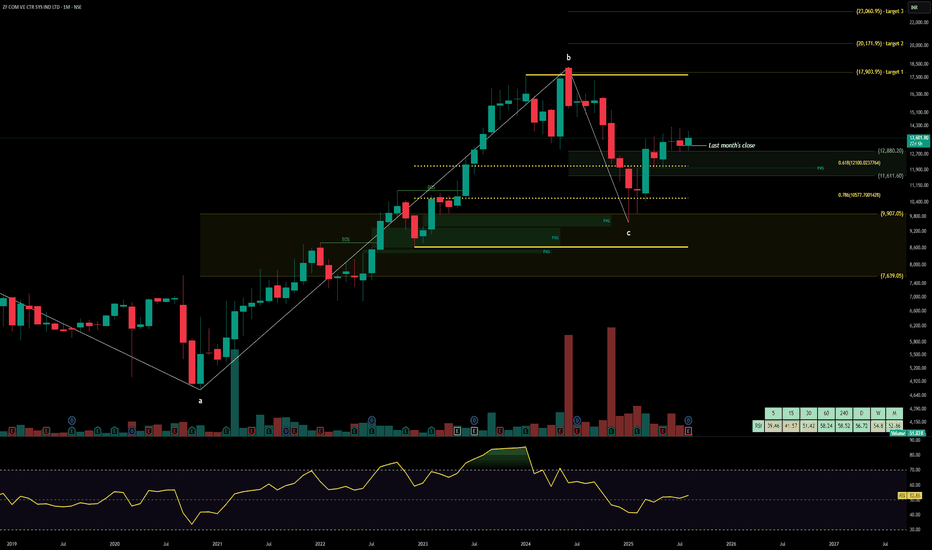
ZFCVINDIAZF Commercial Vehicle Control Systems India Ltd. is a leading manufacturer of advanced braking systems, air suspension modules, and electronic stability control solutions for commercial vehicles. Operating under the ZF WABCO brand, the company serves OEMs across trucks, buses, off-highway vehicles, and defense platforms. With strong R&D capabilities and multiple manufacturing sites, ZFCVINDIA plays a critical role in India’s commercial vehicle safety and automation landscape.
ZFCVINDIA – FY22–FY25 Snapshot
Sales – ₹3,150 Cr → ₹3,780 Cr → ₹4,320 Cr → ₹5,012 Cr Consistent growth driven by OEM demand and product diversification
Net Profit – ₹420 Cr → ₹520 Cr → ₹610 Cr → ₹725 Cr Margin expansion through high-value electronic systems
Operating Performance – Strong → Strong → Strong → Strong Efficiency gains from automation and platform integration
Dividend Yield (%) – 0.12% → 0.14% → 0.15% → 0.16% Modest payouts aligned with reinvestment strategy
Equity Capital – ₹9.00 Cr (constant) Lean capital structure with no dilution
Total Debt – ₹0 Cr (debt-free) Fully equity-financed operations
Fixed Assets – ₹1,120 Cr → ₹1,180 Cr → ₹1,240 Cr → ₹1,310 Cr Capex focused on automation and electronic module expansion
Institutional Interest & Ownership Trends
Promoter holding stands at 75.00%, reflecting strong strategic control. FIIs and DIIs have steadily increased exposure due to the company’s leadership in commercial vehicle safety systems. Delivery volumes indicate long-term accumulation by institutional desks focused on auto-tech and OEM-linked growth.
Business Growth Verdict
ZFCVINDIA continues to scale across braking and automation platforms Margins remain strong due to high-value product mix Debt-free structure enhances financial flexibility Capex supports long-term innovation and OEM integration
Management Con Call
Management emphasized strong demand visibility from OEMs and fleet operators for electronic braking and air suspension systems. New product launches include e-compressors, ESC modules, and electronically controlled air suspension for next-gen CV platforms. Export orders are gaining traction, especially in Southeast Asia and Europe. FY26 outlook includes mid-teen revenue growth and margin consistency, supported by automation, digital diagnostics, and retrofit solutions.
Final Investment Verdict
ZF Commercial Vehicle Control Systems India Ltd. offers a high-quality auto-tech play with strong financials, product leadership, and strategic OEM alignment. Its debt-free status, consistent profitability, and innovation-led growth make it suitable for accumulation by investors seeking exposure to commercial vehicle safety, automation, and electrification themes.
ZFCVINDIA trade ideas
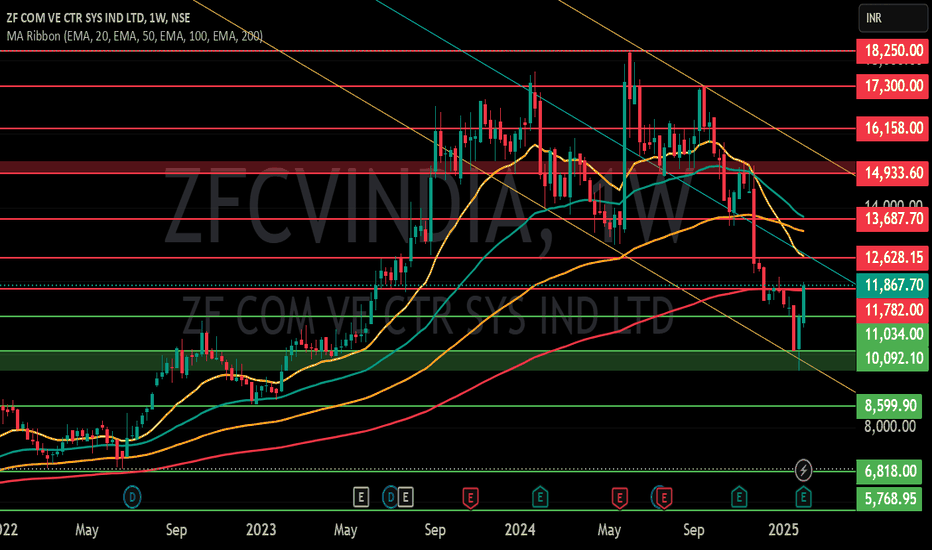
ZF COM VE CTR SYS IND LTD S/RSupport and Resistance Levels:
Support Levels: These are price points (green line/shade) where a downward trend may be halted due to a concentration of buying interest. Imagine them as a safety net where buyers step in, preventing further decline.
Resistance Levels: Conversely, resistance levels (red line/shade) are where upward trends might stall due to increased selling interest. They act like a ceiling where sellers come in to push prices down.
Breakouts:
Bullish Breakout: When the price moves above resistance, it often indicates strong buying interest and the potential for a continued uptrend. Traders may view this as a signal to buy or hold.
Bearish Breakout: When the price falls below support, it can signal strong selling interest and the potential for a continued downtrend. Traders might see this as a cue to sell or avoid buying.
20 EMA (Exponential Moving Average):
Above 20 EMA(50 EMA): If the stock price is above the 20 EMA, it suggests a potential uptrend or bullish momentum.
Below 20 EMA: If the stock price is below the 20 EMA, it indicates a potential downtrend or bearish momentum.
Trendline: A trendline is a straight line drawn on a chart to represent the general direction of a data point set.
Uptrend Line: Drawn by connecting the lows in an upward trend. Indicates that the price is moving higher over time. Acts as a support level, where prices tend to bounce upward.
Downtrend Line: Drawn by connecting the highs in a downward trend. Indicates that the price is moving lower over time. It acts as a resistance level, where prices tend to drop.
Disclaimer:
I am not a SEBI registered. The information provided here is for learning purposes only and should not be interpreted as financial advice. Consider the broader market context and consult with a qualified financial advisor before making investment decisions.
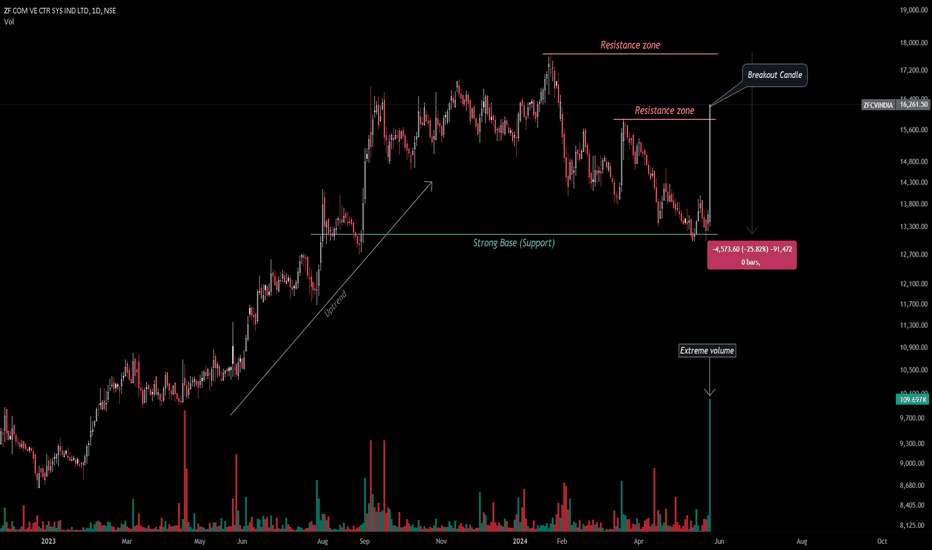
Watchlist Alert for ZFCVINDIAStock Analysis
ZFCVINDIA experienced a significant move today, with a 20% upside.
There were extremely high volume activities, indicating strong interest.
Trading Strategy
Watchlist Addition: Add this stock to your watchlist.
Entry Point: Enter only after a fresh breakout above the 17700 level.
Quality Focus: Although the price is high, focus on the quality of the stock rather than its current price.
Keep an eye on this stock for a potential breakout and future opportunities!


