BANKNIFTYBanknifty levels are based on imbalances
1. gapup 57500 long
2. 57500-56500 trade breakout
3. gapdown 56500 short
BANKNIFTYZ2025 trade ideas

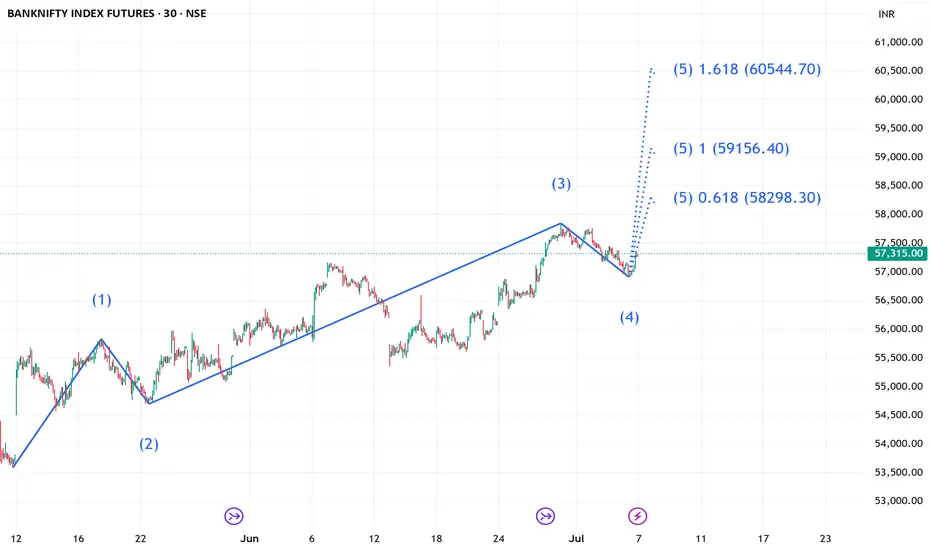
BANKNIFTY LOVERS Ready towards 60000 + ?/ ( SHORT TERM IBANKNIFTY 30 Mins counts indicate a bullish wave structure.
Both appear to be optimistic, and this index invalidation number is 56910 ( 30 Mins closing)
target are already shared as per implus move
Investing in declines is a smart move for long-term players.
Every graphic used to comprehend & LEARN & understand the theory of Elliot waves, Harmonic waves, Gann Theory, and tTme theory
Every chart is for educational purposes.
We have no accountability for profit or loss.
BANKNIFTYBanknifty levels are based on imbalances
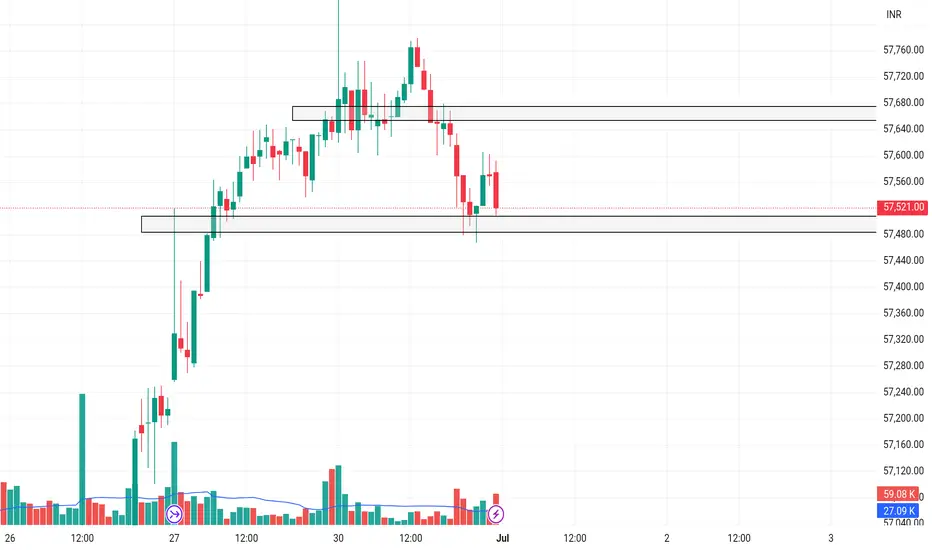
1. gapup 57700 long
2. 57700-57500 trade breakout
3. gapdown 57500 short
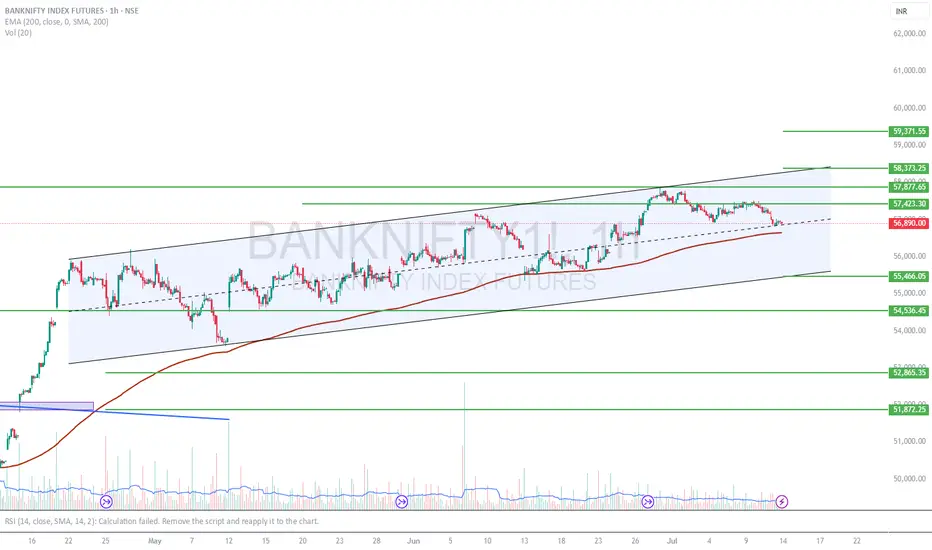
Banknifty Futures 1Hr TFBnf has been taking support from 200ema in Hr TF. trading inside the parallel channel it was near the level of confluence.
good correction after making the new high as well.
can go long if it shows some bullish signs with low risk
analysis it with ur strategy as well
#Banknifty #niftybank
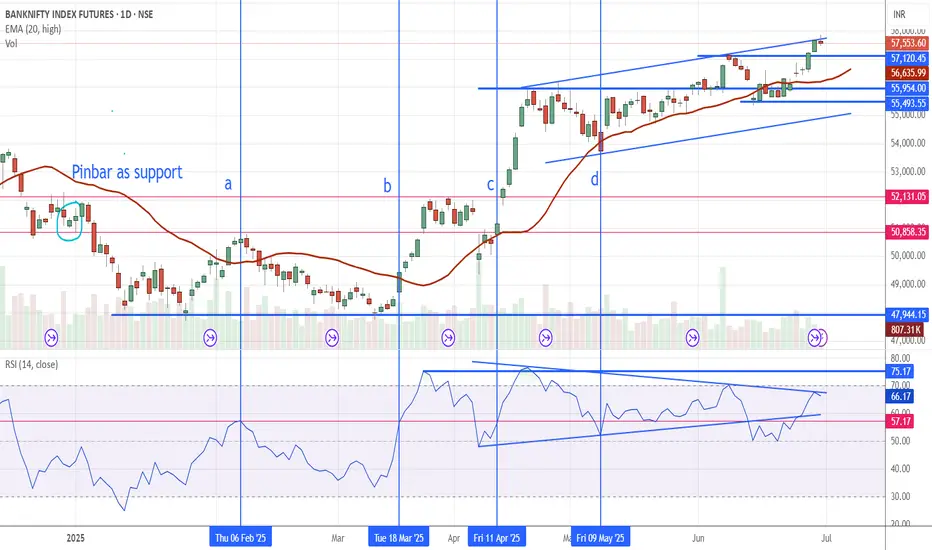
Daily chart of Banknifty for educational purpose only
Required knowledge to understand this chart
Knowledge of Support and Resistance - support when broken can become resistance and vice versa
Using moving average for trend direction
Using moving average for breakout
Using moving average for price retracement or pull back
Knowledge of using RSI - RSI is used as a momentum indicator.
In this chart at vertical line a, the previous support line acted as resistance and momentum fell from there only to find support at the body of the previous low. At vertical line b, the momentum broke out of the previous momentum or RSI high along with price moving above moving average giving a buy signal. The previous pinbars that acted as resistance came into play again between b and c vertical lines and price fell to moving average only to climb back up with momentum also increasing.
Between vertical lines c and d the momentum made a high but failure to stay above the previous momentum or RSI high pressured the price to fall down only to find support at moving average. The week consolidation and negative RSI divergence say the price is weakening. At the fag end of the chart the momentum is sloping down whereas moving average is curving upward gives a mixed signal.
Will the price move above 57850 or fall to 55350, or the price will retrace to moving average makes this chart an interesting watch.
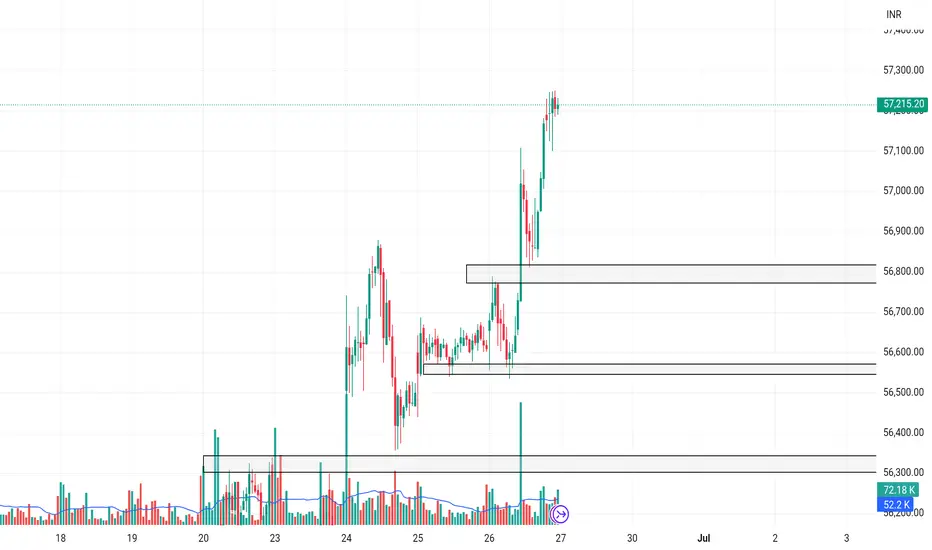
BANKNIFTYBanknifty levels are based on imbalances
1. gapup 57200 wait for retracement for long
q2. 57200-56800 trade breakout
3. gapdown 56800 short
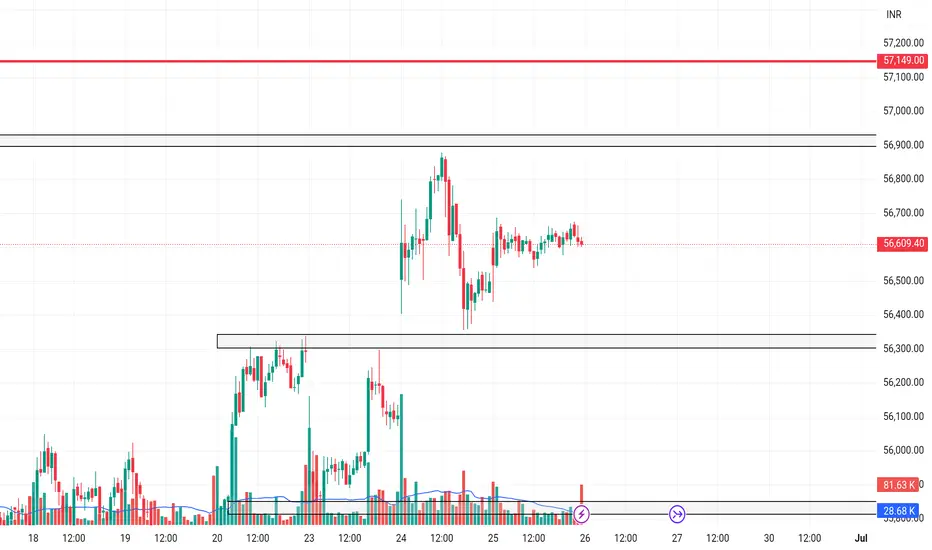
BANKNIFTYBanknifty levels are based on imbalances
1. gapup 56900 long
2. 56900-56300 trade breakoutr
3. gapdown 56300 short
Review and plan for 25th June 2025Nifty future and banknifty future analysis and intraday plan.
This video is for information/education purpose only. you are 100% responsible for any actions you take by reading/viewing this post.
please consult your financial advisor before taking any action.
----Vinaykumar hiremath, CMT

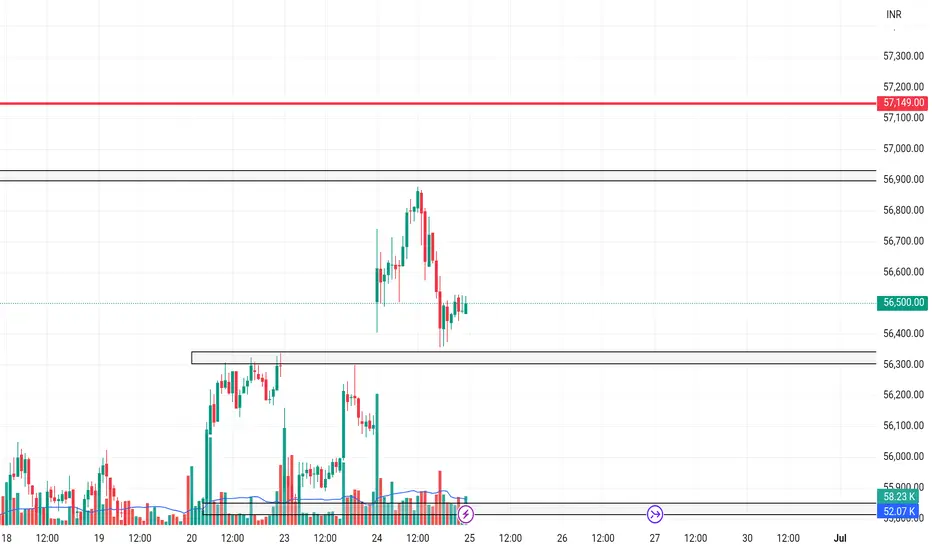
BANKNIFTYBanknifty levels are based oon imbalances
1. gapup 56900 long
2. 56900-56300 trade breakout
3. gapdown 56300 short
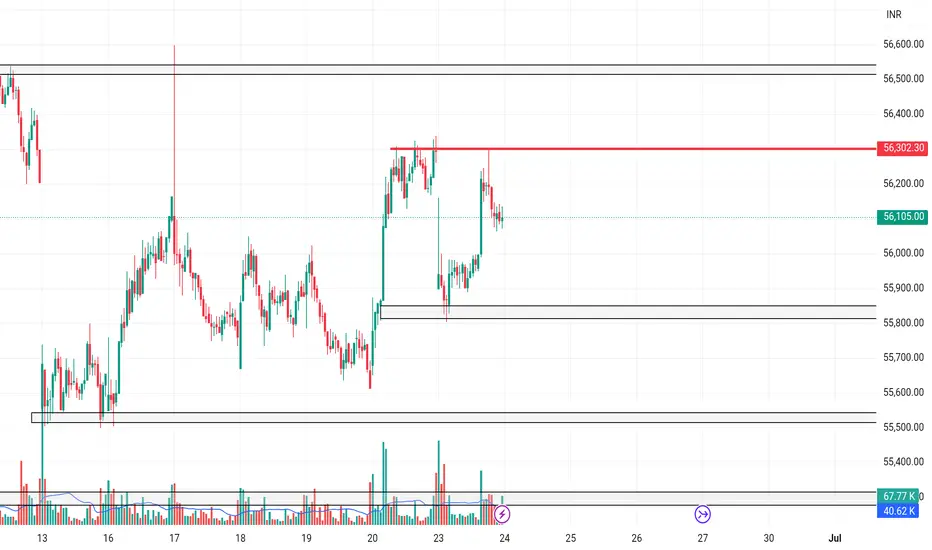
BANKNIFTYBanknifty levels are based on imbalances
1. gapup 56300 long
2. 56300-55800 trade breakout
3. gapdown 55800 short
Review and plan for 24th June 2025Nifty future and banknifty future analysis and intraday plan.
This video is for information/education purpose only. you are 100% responsible for any actions you take by reading/viewing this post.
please consult your financial advisor before taking any action.
----Vinaykumar hiremath, CMT

BANKNIFTYBanknifty levels are based on imbalances
1. gapup 56000 long
2. 5600-55500 trade breakout
3. gapdown 55500 short

BANKNIFTYBanknifty levels are based on imbalances
1. gapup 56000 long
2. 56000-55600 trade breakout
3. gapdown 55600 short

BANKNIFTYBanknifty levels are based on imbalances
1. gapup 55900 long
2. 55900-55600 trade breakout
3. gapdown 55600 short
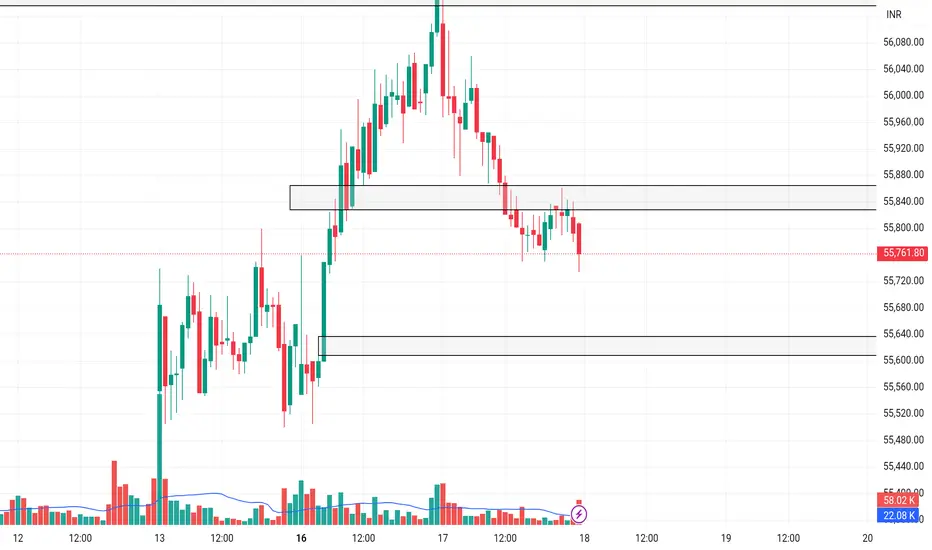
BANKNIFTYBanknifty levels are based on imbalances
1. gapup 56200 long
2. 56200-55900 trade breakout
3. gapdown 55900 short

Review and plan for 13th June 2025Nifty future and banknifty future analysis and intraday plan.
This video is for information/education purpose only. you are 100% responsible for any actions you take by reading/viewing this post.
please consult your financial advisor before taking any action.
----Vinaykumar hiremath, CMT

BANKNIFTYBanknifty levels are based on imbalances
1. gapup 56500 long
2. 56500-56100 trade breakout
3. gapdown 56100 short
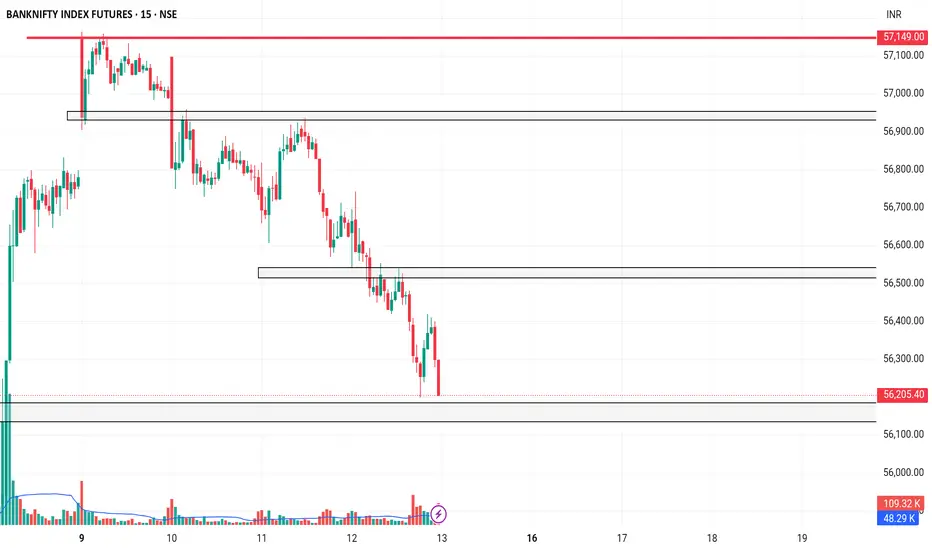
BANKNIFTYBanknifty levels are based on imbalances
1. gapup 57150 long
2. 57150-56900 trade breakout
3. gapdown 56900 short

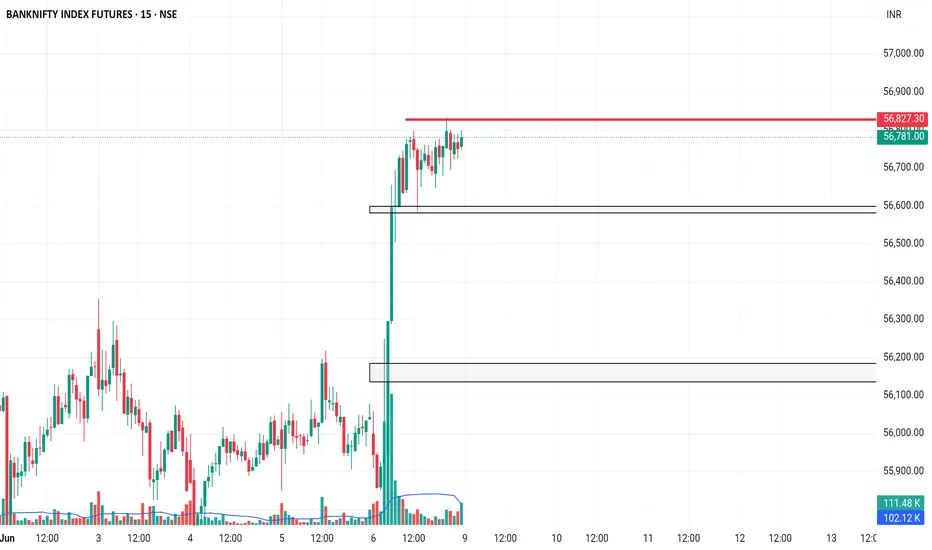
BANKNIFTYBanknifty levels are based on imbalances
1. gapup 56800 long
2. 56800-56600 trade breakout
3. gapdown 56600 short
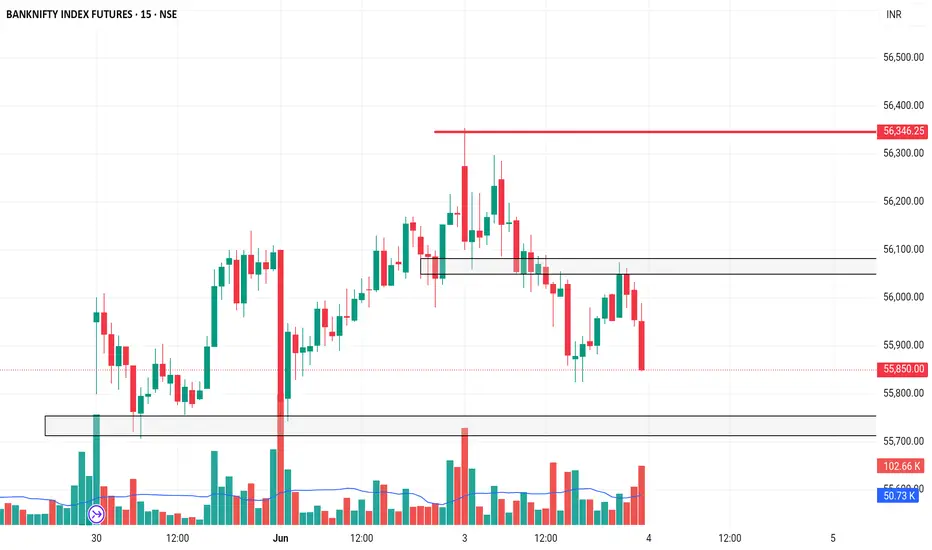
BANKNIFTYBanknifty levels are based on imbalances
1. gapup 56350 long
2. 56350-55700 trade breakout
3. gapdoown 55700 short
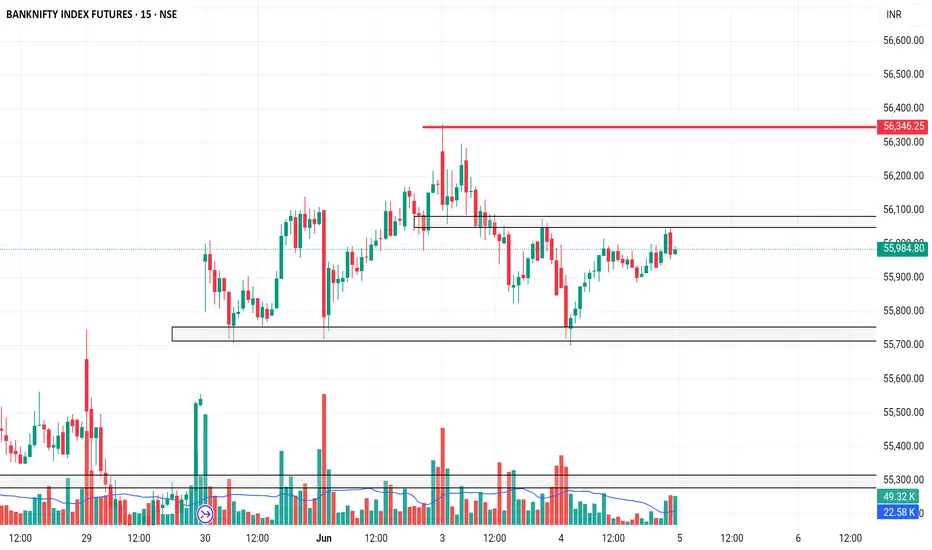
BANKNIFTYBanknifty levels are based on imbalances
1. gapup 56100 long
2. 56100-55700 trade breakout
3. gapdown 55700 short
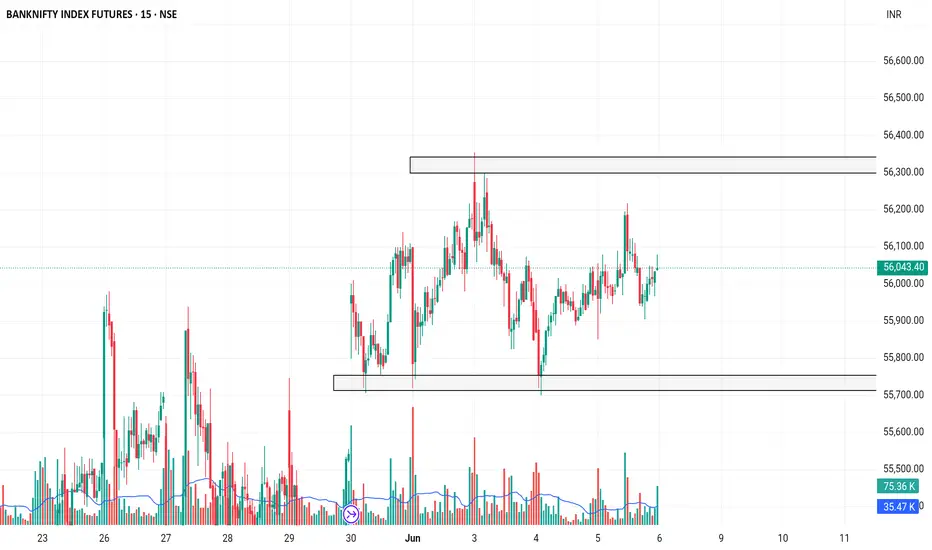
BANKNIFTYBanknifty levels are based on imbalances
1. gapup 56100 long
2. 56100- 55700 trade breamkout
3. gapdown 55700 short
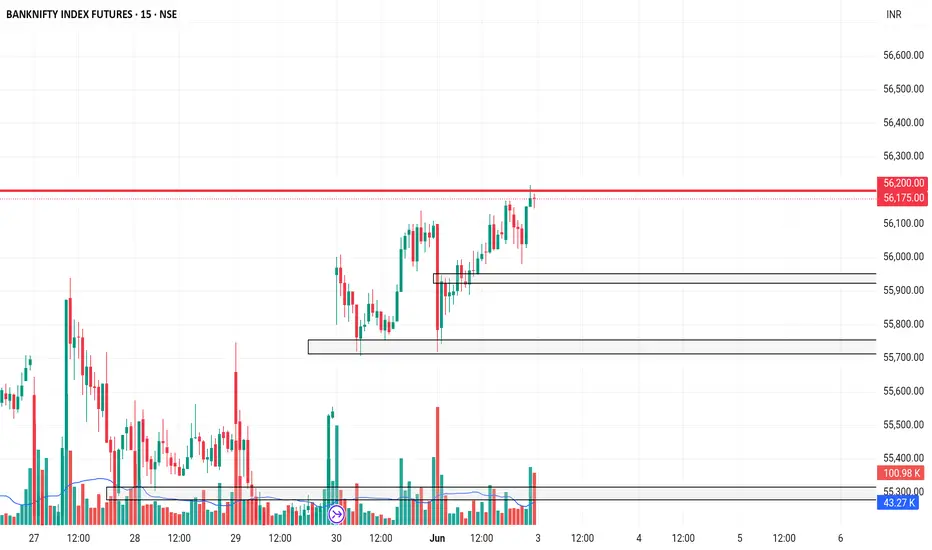
BANKNIFTYBanknifty levels are based on imbalances
1. gapup 56200 long
2. 56200-55900 trade breakout
3. gapdown 55900 short