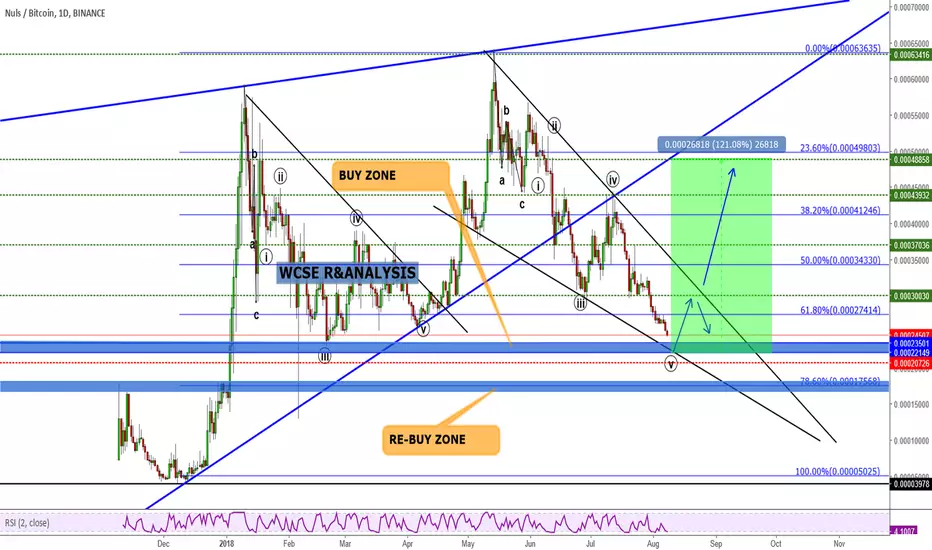
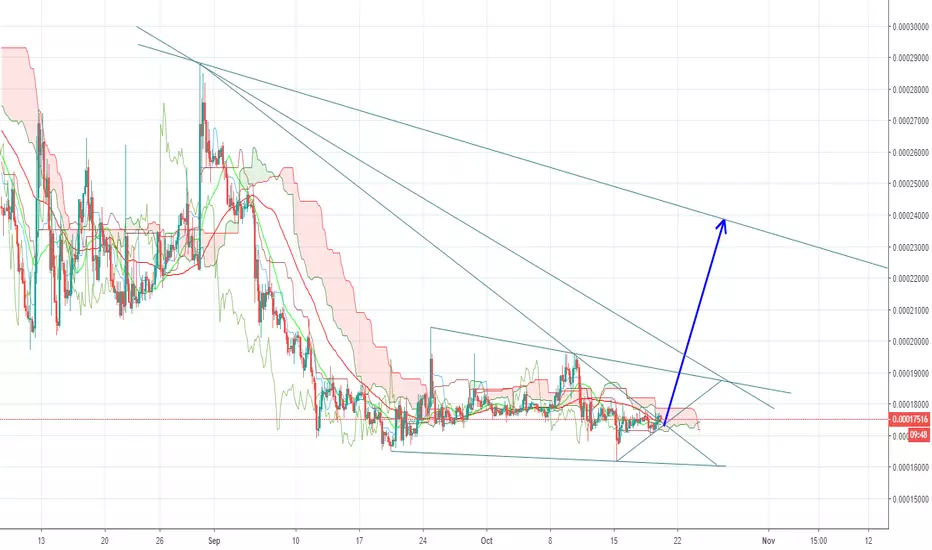
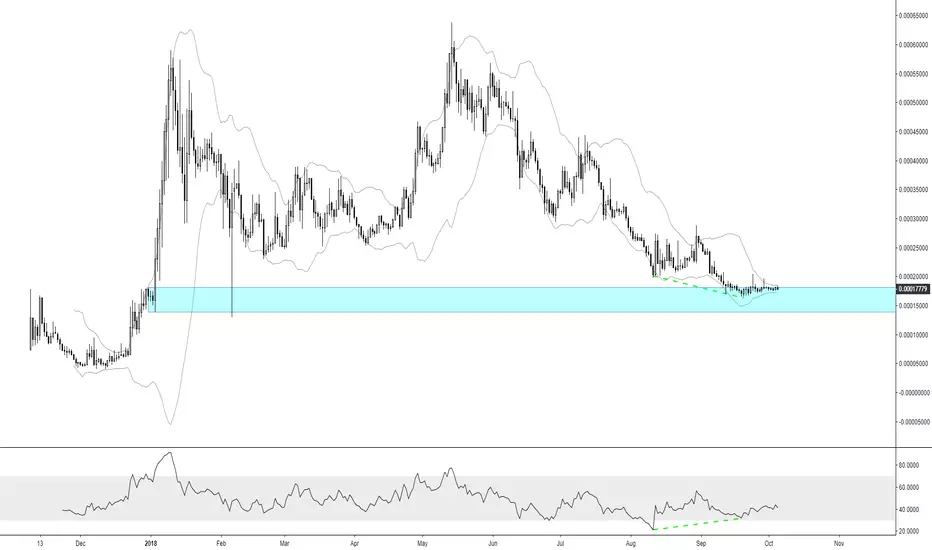
NULS in the case of a global positive will bring a good result.#NULS 1d
In the event of a positive global market, NULS can demonstrate a good result for long-term investments. The asset has made a long correction path and is now testing a possible "bottom". Correctional rollback was -82%, which is more than enough; a downward wedge has also been formed, the breakdown of the upper face of which, as a rule, leads to subsequent growth; long-term MACD looks good and indicates the possibility of further growth; The Stoch RSI is very bullish, and the RSI is extremely oversold and ready to bounce. In the case of a positive on the global market, one of the scenarios might look like this: the price will jump up and break the upper edge of the wedge, after which there will be a regular rollback with testing this edge already as a support and if it withstands the pressure, you can expect further growth if the edge (already in the role of support after the breakdown) does not hold the price, then we will follow to the lower edge, in the case of the breakdown of which (and the support area around 0.00010000), the NULS can continue to follow the downward trend, canceling the positive scenario. Be careful, follow the active and consider all possible market behavior.
NULSBTC trade ideas
NULS/BTC Looking Very Neutral; Nothing InterestingBelow, is a full, in-depth dissection of NULS/BTC.
In the chart above, we can see NULS/BTC on the H4 chart.
From what we’re seeing above, it appears that the price is resting at a firm support point. We’ve identified four different times where that support point has been successfully tested above.
However, it is worth noting that the last test of the support point did not yield as amazing of results as the previous two tests:
Zerononcense Bands for NULS/BTC
The price is outside the bottom of the ZN Bands (trades just like the Bollingers’; custom indicator). So, there could be a slight bounce due to that.
Relative Strength Index(14) for NULS/BTC
RSI(14) for NULS/BTC isn’t really looking that promising though. Steady downtrend over the last few periods on the H4.
Let’s see what the RSI(14) shows us on the daily, instead.
Again, nothing to write home about.
Conclusion
NULS/BTC is a pass for the moment (in terms of entering a position) in our books. We have concrete or definitive ideas for NULS for the time being.
So, as of right now, this will be put in the ‘wait and monitor’ category. If there is anything interesting that comes out of NULS/BTC, then we’ll be sure to note that ASAP.

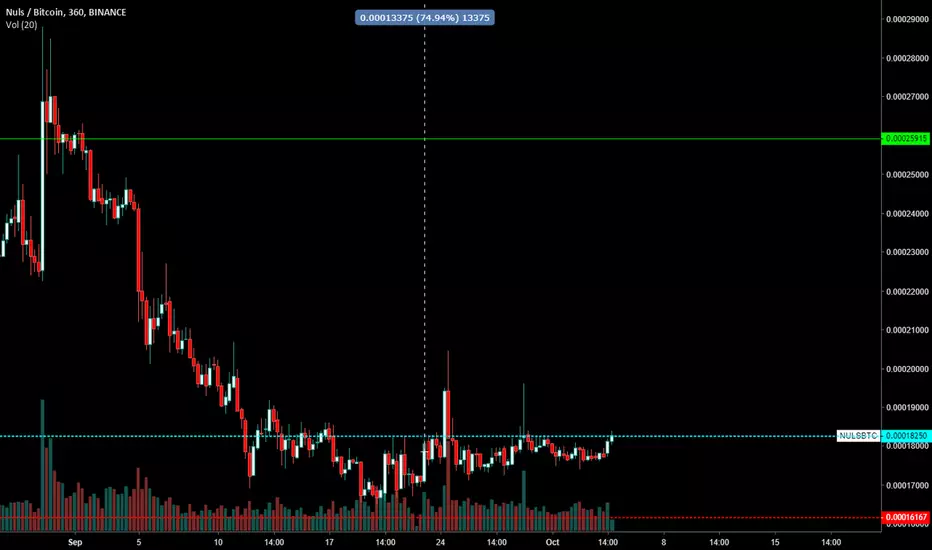
NULS - Wait to AccumulateGive it a couple weeks and wait for a stop loss hunt.
Set buys around 0.000165 and 0.000162.
Below 0.00161 we're a goner.

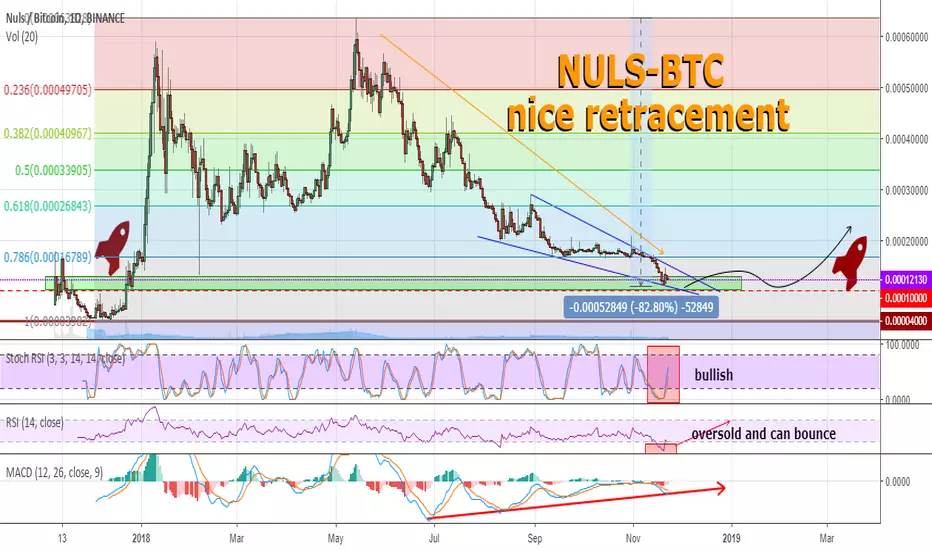
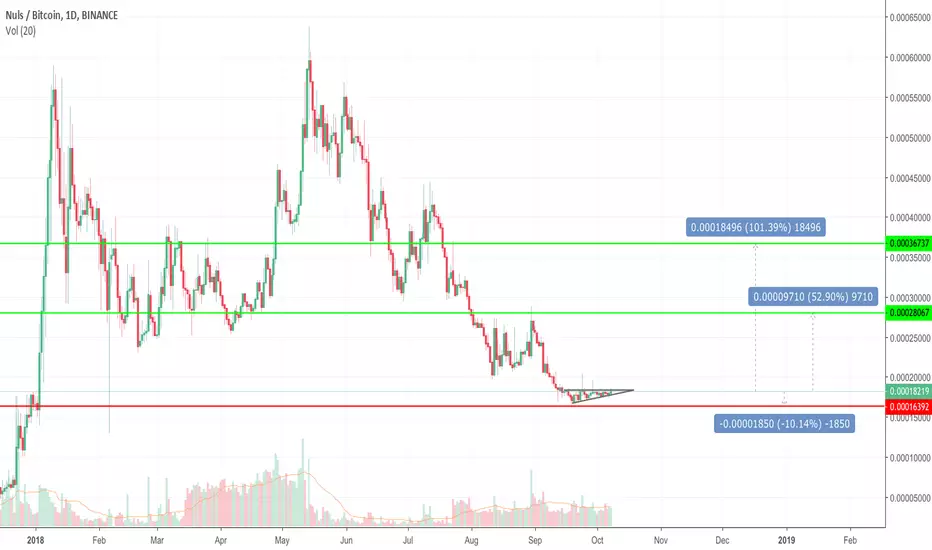
NULS look good#NULS 1d
Good levels to consider long-term investment opportunities. The current price range corresponds to the resistance of 2017, but at the moment it is a strong support. As you can see, the market fell for a long time, following a downtrend and forming a falling wedge, but approaching support levels went sideways. Stoch RSI looks good and shows a bullish mood, RSI and MACD have been following an uptrend for a long time, which is a good sign for the future movement of this market. We recommend to pay attention to the Nuls, the coin can bring about + 100% profit in the long term.

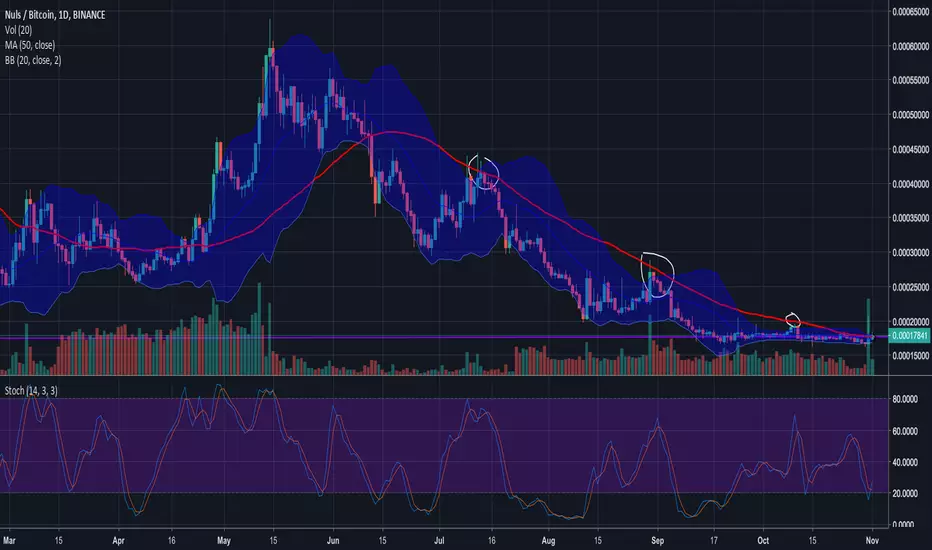
NULS/BTC - Long• Largest volume uptick we’ve seen since May, not much price movement, looks like accumulation at support
• Bullish divergence on stochastics
• Has been abiding by its 50-Day MA very nicely, has tried to break above 3 times now
o A daily close above 50 MA would be the first since May
• Strong support at 16500 level, high R/R for entry here at 18000 (risk under 10%)

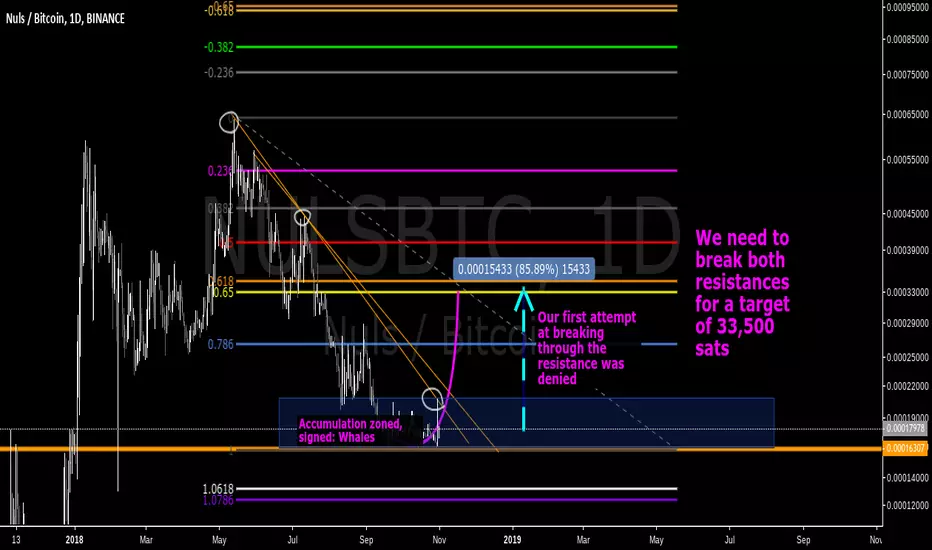
NULS Correction TimeNULSBTC has been in correction zone territory for a while. A rise to 35,500 sats looks very possible, have a tight stop loss of 5% and as always, I wish you good luck on your trading.
-Trader A
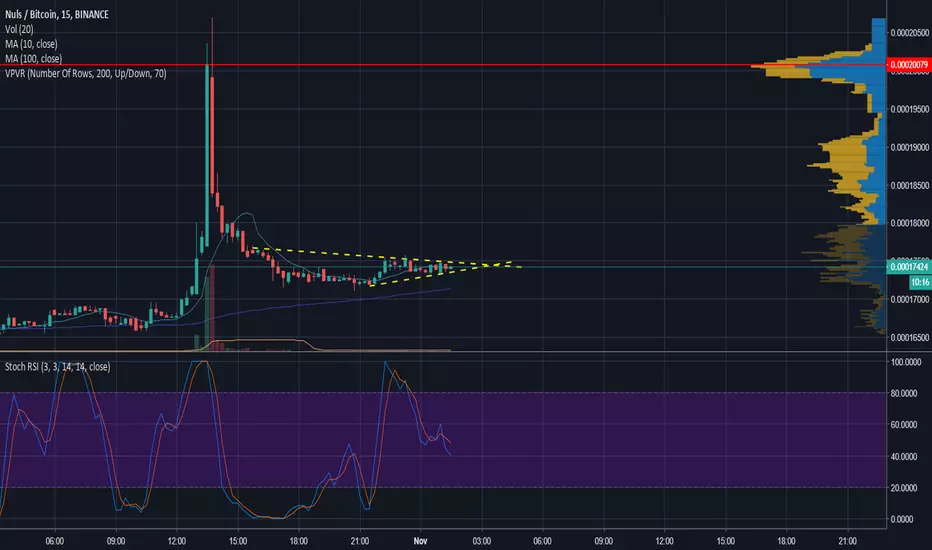

$NULS, 15 min In A Different Time Zone…
Weekly
Looking at our trend timeframe we see price continuing to respect our downtrend with no signs of reversal. Stochastic RSI showing momentum is in favor of bears, will watch smaller timeframe for entry. Last time we were at this price we saw a sell off from 17000 to 5000.
Daily
Shifting over to our pattern timeframe we see price has formed a lower high at 18000, and is now looking to form a lower low. Stochastic RSI showing momentum is in favor of bears with no signs of reversal. A daily bearish engulfing leads us to a sell off towards our 5000 support. Psychological support at 15000, a daily close above 17000 activates our trade.

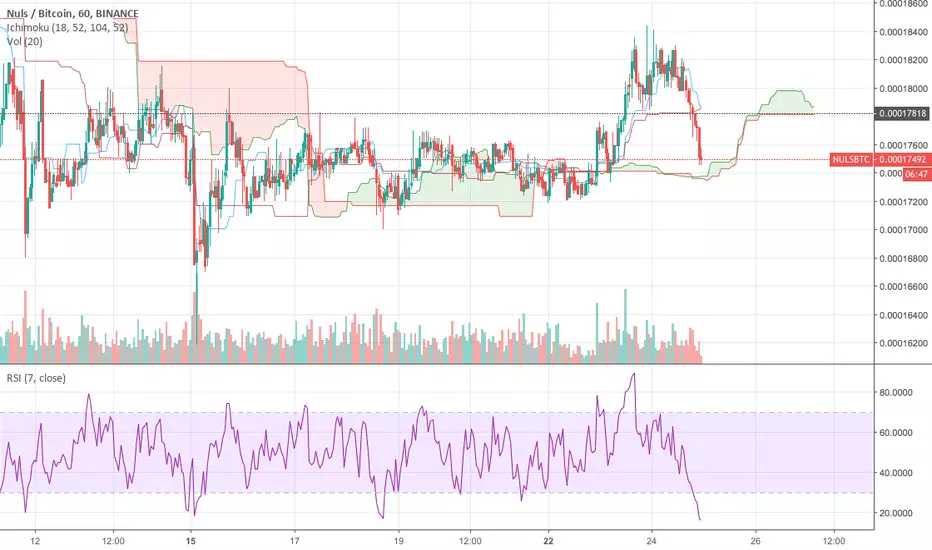
Trend Reversal Gauged with RSI and IchimokuThe market has come down hard for the past weeks and has finally settled and started showing evidence of a trend reversal. As the price action finds support on the 1 hour timeframe from the ichimoku cloud.
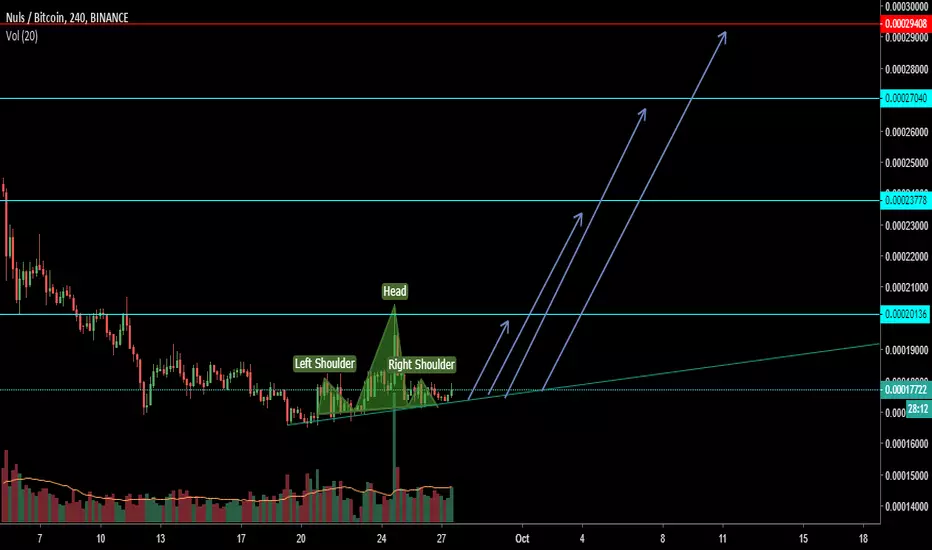
Nuls breakout legIf Nuls bull force is strong enough to make the 3rd leg into breakout, we'll gotta nice time

NULSBTC Potential Buy OpportunityPossible Entry and exit targets are clearly stated on the chart.
BLUE: POSSIBLE ENTRY ZONE
RED: STOP LOSS LEVEL
GREEN: SELL TARGETS
Join our discussion room for more about our trading signals.
Please do click on like icon and share our idea.
Thanks.
Note:
It will be good to always understand risk involve in trading. Always trade with stop Loss in place.
Set up an entry/exit strategy for every trade, with good risk/reward ratio.
Nuls maintaining support for almost a month with low volatilityWatching out this trade. Last time it trading in a range, it broke downward. let see what happens this time with an ascending triangle :D
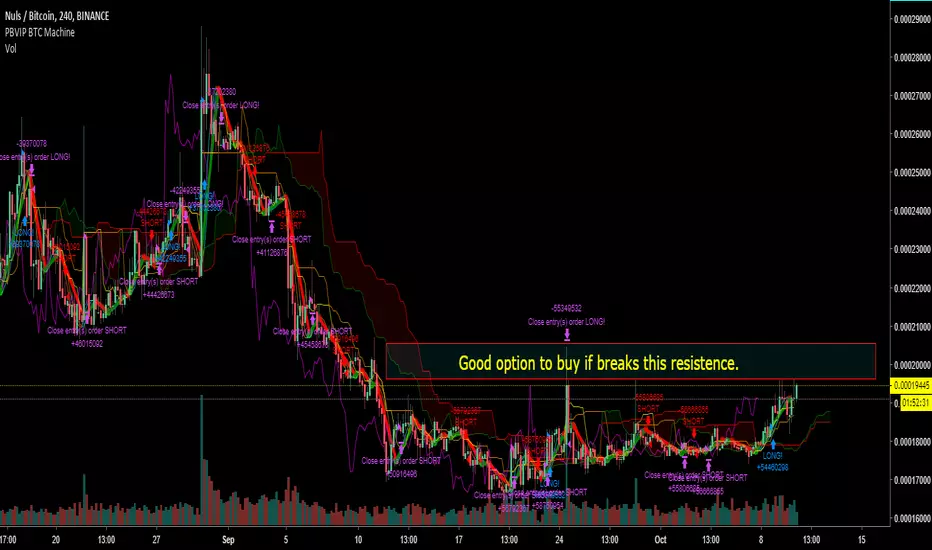
Nuls getting ready to signalThis is not an entry yet. We need resistence break candle confirmation before join the bull pressure.
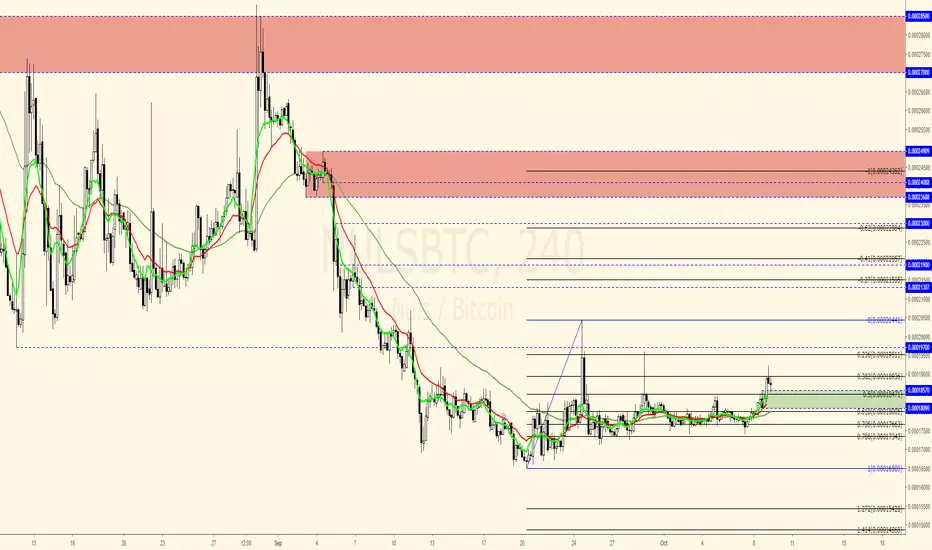
NULS/BTCI'd like to see this 18570 level hold as support and reach for the Fib and price action based targets.
NULS/BTC SPOT BUY SLOT
Currently above Demand zone EQ
Bollinger bands tight (Price above median MA) // Due for volatility favouring upside
Month long bullish divergence on RSI
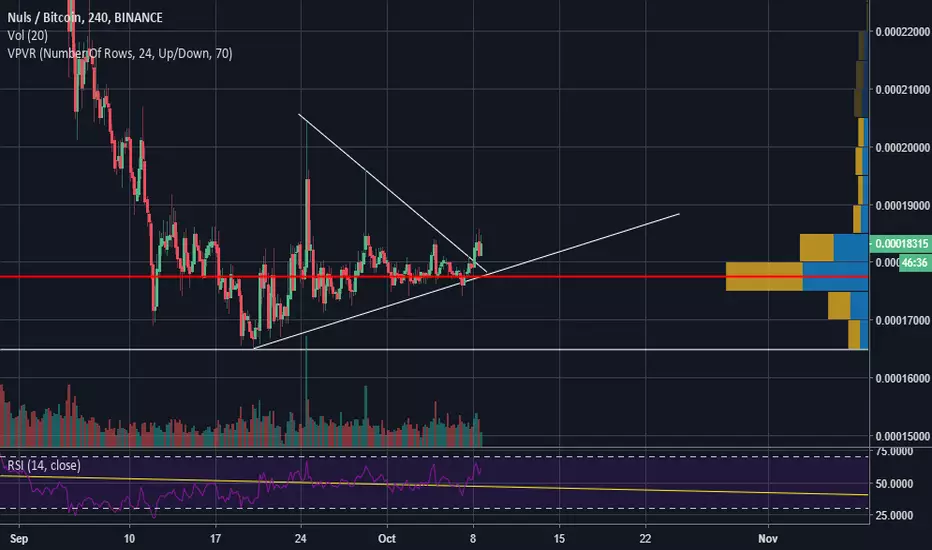
NULS/BTCRisk : High
Coin: NULS/BTC
Exchange: Binance
Entry Zone: 0.000178 or 0.000185
Target 1 : 0.00020 (11%)
Target 2 : 0.000216 (20%)
Target 3 : 0.000236 (31%)
Stop Loss: 0.000165 (10%)
Comment :
Symetrical triangle pattern
Strong support and consolidation
$NULS / $BTC-MACD Cross
-Slight bull div
-Painting morning star on 4HR
Wait for a break of 18352 as confirmation!

$NULS Trying to Break 141 Days Downtrend. It's on the Edge!40 mills on the current circulating supply with $46 mils market cap, NULS ranked #113 on coinmarketcap.com. I know it's not really famous token but consider the image, it's quite nice as it seems like trying to break the downtrend little bit early, the price spiking once or two with 12-15% upward movement.
Right now it really looks like sitting on good support zone, but let's see due to BTC price volatility we might should consider to draw the second green box below with 4654 - 7311 sats as the latest support. It's very unlikely. I think that only thing that can do that are internal problems like team involved fraud, exit scam or something or due to Bitcoin price volatility. Otherwise, we won't see that coming, we might go sideway or upward.
My support zone at the moment is from 14k - 17k. This is looks good for accumulation. Even tho this token is not leaving quite big room to grow, only less than 3x, but you should consider it. Only perfect timing will fortune you holding this one, but it's quite heavy to bring up the price (:
Trade safe!