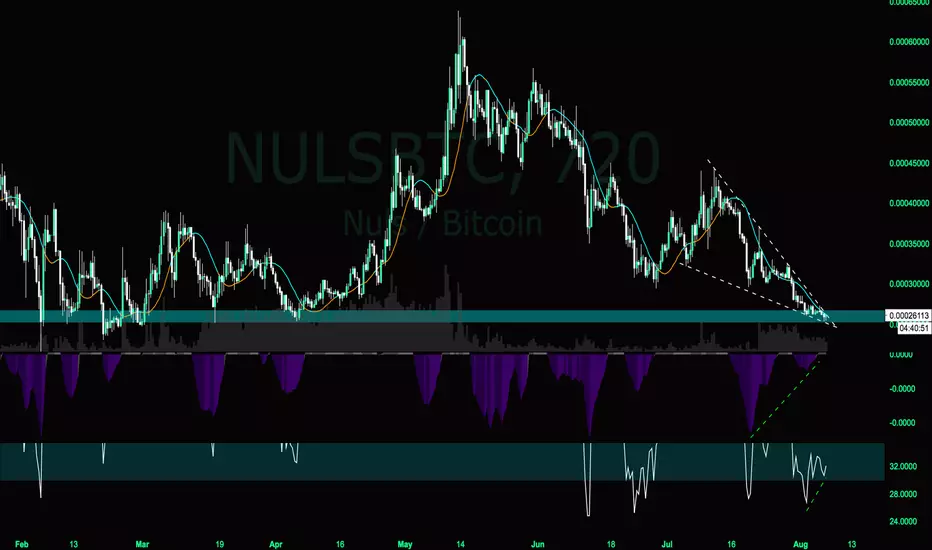
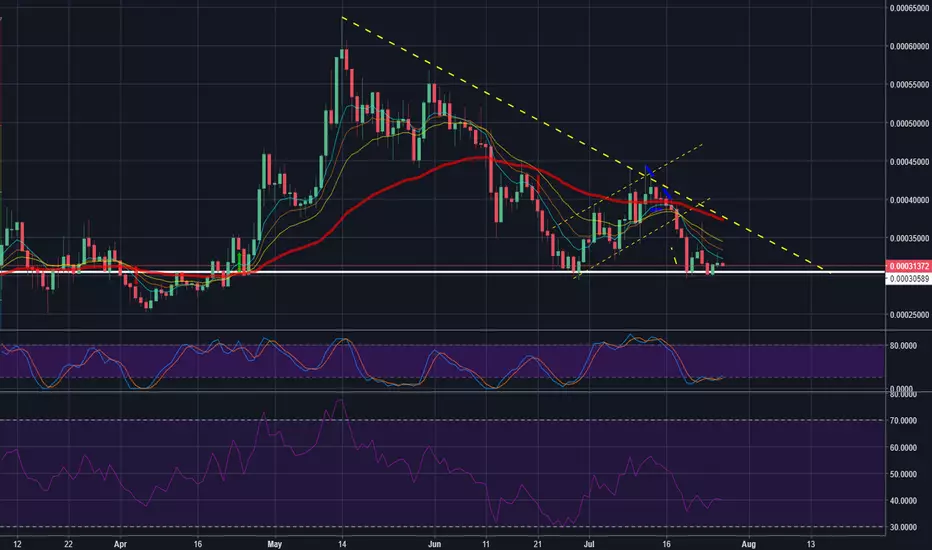
Nuls looks ready to goBullish divergence
Falling wedge
Right above confluence zone of previous support
I would not be surprised to see a lot of stop losses line up right under 0.000255, and a some whales use them as liquidity before nuls can break up higher, therefore I'll wait for more confirmation before entering a position on nuls.
NULSBTC trade ideas
NULSMid-term deal
Two floors are configured on an ascending lower trend line
Buy from current prices
Sale in stages starts from
0.00033600 BTC
0.00037000 BTC
0.00041000 BTC
Stop loss at 0.00029000 BTC
Expected Profit Ratio 30%

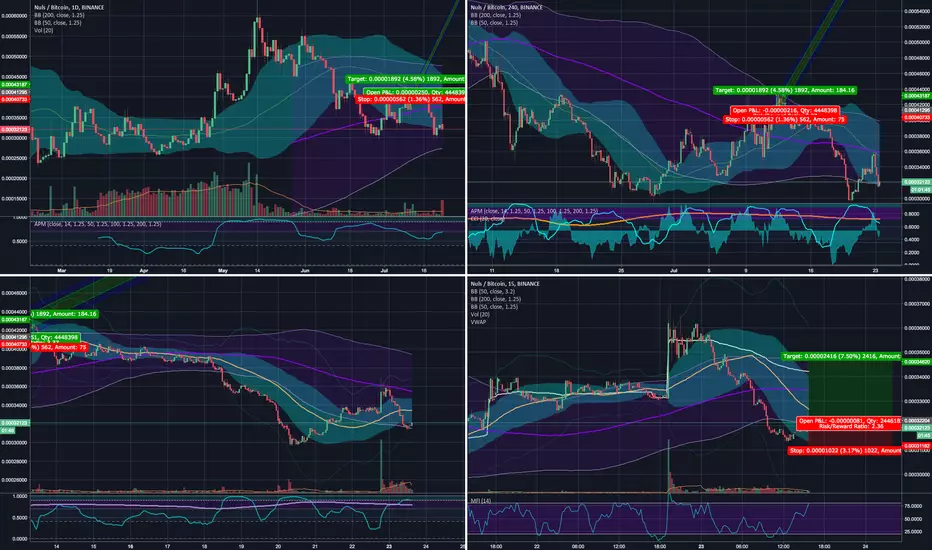
NULS Weekly Analysis 7/30/2018Welcome! I've been learning/practing technical analysis for awhile now and have recently learned a lot about price action. I plan to publish my thoughts at least once a week. My goal is to practice, improve, learn and hopefully share some knowledge with the community. Please feel free to challenge and question me (respectfully). This is also not financial advice in anyway and is meant for entertainment. PSA: Don't look for advice from random people online!
Unfortunately, not much has changed for NULS since last week.
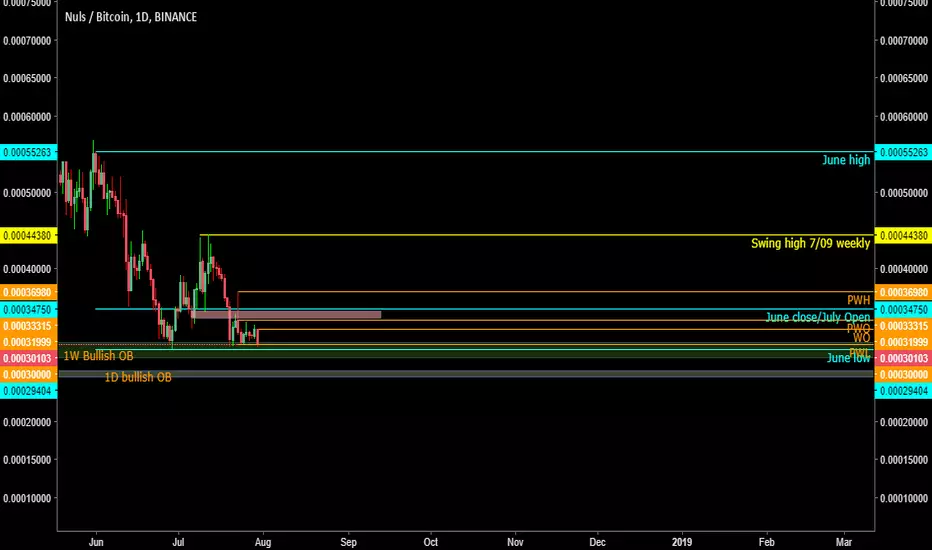
Daily chart:
NULS is still above the June low and holding above the EQ of the 1W bullish order block. This area has provided support for sometime and this is the 2nd time NULS has found support here. NULS has made some lower highs recently and volatility seems to be lower. You can see the candlebars are getting a little tighter recently so perhaps a move is coming one way or another. Below the current levels there is some support but I think breaking down much further is probably a bad sign for NULS(and other alts to be honest).
4H chart:
NULS also undercut last week's lows already. I'd still like to see it cut below the June lows to grab liquidity and push higher(see last week's analysis). I'm still a buyer at these levels and plan to hold this position long term. I'm going to target at least prior week's high and ideally the swing high from 7/09 before considering a swing trade to pick up more NULS at a lower price(grow my stack).

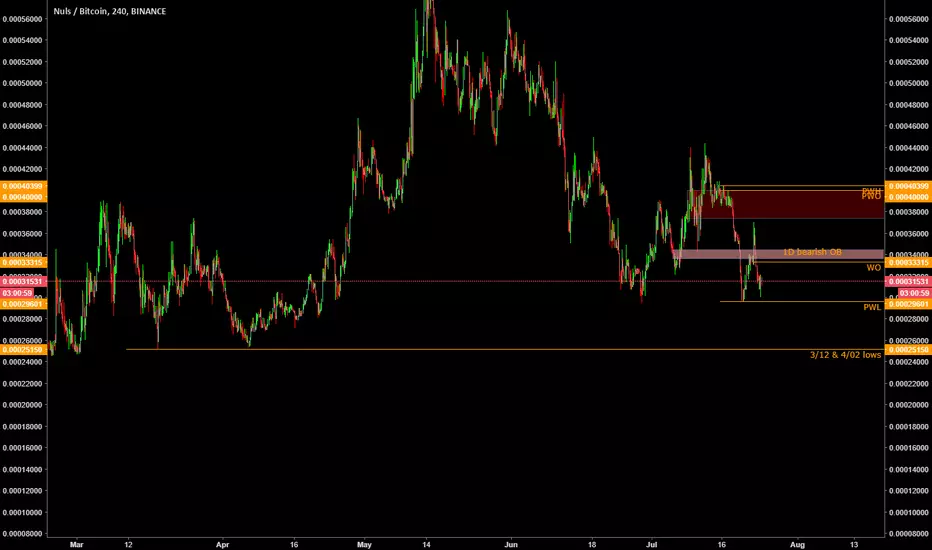
NULS Weekly Analysis 7/24/18Just my observations. Not advice, just practicing TA for myself.
Daily Chart:
Currently NULS is sitting above last week's low. This area has also been support in the past. There has been selling pressure above which is evidenced by the 1D and 1W bearish order blocks. I'm expecting the recent lows to be taken prior to a run higher and would buy on a dip to these levels. Right now, it seems like alts are beholden to BTC's movements. If BTC continues to rally hard, alts might pull back further. In the case of NULS it is possible the lows from 3/12 and 4/02 could get taken.
4H chart:
You can see the failed bounce yesterday provided an optimal trade entry for sellers around the 0.5-.705 retracements. You can also see the 1.27 fib aligns closely with the lows from 3/12 and 4/02. I will be a huge buyer if we hit these levels.

Bullish 3 dives pattern spotted, NULS tp1 50000 sats
tp2 60000 sats
not financial advice i like to roleplay

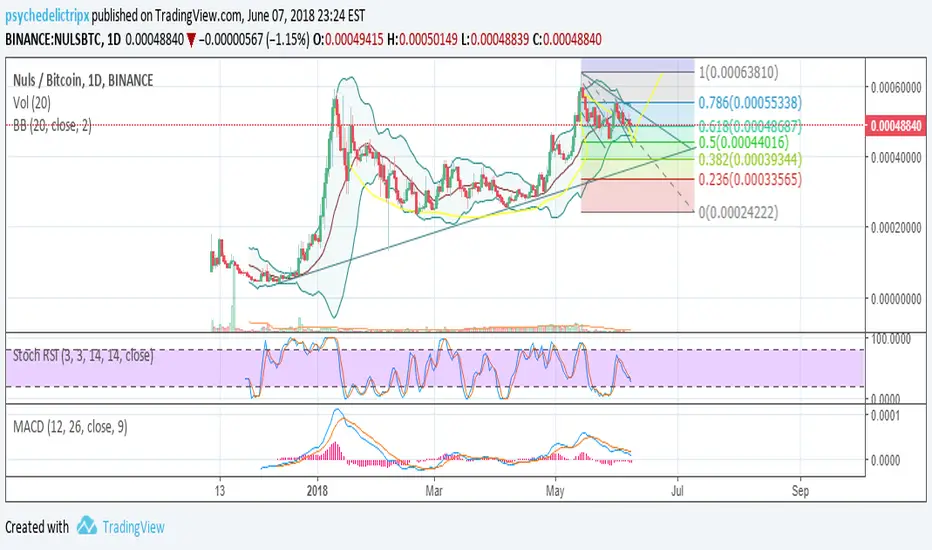
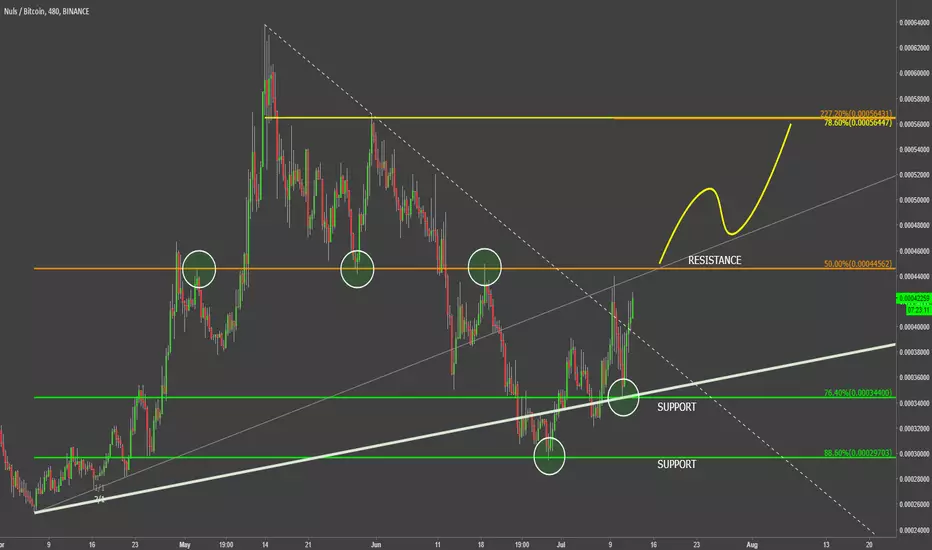
Nuls VS Bitcoin Signs of an UptrendOn the 29th of June, Nuls reached the 29.7k satoshis support, where it has rejected 88.6% Fibonacci retracement level. Since then price has been rising consistently, while printing higher highs and higher lows, suggesting the validity of an uptrend.
What is interesting, is that NULS/BTC yesterday rejected the 3/1 Gann Fan trendline and 76.4% Fibonacci support, that is 34.4k satoshis level. At the same time the downtrend trendline has been broken.
However, the 44.5k satoshis resistance is still valid, and in order for Nuls to go higher, it mus be broken with confidence. If/when that occurs, price is likely to increase towards next Fibonacci resistance level, that is 56.4k satoshis.
On a downside, if resistance will hold Nuls is likely to consolidate and perhaps go down towards 30k satoshis support or even lower.
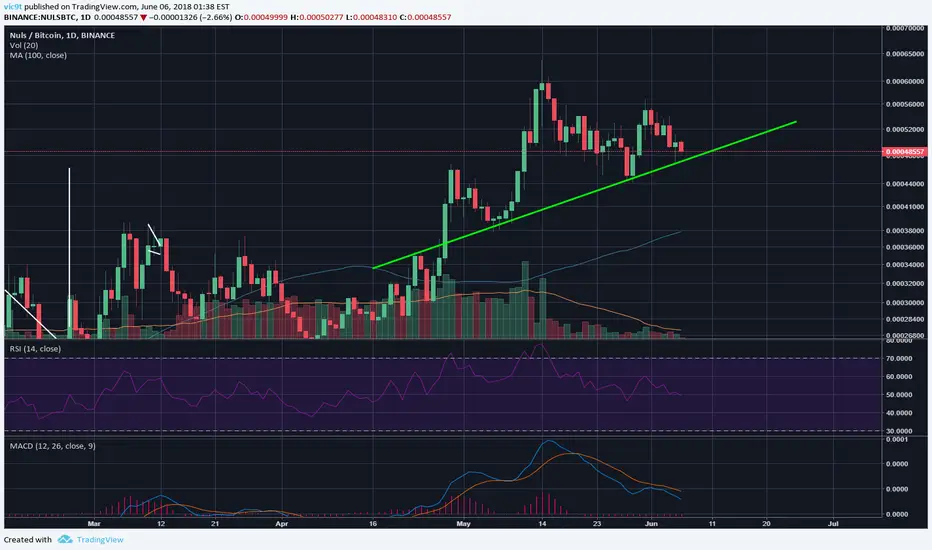
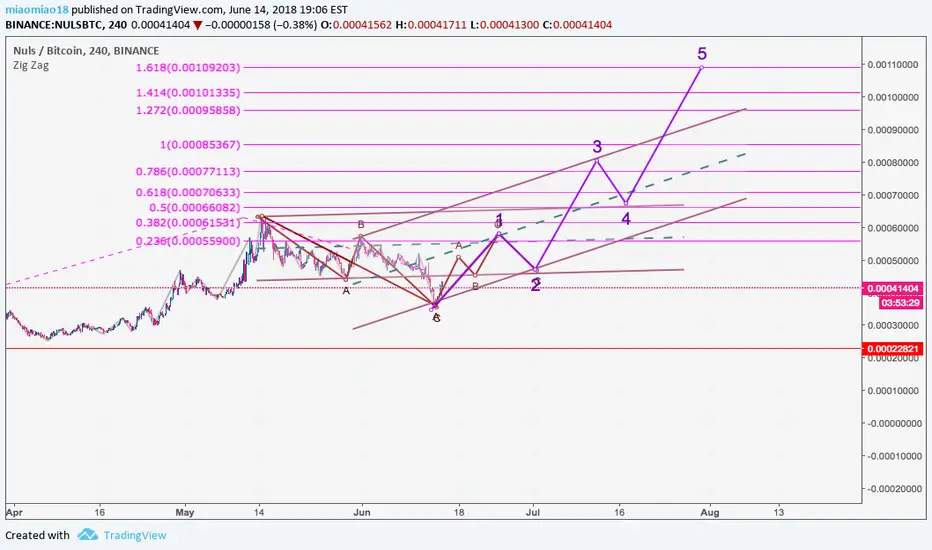
NULS - Elliott Wave TheoryOverall pretty bullish. The mainnet release is also coming up so that could be a confluent reason as well.
If we zoom out, though, to the 1d and take a fib retracement lvl over the big downward move
we see that the target comes close to the golden pocket, another confluent reason.
Target: 0.00049 area
Anyway, this is my first post on here so feel free to leave any tips ECT!

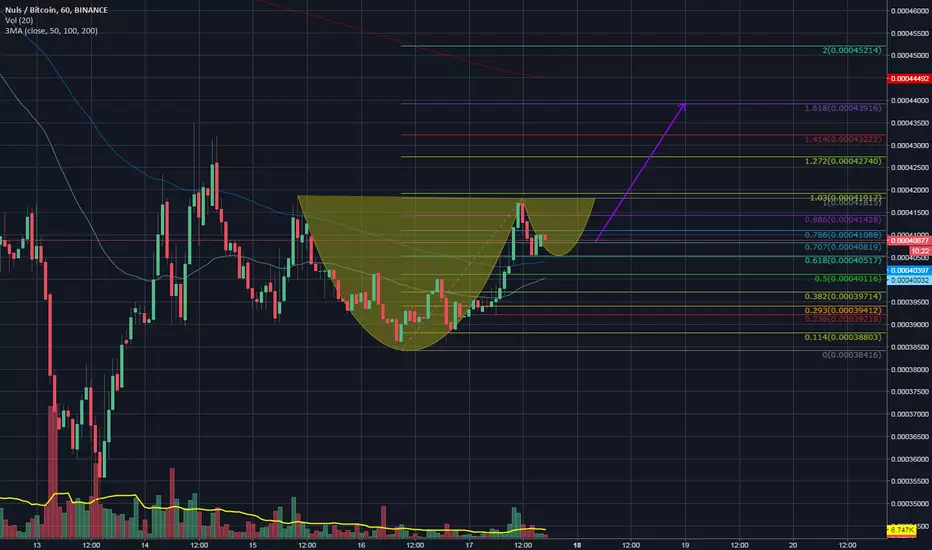
NULS in bullish channel dependent on bullish market to continueNULS UPDATE: 1 HR Chart: Nuls travelling in an upward channel likely in a correction leg. I will look for a buy at the bottom of the channel as long as I can confirm a bounce and continued bullishness.

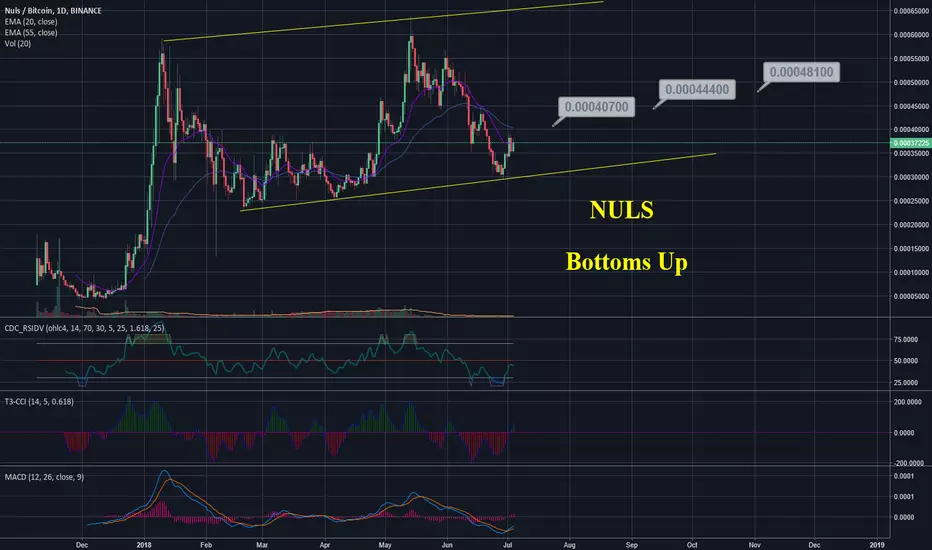
NULS - Bottoms Up! NULS had a nice bounce up from the bottom of the channel on June 30th. All the indicators confirm reversal is in play. There was a dip in price yesterday when Bitcoin dropped, but I expect momentum to continue to build from here.
RSI
CCI
MACD
Easy decision for me to make an entry here with the indicators confirming reversal and a ton of room to grow.
Plus, easy buy and hold with Mainnet release coming on July 12th.
My trading strategy targets for NULS on Binance as posted on my Discord group:
NULS on Binance
Buy up to: 37000
T1: 40700
T2: 44400
T3: 48100
SL: 31450
Daily volume: 59 BTC
Your comments, agrees and disagrees are always welcome and appreciated.
Thanks for stopping by and have a great day!
$NULS #Nuls - ANALYSIS - Big move soon, just not yetHello Lads and Ladies,
As just now requested, we will take a look at NULSBTC a coin that is hyped a lot, actually has some nice potential but just "not yet".
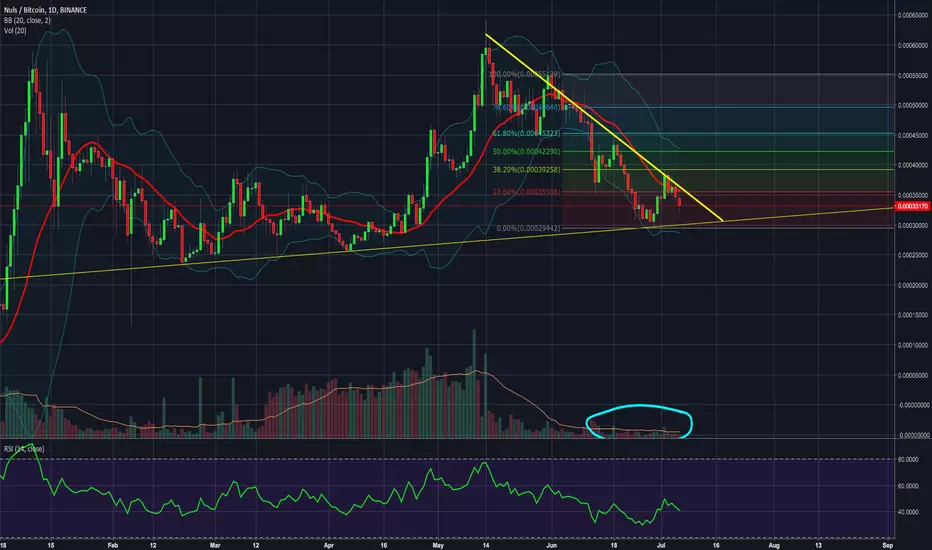
Taking a look at the daily chart we can see a very slow increasing, yet well respected support line. At this line most of the bounces happened. As we can see we had a nice bounce from this line almost a week ago. It went to the most recent resistance line and at least at the daily it is "hugging" it. Moreover, we can see that it has been rejected from the mid Bollinger Bands as well as the downtrend resistance. Therefore, I believe that we will see NULSBTC coming down a little more or even bouncing from the overall support pretty soon.
Looking at the RSI, it is also seeming to retrace and it should find its bottom around 10 Points below.
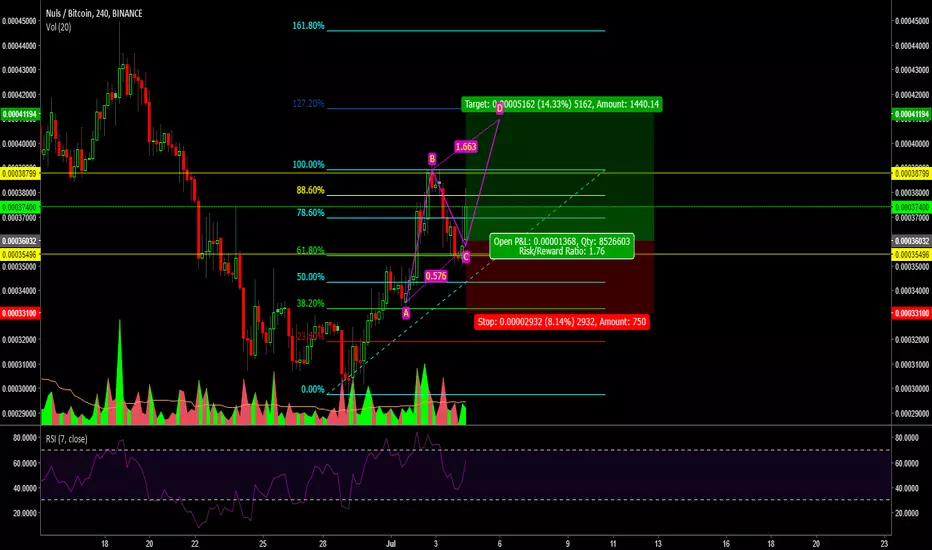
To confirm these findings we will take a closer look at the 4h chart of NULSBTC ->
Here we can see pretty much the same picture. Nevertheless, taking a closer look we can see a descending double top just above the downtrend resistance, which basically gave the retracement a very clear indication. This double top, when it retraces all the way back, would form a slightly bigger scale double bottom, which would indicate a bounce.
Looking at the RSI we can see almost the same picture of it heading down right now and with it most likely forming a double bottom.
Nevertheless, there is a chance that NULSBTC will not retrace completely to the support line and bounce even earlier. This would also mean on RSI that the mentioned double bottom would be at 31 points and not at 20 points.
Basically, looking at both charts we can clearly see that NULSBTC is retracing right now and will have a bigger bounce after this retracement. One major indicator for this is also the volume, or better said the lack of volume. Whenever NULSBTC will get a lot of volume again, we will see pretty nice pushes. Right now the volume is crashed and is looking for a "revival" ideally at the bottom the of the uptrend support.
This bounce would be able to hit at least the 38.2% and touch the 50% fibs line.
IN NUMBERS
- BUY @32k-30k
- SELL @34.5k - 39k - 42k
NULS // BTC forming Patterns AB-CD bearish // 0.38% fbonacciNULS is giving a good trading opportunity revotando in 0.38% in fibonacci
and forming Patron AB-CD -0.51% correction bass player
NULSBTC Signals Technical Analysis
Bitcoin i s going bullish and therefore alts are flying too, NULS is a nice alt-coin with good FA. its breaking out and a nice bull run ahead I'll love to buy this when it test the support again i see profit up to 57% and more which is good and i think this will be achieved within 10 days. Thanks guys for looking into it don't forget to leave a like and follow me for more. Join Us on Telegram :- @ImSNG
T HANK YOU FOR YOUR SUPPORT

$NULS, Bounce Or Nothing
Weekly
Looking at our trend timeframe we see price is currently testing our major support level at 30000. Momentum heavily shifted towards the bears. Looking for a weekly reversal at this level, otherwise sitting on my hands until we reach our next major support at 5000 satoshis. Leaning towards the drop before we radically shoot up.

NULS - correction channel pathwayI am not convinced NULS has finished correction yet. Probability tends to favor longer correction in channel pathway until it hits major support, however a big event could give us some good price action.

Nuls - Not yetThe price is still sliding down the 4th Arc Pair looking for ascending support - Nuls has completed the chart, this might be the end of upward movement for now, we will see what happens when the candles reach support of the 61.80% fib and the 1x1 gann fib ray