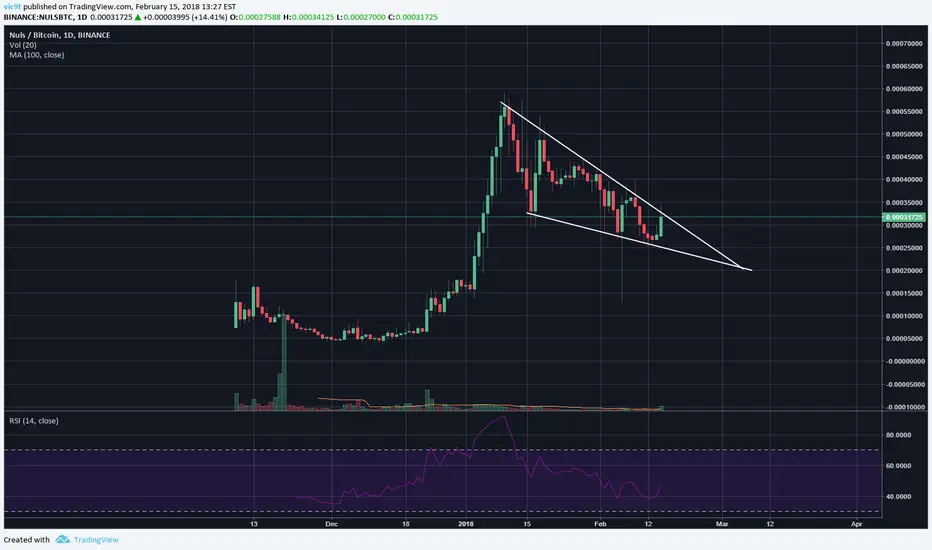
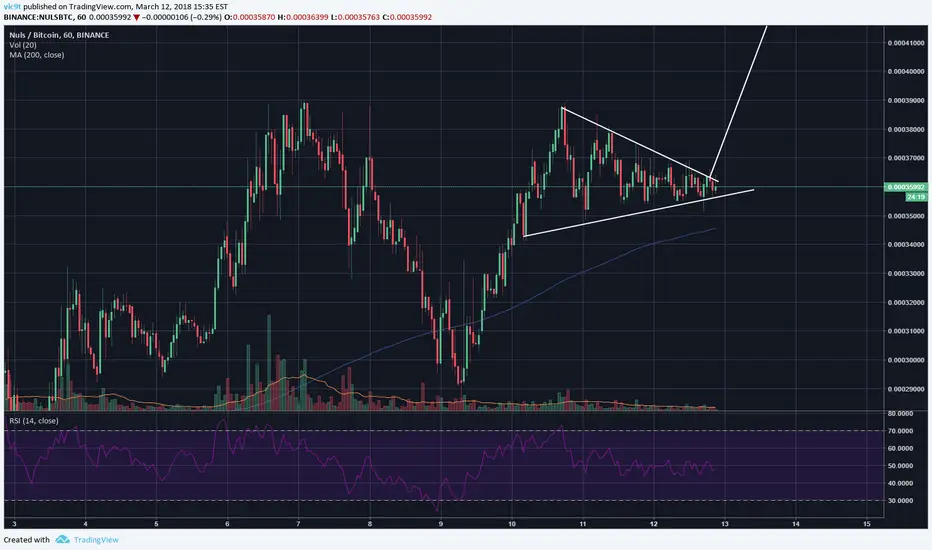
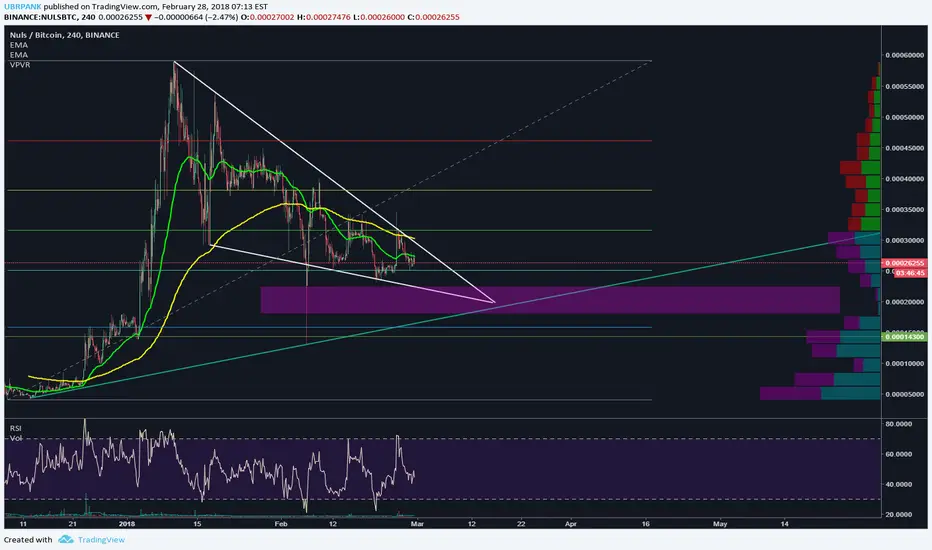
NULS consolidating in a symmetrical triangle, breakout soon?NULS is in a symmetrical triangle with an event on 3/31 for PC and mobile wallet release. Looking for it to follow the triangle and breakout upwards to 00045000.
NULSBTC trade ideas
Nuls Triangle, risky trade.Let's keep it simple.
price action forming an ascending triangle.
right now we're at the bottom of the triangle.
The thing that is giving me a really good feel about this is the TD seq. count. Nuls seems to respond and respect the 9 count really well.. as you see on the chart.
Every time it printed a 9 count it shot up shortly after.
Buy in: Under 31550
PT : Targets in white. 33963, 38785
Stop loss (Red line) : 28039
____
For more updates and more signals, visit ---> Crypto-mob trading signals / Educational / Investments : t.me
What we offer :
* Advanced -7.27% -7.27% & detailed Technical analysis
* Educational posts
* Daily / Weekly tips
* Crypto news
* Giveaways
And much more to come!

Long on Fib Channel Up Trend for NULSBTC 1 hour chartThis is an update to an earlier idea.
I am giving this trade an extra day.
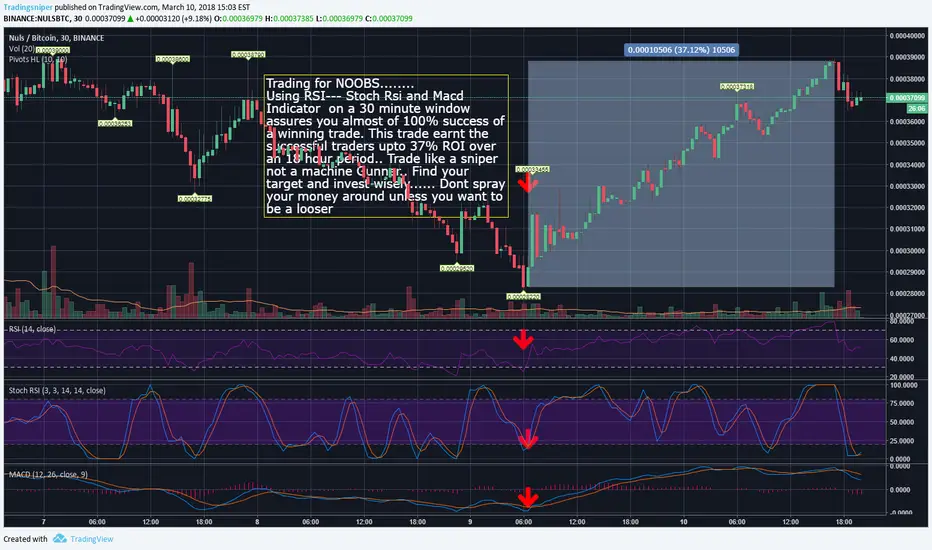
Trading for NOOBS... Do you want results?? sick of loosing??Trading for NOOBS........
Using RSI--- Stoch Rsi and Macd Indicator on a 30 minute window assures you almost of 100% success of a winning trade. This trade earnt the successful traders up-to 37% ROI over an 18 hour period.. Trade like a sniper not a machine Gunner.. Find your target and invest wisely...... Dont spray your money around unless you want to be a looser
Back test my advice and you will be able to confirm my advice works. ALL 3 indicators must be at the Bottom of the range panel for Guaranteed results.
Invest wisely
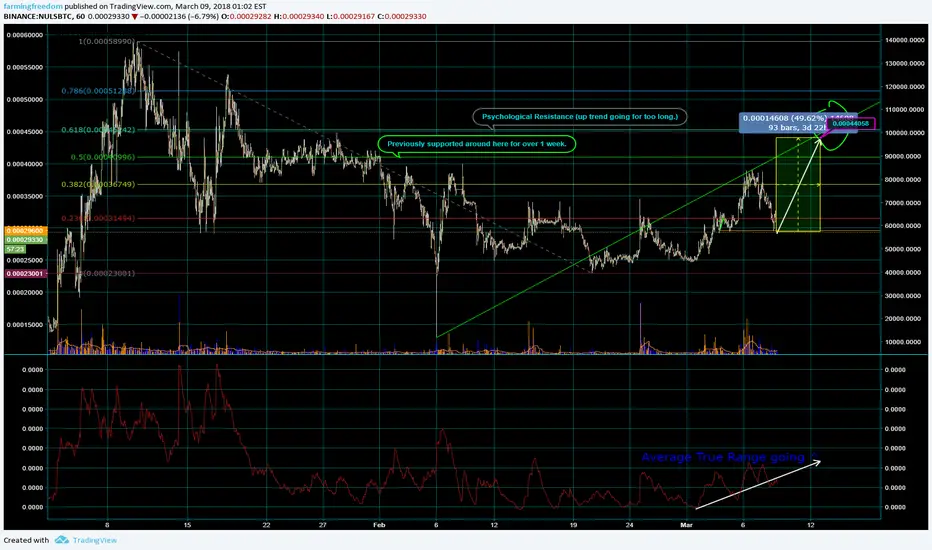
NULS 4 Day long trade - Target 44058 SatoshiCheck out the recent volume of NULS. (Orange and Blue) bars under the candlesticks. The rest of the idea should be well enough explained through my chart. Another Fib retracement about to happen.
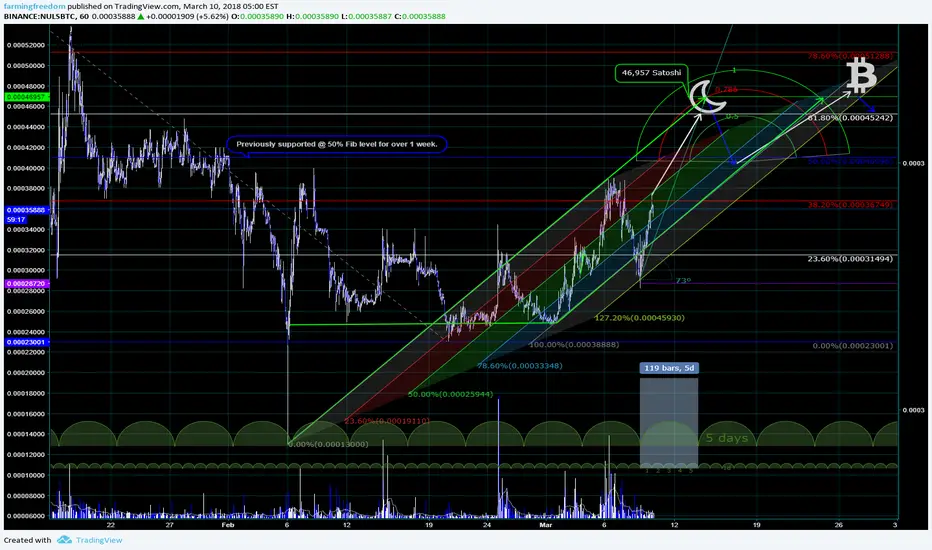
NULS Update New Target 46,957The up trend angle has changed +4° Steeper ( 77° )
NULS is rising faster
If we don't see more volume tomorrow than today
then maybe my previous call will be back on target.

$NULS $BTC there are better trades out there. Don´t rush into a trade, always look at the bigger perspective :D
Appreciete the like and the follow.
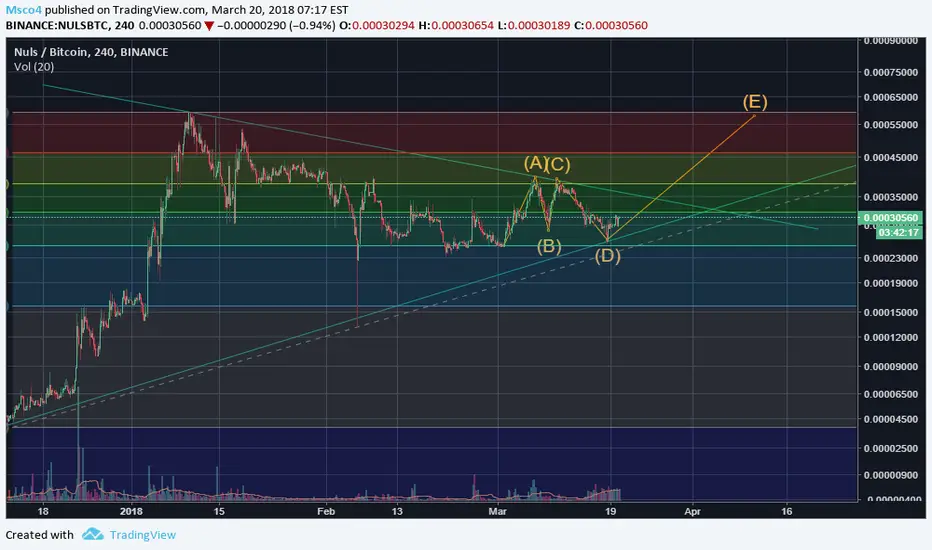
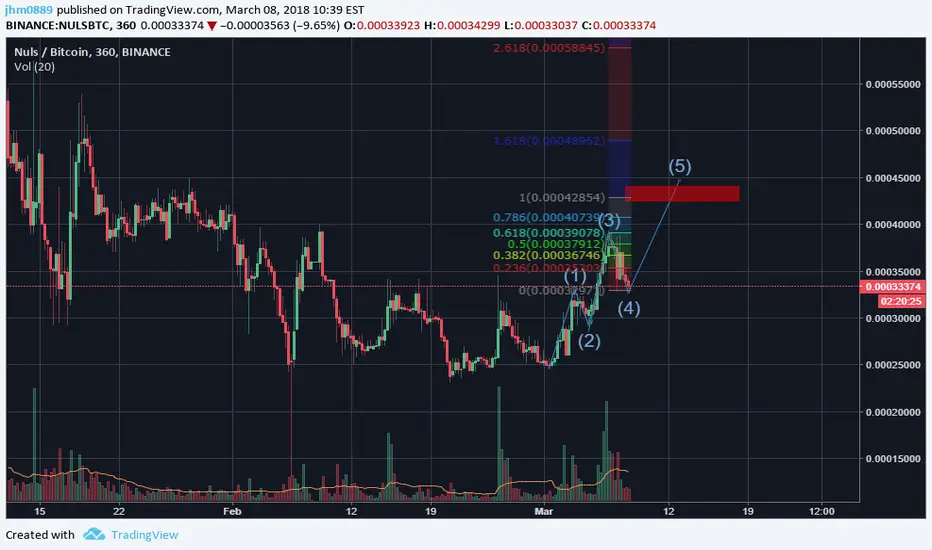
NULS bottomed wave 4 getting ready to wave 5?Nuls Bottomed wave 4 and just consolidating in .00033 sats and getting ready to wave 5.
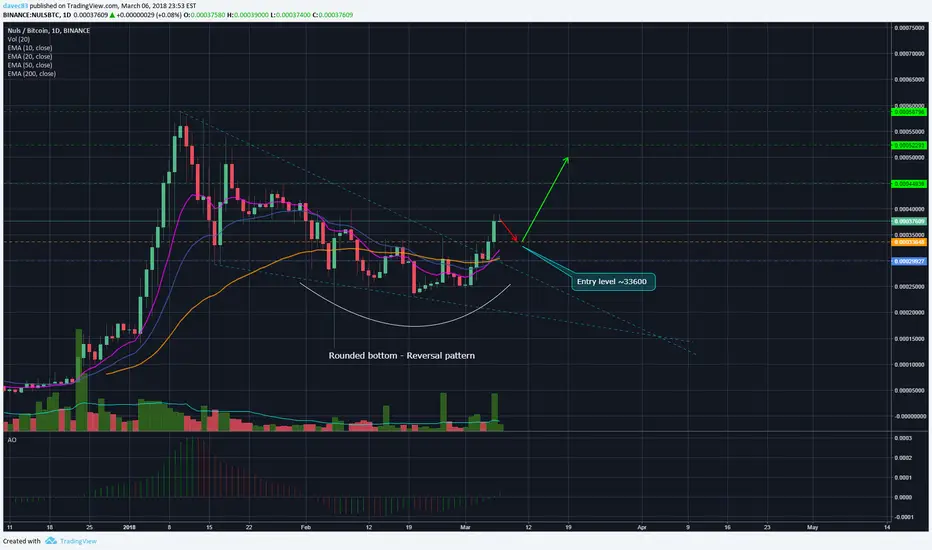
Nuls Going Up! (NULS/BTC)There are several signs to "confirm" with high probability a trend reversal. The most important signs beside price action are: rounded bottom formation, wedge breakout and volume momentum.
There should be a slight pull-back before going up, therefore I would wait for a lower entry point (37,000 right now)
Entry: ~34,000
TP1: 44,000
TP2: 52,000
TP3: 58,000
SL: 30,000
Once the first target hits, please lock in profits. Like always, please use your own judgment when trading, this is nothing but a trading IDEA, not advice.
Nuls breakout - Confirm with lower time framesNuls just broke out, waiting to see if it can hold above the trendline. Will enter on a volume spike on lower time frames after accumulation.
Take a look at my youtube channel for daily analysis and trade set-ups. : www.youtube.com

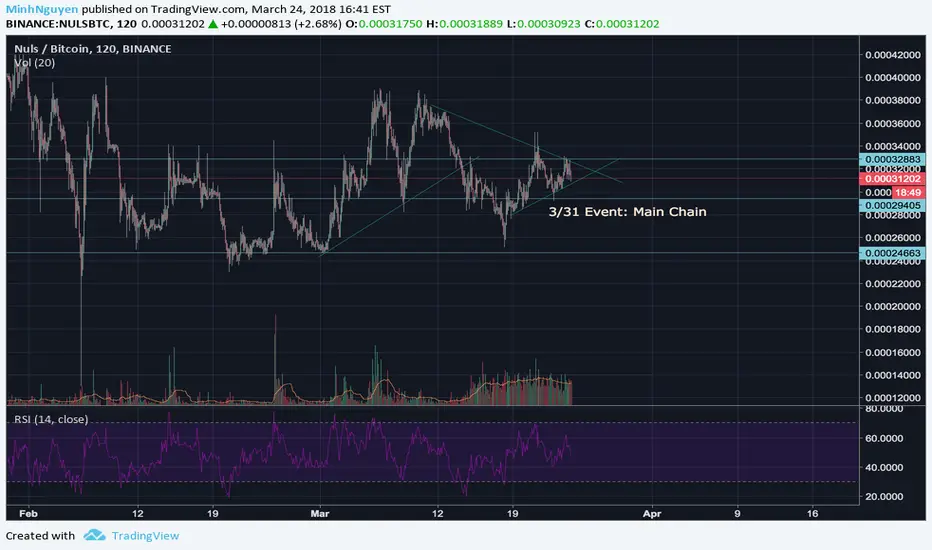
Null is nothing, Nuls is everythingGetting reeeal tight for NULS before breaking bullish. Testnet launch is around 20th of March, so it fits perfectly with this flag pattern.

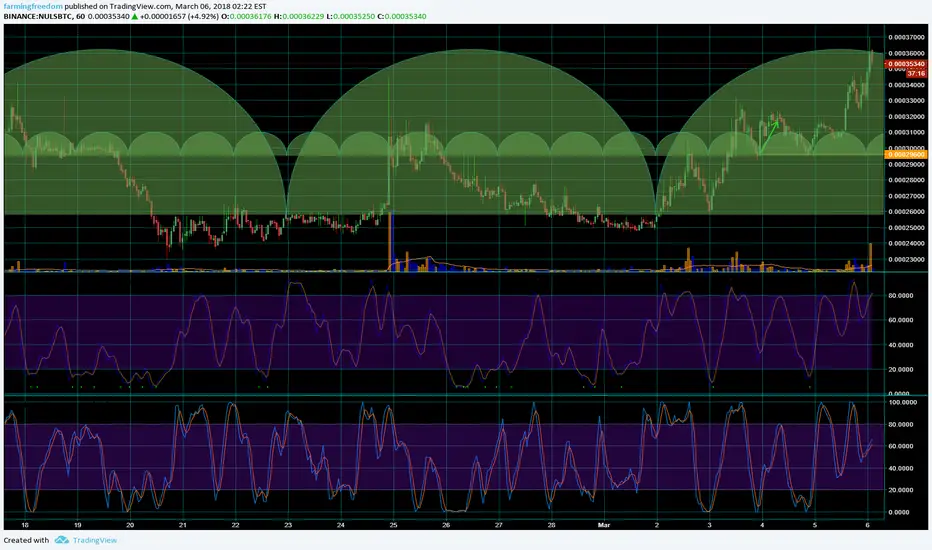
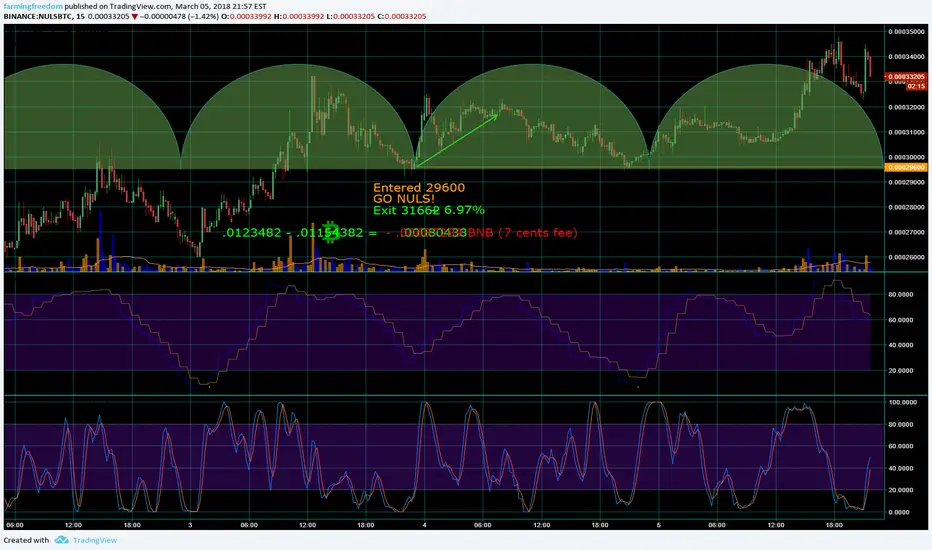
Time on top of time - Why I like the "Time Cycles" drawing tool.As a swing-scalper trader I need to know what's going on in the larger time frames. I should be aware of prior bullish and bearish patterns and understand the changing volatility levels of daily and weekly trends to minimize risk potential and to maximize rewards potential. So that I can visualize this from my native 15 minute chart (the time frame I work from) I use the "Time Cycles" drawing tool. I Click two points on the chart 24 hours apart. I change the time frame to 1 hour and then use the "Time Cycles" tool again to click two points exactly 7 days apart. The harmonic patterns of daily and weekly life and markets become visible to me with this chart set up.
Thank you tradingview team! I love my free account here :)
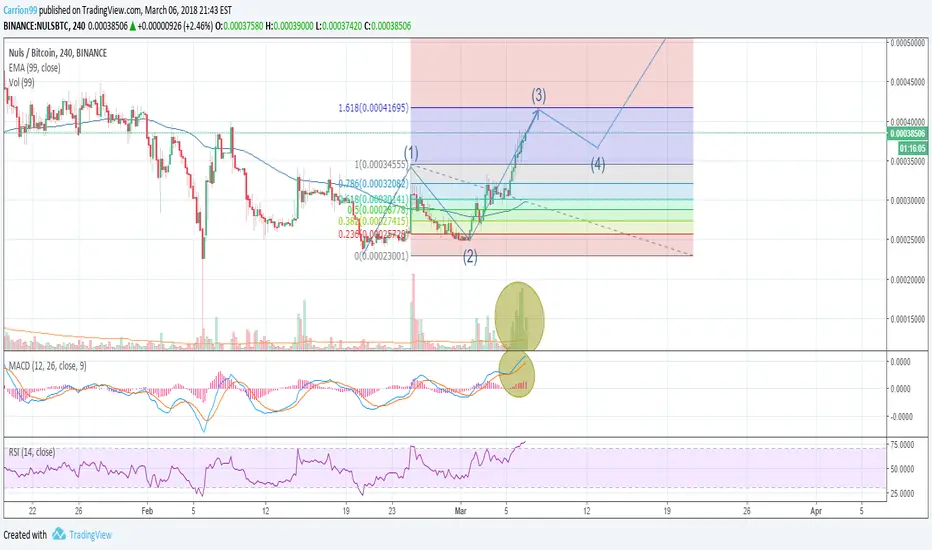
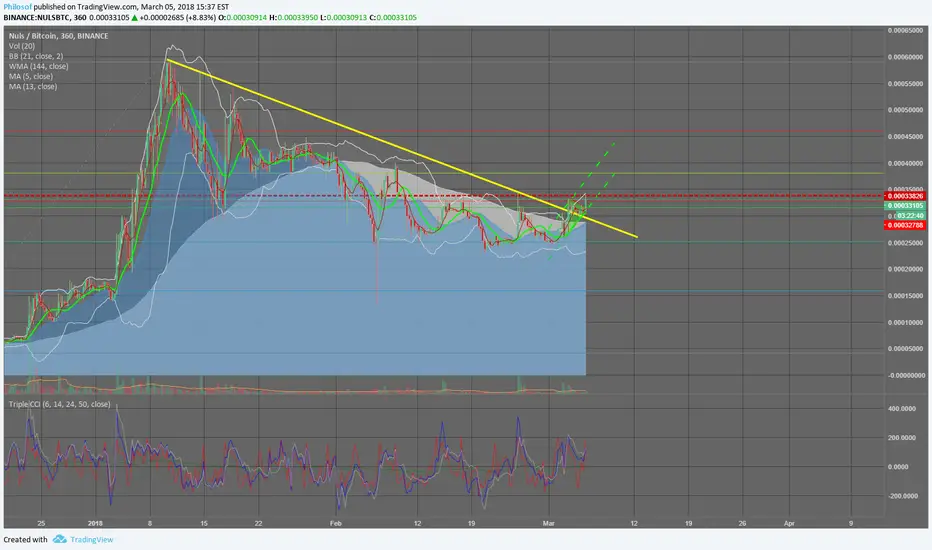
NULS/BTC Part of the bigger bullish pictureTHOUGHTS:
Hello and welcome to my analysis on NULS. First of all before diving into this TA I would like to inform you all that NULS is a great long term project with strong fundamentals, technology and team behind it but today I will try to swing this coin. As you may know if you keep up with NULS the coin has been in a downtrend after a huge run up that it had a while ago. This downtrend seems to have been broken after the break of the long term descending wedge (you can see the zoomed in version of it on the chart). It recently stopped to form a wedge while the volume has calmed down but the coin maintained pretty much all of its gains which is a bullish sign. Price is maintaining above the 21 EMA and the other EMA's are pointing upwards while its being supported by the MA's + a "TK" cross has been spotted on the 4H as well. The white box on the chart represents the resistance zone that NULS is currently facing.
RECAP AND WHY THIS COULD BE A GOOD TRADE:
Nuls broke the long term descending wedge
TK Cross spotted
Wedge forming while maintaining all of its gains
EMA's pointing to the bullish side
MA's showing signs of confidence and supporting the overall price
Upcoming test-net and main chain launch this months
ENTER:
When we have entered/broken the white resistance box (REALLY BULLISH)
When the triangle on the 4H has been broken (BULLISH)
When the cloud has been broken (BULLISH)
EXIT:
0.00038000 - 0.0004000 (First sign of resistance and the the first fib level that we have to take into consideration)
0.00043000 - 0.0005000 (Second sign of big resistance and the second fib level - I recommend this sell point if you are greedy and really confident in this coin)
WARNING:
Due to the current market conditions (BTC being extremely bullish) this trade is risky but it could make you a nice bag of money if you play your cards rights. Also remember that I am not a financial advisor and these charts are being made because I want to share and improve my TA knowledge.

NULS starting an uptrendJump in! NULS is starting an uptrend. Everything shouting.
1. Broke downtrend line
2. Broke simetric triangle
3. Continued uptrend channel (bounced from its bottom line)
4. CCI good
5. Can't show it on a main screen but the RSI also looks good although showing oversold soon
33900 has a serious resistance zone. Hopefully NULS will go over it and fly towards next resistence at ~38800.
P.S. Buy on your own risk. Sell when the graph tells you to sell.
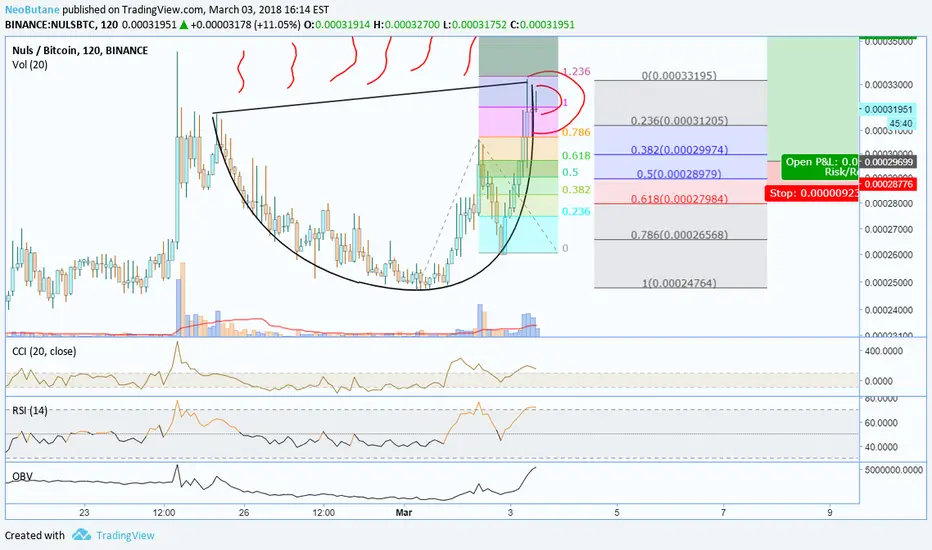
NULSBTC - Steaming Cup and HandleWow, would you look at that!
FIb ext. shows we more than likely peaked on the cup. Entry in the blue range or above cup value for confirmation safety. <.5 retrace means cup failure.
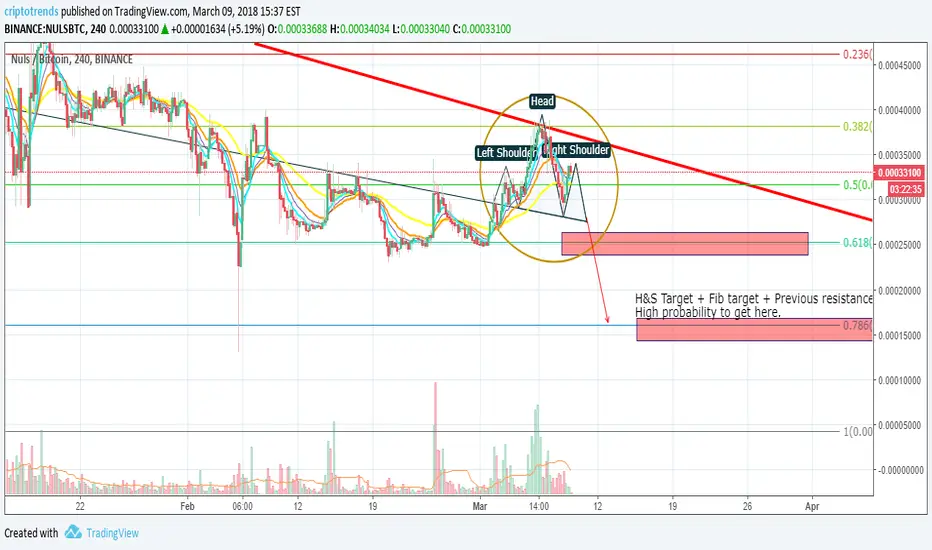
NULS is nothing1. hold 61.8% retrenchment
OR
2. Goes to 0.0002 ZONE (volume profile)
---------------------------------------------------------------
BTC action suggest second scenario - we'll see.
LONG TERM = MUST HAVE !
4.3.18 = new website
20.3.18 = test net launch
x.4.18 = wallet release
Remember: Null Is Nothing, NULS Is Anything You Want In A Blockchain World!
NULS descending wedgeSeems to be bullish over there, I hope we will have a breakout with the momentum we have today!