HHG2028 trade ideas
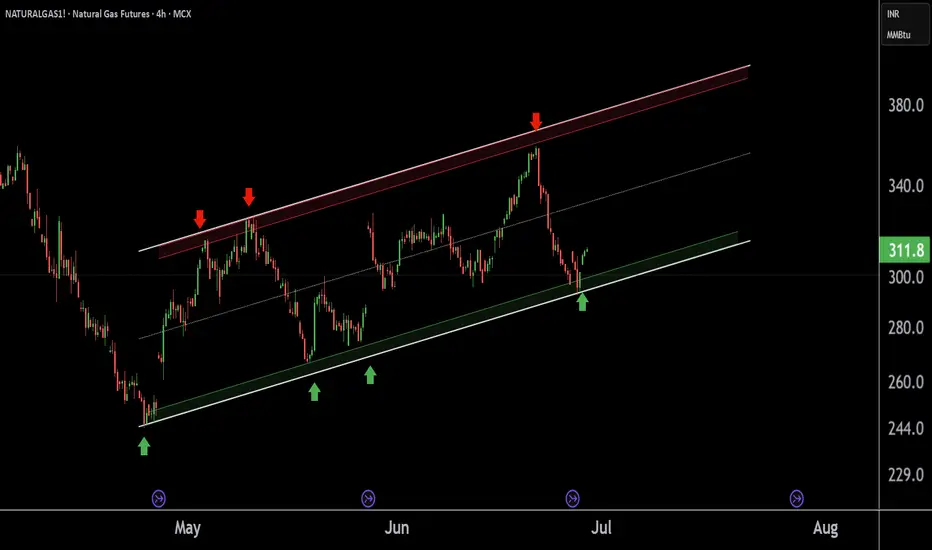
NATURALGAS1! Short time Breadkdown Alert !!This is the 4 hour chart of Natural Gas Futures.
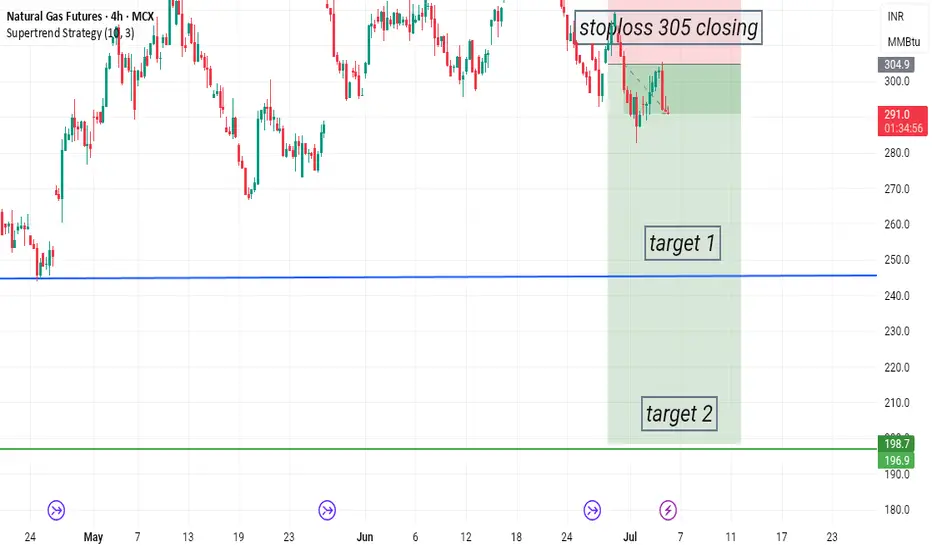
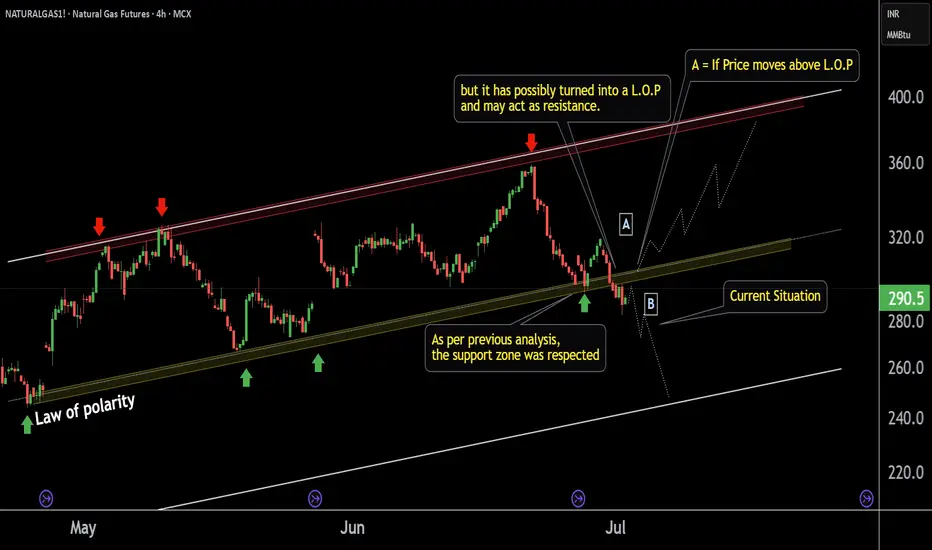
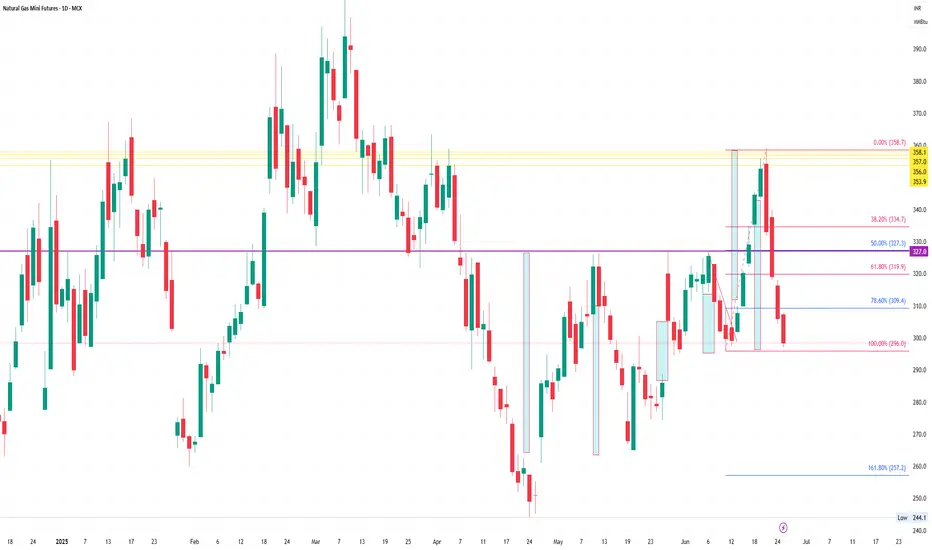
NATURALGAS1 has given a short-term channel breakdown; the previous support may now possibly act as resistance at 300 level.
The breakdown target is the lower boundary of the broader channel, which may now act as support near at 240 level.
If lop is sustain then we may see lower prices in NATURALGAS1.
Thank You !!
Gold | Oil | Dollar | Silver | Natural Gas July 2025 Forecast.July 2025 Forecast.
Gold | Oil | Dollar | Silver | Natural Gas
NYMEX:NG1! COMEX:GC1! COMEX:SI1! AMEX:UNG

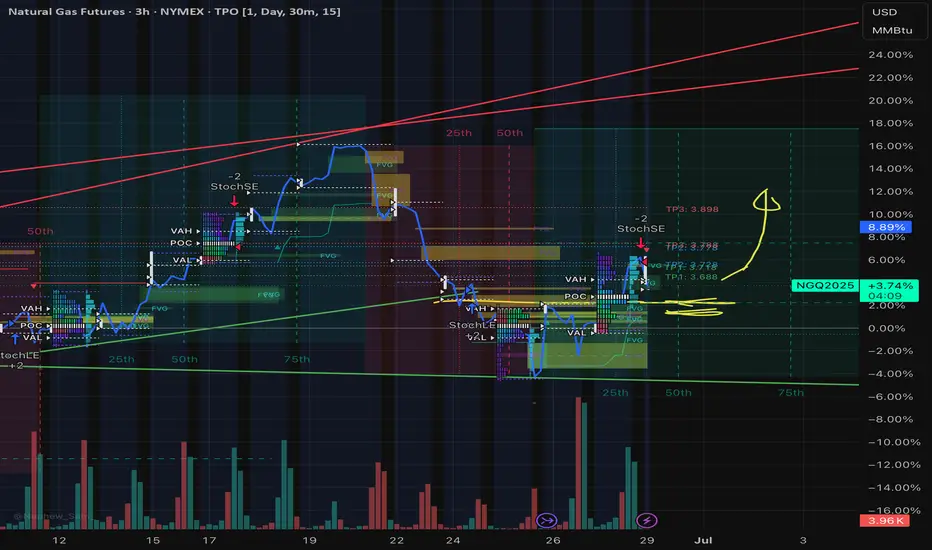
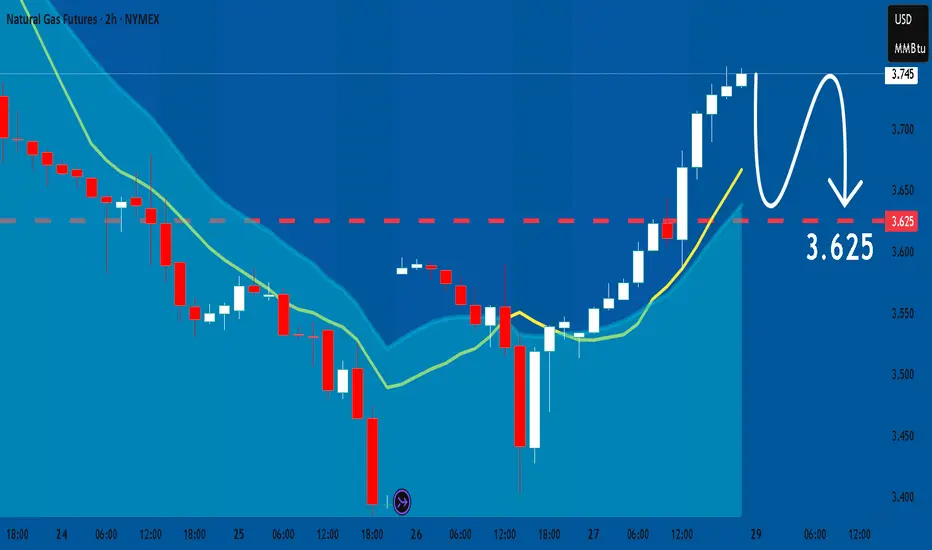
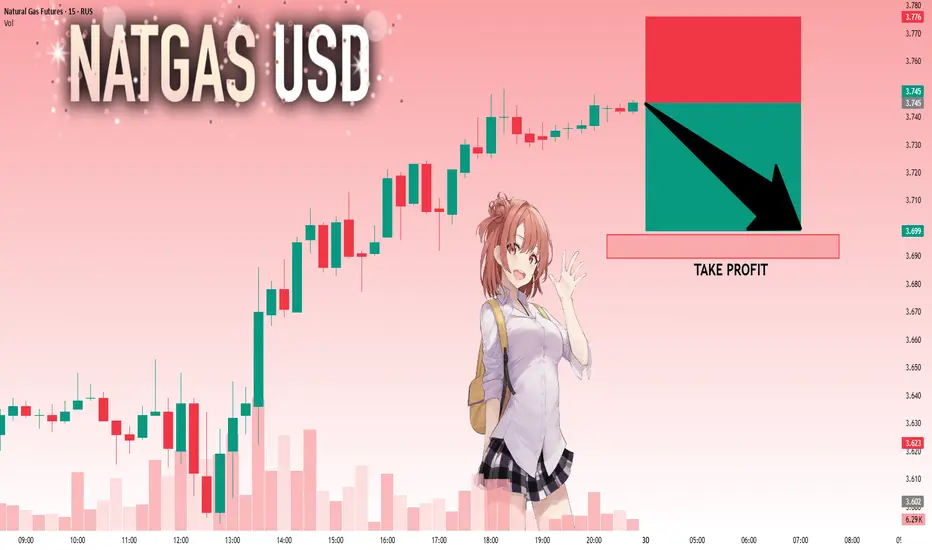
Nat Gas; Dip then RipA slight breather as expected for NG prices after such a strong reversal, from the storage report lows on 6/27/2025. Support for NG based on volume looks to be in the $3.55 to $3.65 range, before continuing a move up to $4+. NYMEX:NG1!
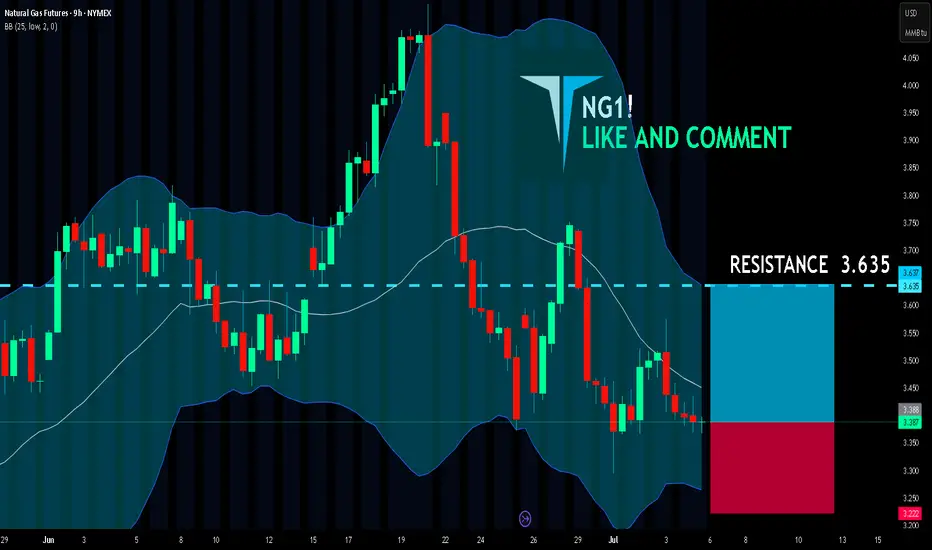
NG1! SENDS CLEAR BULLISH SIGNALS|LONG
NG1! SIGNAL
Trade Direction: long
Entry Level: 3.387
Target Level: 3.635
Stop Loss: 3.222
RISK PROFILE
Risk level: medium
Suggested risk: 1%
Timeframe: 9h
Disclosure: I am part of Trade Nation's Influencer program and receive a monthly fee for using their TradingView charts in my analysis.
✅LIKE AND COMMENT MY IDEAS✅
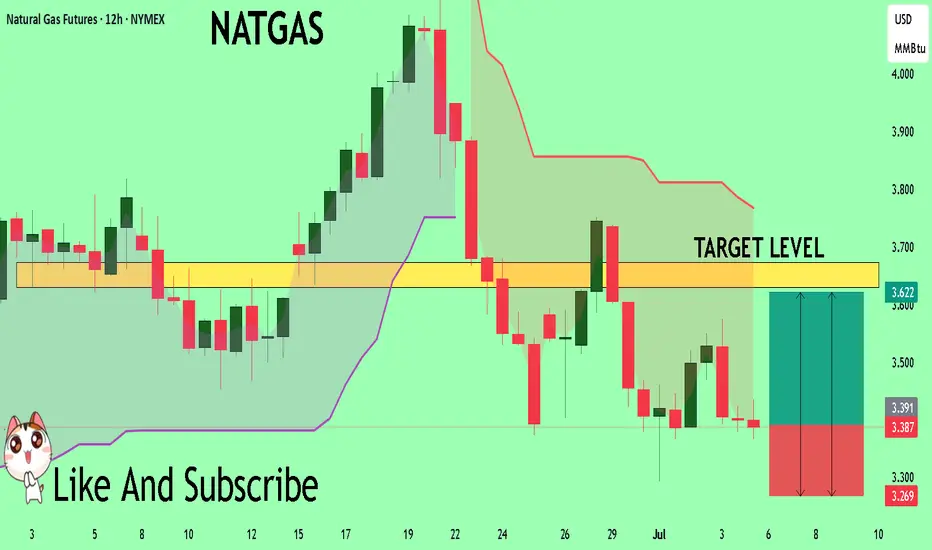
NATGAS My Opinion! BUY!
My dear followers,
This is my opinion on the NATGASnext move:
The asset is approaching an important pivot point 3.387
Bias - Bullish
Safe Stop Loss - 3.269
Technical Indicators: Supper Trend generates a clear long signal while Pivot Point HL is currently determining the overall Bullish trend of the market.
Goal - 3.630
About Used Indicators:
For more efficient signals, super-trend is used in combination with other indicators like Pivot Points.
Disclosure: I am part of Trade Nation's Influencer program and receive a monthly fee for using their TradingView charts in my analysis.
———————————
WISH YOU ALL LUCK
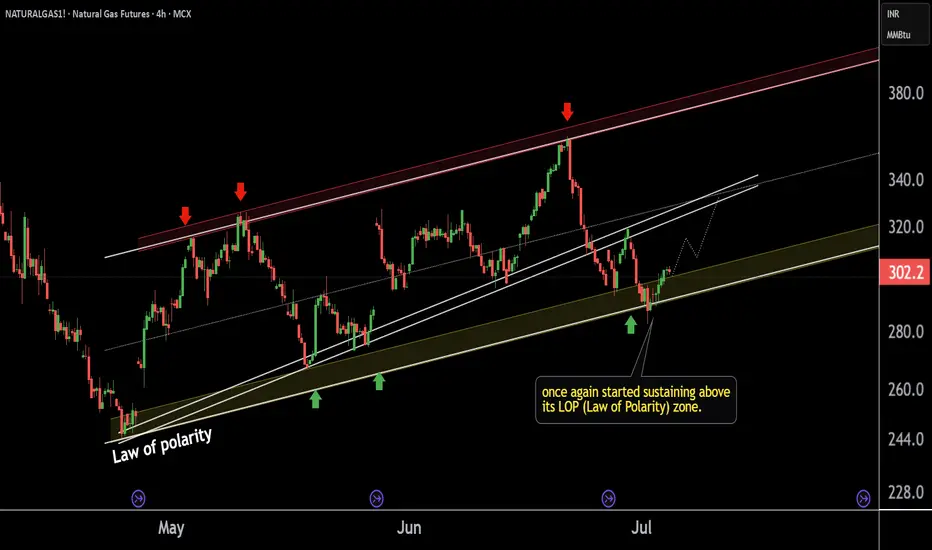
NATURALGAS1! 's key Level |This is the 4 hour chart of NATURALGAS1!
NATURALGAS1! has once again started sustaining above
its LOP (Law of Polarity) zone near at 290-295
If This level is sustain then ,we may see higher prices again in NATURALGAS1!.
Thank You !!
NG1!: Move Up Expected! Long!
My dear friends,
Today we will analyse NG1! together☺️
The price is near a wide key level
and the pair is approaching a significant decision level of 3.403 Therefore, a strong bullish reaction here could determine the next move up.We will watch for a confirmation candle, and then target the next key level of 3.429.Recommend Stop-loss is beyond the current level.
❤️Sending you lots of Love and Hugs❤️
Europe Shudders over Winter Gas FearsEurope Shudders over Winter Gas Fears: Germany Puts Market on Edge
By Ion Jauregui – Analyst at ActivTrades
Europe is once again sounding the alarm over a potential energy crunch this coming winter. The continent’s gas reserves—particularly Germany’s—are significantly below normal levels for this time of year, amid soaring energy demand, heatwaves, and weaker renewable generation. The result: a volatile market that anticipates a new global scramble for liquefied natural gas (LNG).
As we approach the third quarter, storage levels are well below those recorded last year. High summer temperatures and reduced renewable output are pushing up demand and straining the energy market. According to recent data, this German weakness is spreading across the EU: European gas storage is currently at around 58% capacity, compared to 76% at this time in 2024. Germany is among the most exposed, with just 52% of its storage filled. Its largest facility—Rehden—is operating at only 2.45%, down sharply from 85% a year ago. By contrast, France sits at around 60%, and Spain slightly exceeds 70%, thanks to its regasification infrastructure and pipeline connections with Algeria.
However, the issue is not just about volume. Recent heatwaves across much of the continent have driven up air conditioning use and thus electricity demand. The situation has been worsened by a sharp 40% drop in European wind power generation this July, forcing a heavier reliance on gas for backup power.
Against this backdrop, markets are already pricing in a strong uptick in LNG imports. S&P Global estimates a year-on-year increase of 50% for Q3, reflecting nervousness over a potentially cold winter and a volatile geopolitical environment. This could further drive up prices—especially if Asia, and notably China, ramps up its purchases.
Spain: Both Supplier and Consumer
Spain, traditionally reliant on Algerian pipeline gas and maritime LNG, is in a less vulnerable position than Germany. Its six regasification plants and direct link to Africa via the Medgaz pipeline offer logistical advantages, but they also place Spain at the heart of Europe’s growing LNG import pressure. In fact, Spain has become a key hub for redistributing LNG to countries with limited infrastructure, like Germany and Austria. Rising domestic demand and exports to France and others could lift local prices, particularly if Algeria curbs flow due to technical or political reasons. Additionally, the spike in temperatures and the 40% drop in wind power have increased gas usage for electricity generation. This has led to higher electricity prices across Europe. Germany has seen peaks of up to €550/MWh, while Spain has benefited from a more balanced mix of renewables and gas.
Risks and Opportunities for Spain
While Spain’s strategic position and supply diversification offer some protection, an uncontrolled surge in prices—especially if Asia aggressively enters the LNG market—could still affect Spanish consumers. On the other hand, energy companies with export or storage capacity could benefit if Central Europe sees a spike in demand.
Ultimately, the third quarter of 2025 will set the tone for the coming winter. Europe is hoping for a globally balanced LNG market and subdued Asian demand to reach a storage target of 86% by October. But if weather or geopolitics turn adverse, gas could again be at the center of an energy crisis in the heart of Europe.
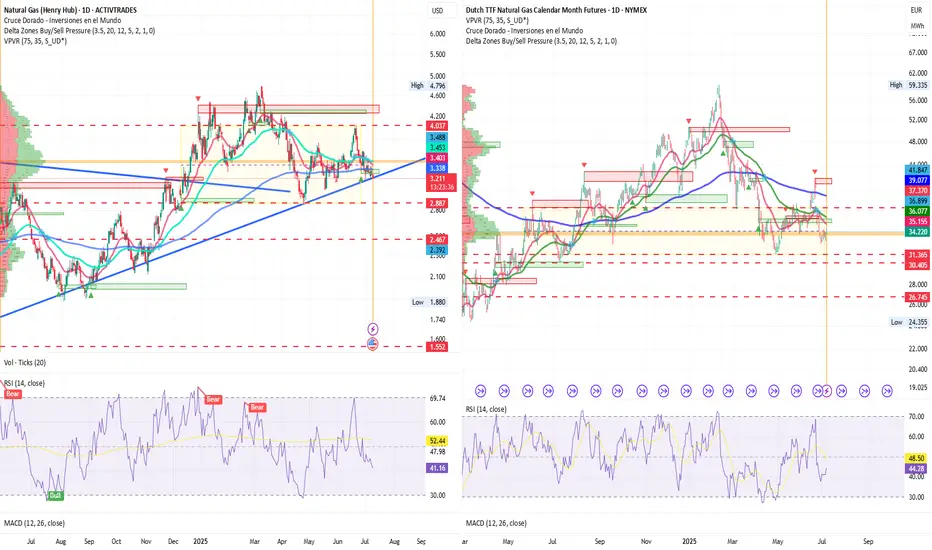
Gas Prices Seek Direction: Technical Consolidation
Henry Hub Natural Gas (NGAS) is currently trading at $3.216, within a consolidation range between $2.887 and $4.037. Since late June, the bias has been slightly bearish, with moving averages crossing above the price and the RSI showing oversold levels (41.29%). The point of control sits at $3.458—just above the current level—acting as resistance. A breakout above this level could target the highs at $4.796. Conversely, support at the lower end of the range at $2.467 may activate as a downside technical objective.
In Europe, the Dutch TTF gas contract—a key benchmark on the continent—is holding around €34.220/MWh, consolidating between €31.385 and €36.899. The RSI stands at 44.28%, and moving averages continue to signal downward pressure. Still, positive delta pressure zones remain, and a breakout above €36 could push prices towards €40–42, levels last seen during prior geopolitical crises in the Middle East. A drop below €30 would trigger bearish technical signals toward €27–28, regions where industrial demand tends to rebound in spring.
The Key Once Again: Weather, Asian Competition, and Geopolitics
If winter arrives early or global tensions escalate, Europe could face another surge in prices—just as inflation seemed under control.
Conclusion: Europe’s Winter Is Being Decided in Summer
Europe’s energy balance for the winter is being determined now. If weather, Asian demand, and geopolitics do not align in its favor, the continent could be headed toward a fresh spike in gas prices. Germany, due to its structural vulnerability, may act as a trigger for broader tensions. In this scenario, countries like Spain have an opportunity to position themselves as key players in supply redistribution and market stabilization. But the risk is clear: if the pattern of scarcity and uncertainty repeats, gas could once again be the centerpiece of an energy crisis with direct consequences for households, inflation, and industrial competitiveness across Europe.
*******************************************************************************************
The information provided does not constitute investment research. The material has not been prepared in accordance with the legal requirements designed to promote the independence of investment research and such should be considered a marketing communication.
All information has been prepared by ActivTrades ("AT"). The information does not contain a record of AT's prices, or an offer of or solicitation for a transaction in any financial instrument. No representation or warranty is given as to the accuracy or completeness of this information.
Any material provided does not have regard to the specific investment objective and financial situation of any person who may receive it. Past performance and forecasting are not a synonym of a reliable indicator of future performance. AT provides an execution-only service. Consequently, any person acting on the information provided does so at their own risk. Political risk is unpredictable. Central bank actions can vary. Platform tools do not guarantee success. Regulated status does not guarantee security.
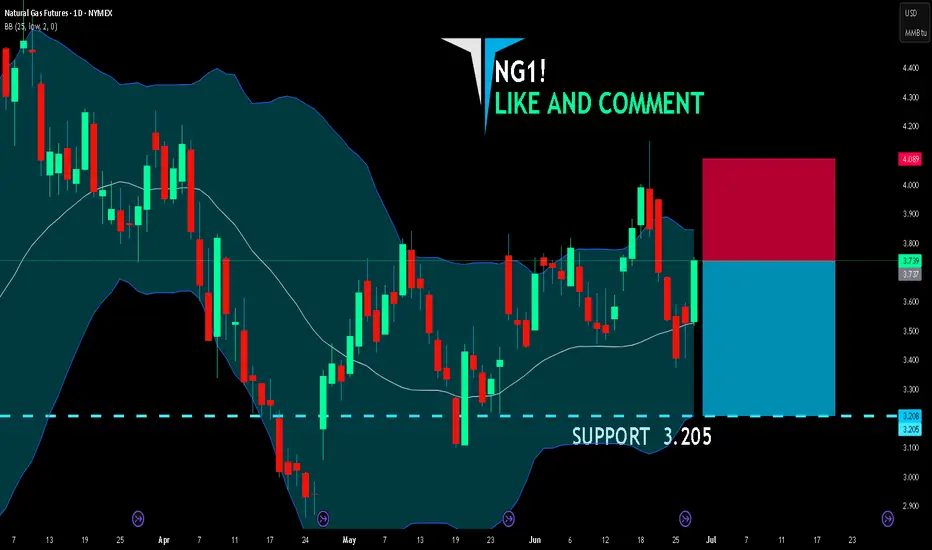
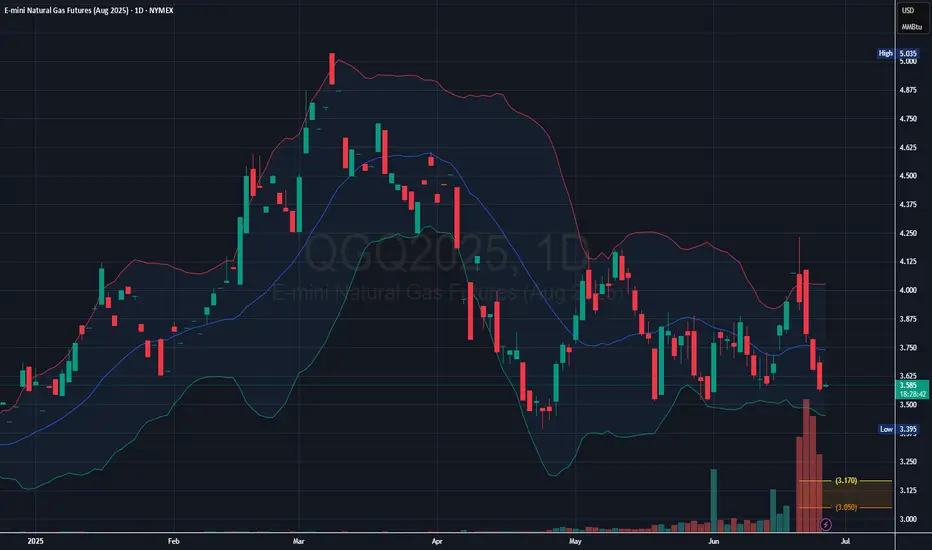
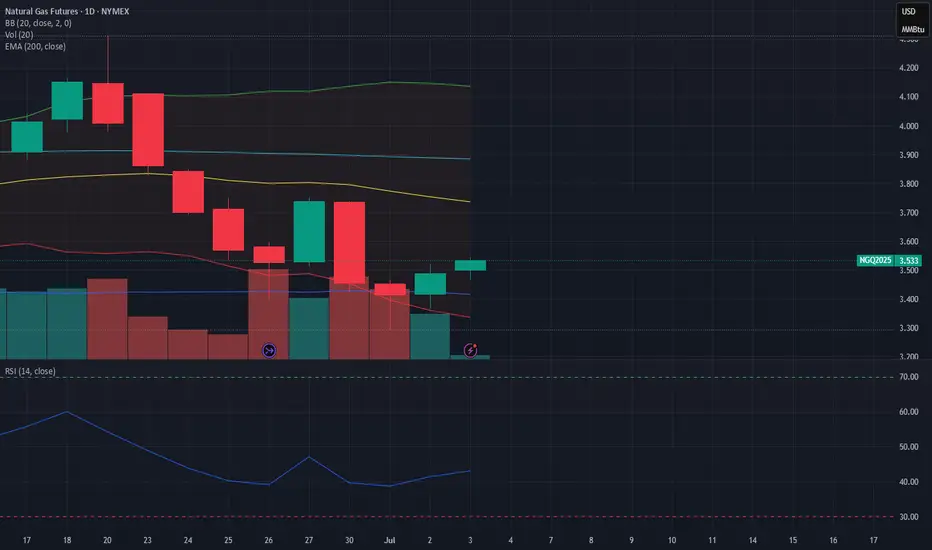
Natural Gas Slips Below Support – More Downside Ahead ?
Recent candles are large-bodied bearish candles, indicating strong selling pressure.
Bollinger Basis is sloping downward, showing short-term bearish momentum.
Price is currently below both the 20-day and 50-day moving averages, reinforcing the bearish outlook.
Natural Gas Long positionNatural Gas will be ready for LONG position from 295 to 297 Labels, be ready to catch the move till 395 and above..........
NG1! BEARS ARE GAINING STRENGTH|SHORT
NG1! SIGNAL
Trade Direction: short
Entry Level: 3.737
Target Level: 3.205
Stop Loss: 4.089
RISK PROFILE
Risk level: medium
Suggested risk: 1%
Timeframe: 1D
Disclosure: I am part of Trade Nation's Influencer program and receive a monthly fee for using their TradingView charts in my analysis.
✅LIKE AND COMMENT MY IDEAS✅
NATURALGAS at Best Support Zone This is the 4 hour chart of Natural Gas.
Natural Gas having a good Support Zone at 290-295 range.
Natural Gas has shown a reversal from its support zone.
Natural Gas is trading within a parallel channel support at 293 level Natural Gas.
Thank You !!
NATGAS: Forecast & Trading Plan
The analysis of the NATGAS chart clearly shows us that the pair is finally about to tank due to the rising pressure from the sellers.
Disclosure: I am part of Trade Nation's Influencer program and receive a monthly fee for using their TradingView charts in my analysis.
❤️ Please, support our work with like & comment! ❤️
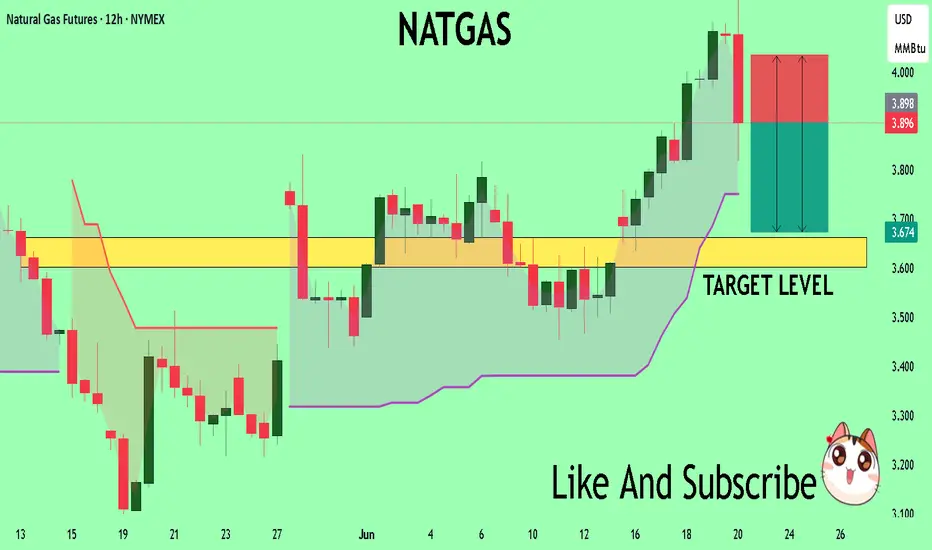
Natural Gas Futures Signal Breakdown Below Mid-Band Support
The most recent candle closed below the middle Bollinger Band (20 SMA), indicating potential downside momentum.
The price recently spiked toward the upper band (~$4.20) but was strongly rejected, creating a bearish reversal pattern.
Volume has been increasing on down days, especially the last few sessions, suggesting institutional selling pressure.
NATGAS Will Collapse! SELL!
My dear friends,
Please, find my technical outlook for NATGAS below:
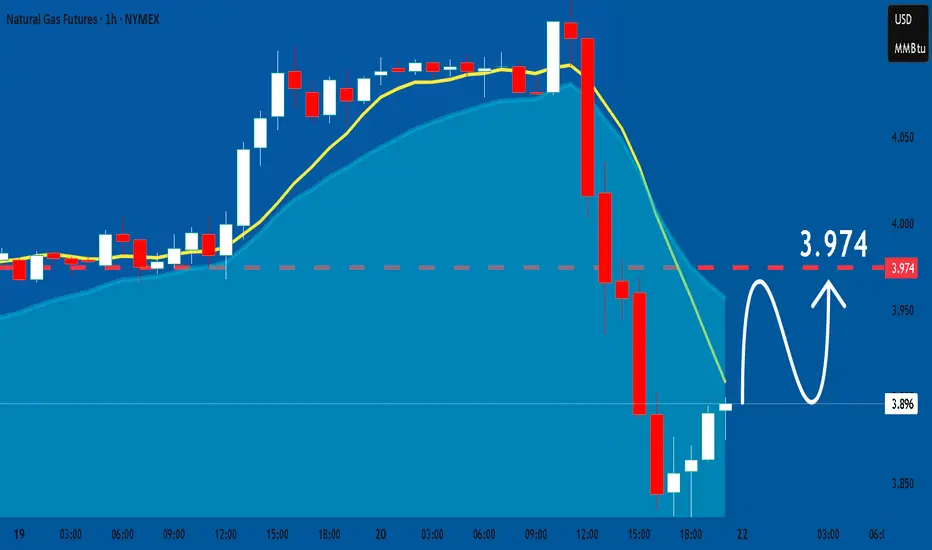
The instrument tests an important psychological level 3.896
Bias - Bearish
Technical Indicators: Supper Trend gives a precise Bearish signal, while Pivot Point HL predicts price changes and potential reversals in the market.
Target - 3.662
Recommended Stop Loss - 4.034
About Used Indicators:
Super-trend indicator is more useful in trending markets where there are clear uptrends and downtrends in price.
Disclosure: I am part of Trade Nation's Influencer program and receive a monthly fee for using their TradingView charts in my analysis.
———————————
WISH YOU ALL LUCK
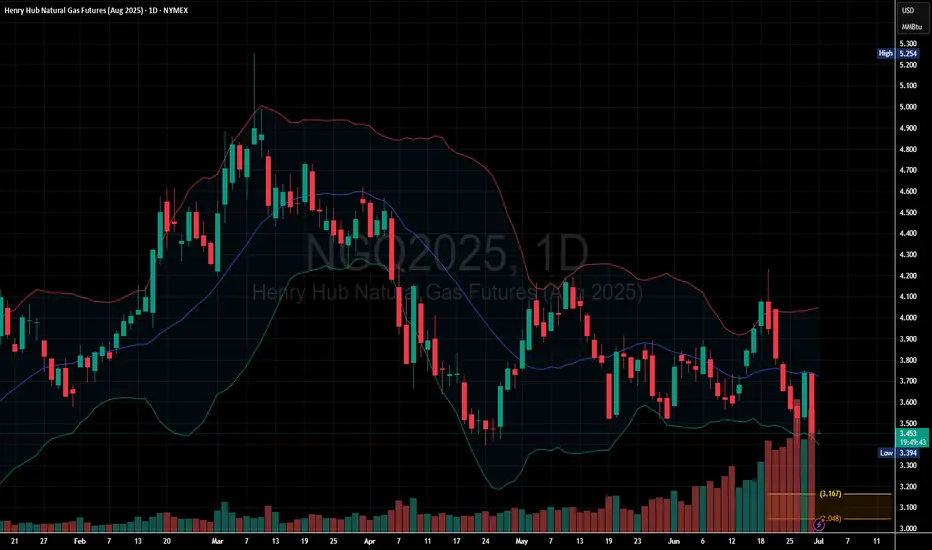
Possible decline in natural gas prices? Possible decline in natural gas prices?
Natural gas futures in the United States fell to $3.40/MMBtu, the lowest level in six weeks, due to increased production and subdued demand. Mild weather conditions reduced heating and cooling needs, favoring above-normal storage injections. On the supply side, average gas production in the 48 contiguous states increased to 105.9 bcfd in June, compared to 105.2 bcfd in May. In addition, LNG export demand weakened, with flows to the eight major US export terminals averaging 14.3 bcfd in June, down from 15.0 bcfd in May.
The European gas market is also experiencing a significant downturn. European natural gas futures fell more than 10% to €33.3 per megawatt hour, reaching their lowest level in over a week, following the announcement of a ceasefire between Iran and Israel by US President Donald Trump.
The importance of weather conditions
Meanwhile, weather forecasts indicate a mixed picture across Europe. A heatwave is affecting the southern and western regions of the continent, with temperatures reaching 40°C in Madrid and 36°C in Zagreb, likely increasing electricity use for cooling. However, cooler and stormy conditions are expected in the Nordic countries and Eastern Europe due to a low-pressure system extending from Germany to the Baltic States.
The situation continues to deteriorate, with high production generating a surplus of supply on the market. This scenario could lead to new historic lows in prices, especially if the summer turns out to be cooler than expected. Analysis of the futures curve also provides negative indications. The curve is in a state of amplified contango, which occurs when demand is weak and supply is excessive.
Production is high
The shape of the futures curve is of considerable importance to speculators and investors seeking to mitigate risk through the purchase of commodities. It provides relevant indications of both the current state of the commodity market and its future prospects.
From a technical standpoint, the situation is negative: recent declines have been accompanied by above-average volumes, and prices are below the 200-period moving average. In light of this, we do not recommend buying natural gas, as prices are expected to reach new historic lows in the coming months.
However, it is important to consider that there is a current condition that could favor energy sector commodities.
The US dollar continues to weaken. Therefore, if I were to buy an energy sector commodity right now, I would opt for oil. Oil is generally priced in dollars on international markets, which means that when the value of the dollar falls, the price of oil tends to rise. This dynamic occurs mainly because a weaker dollar makes oil less expensive for buyers using other currencies, thus increasing demand and, consequently, the price.
The importance of a weak dollar
In addition, geopolitical events, such as conflicts in oil-producing regions, can affect both the price of oil and the value of the dollar. For example, tensions in the Middle East can lead to higher oil prices.
It is essential to monitor the geopolitical situation in the Middle East on a daily basis and analyze oil inventory data on a weekly basis to understand whether the market will continue in its current deficit phase. I expect a prolonged sideways phase for oil prices; therefore, it may be appropriate to invest in an undervalued oil sector stock that distributes dividends.
Gold | Oil | Dollar | Silver | Natural Gas Price Forecast.Gold | Oil | Dollar | Silver | Natural Gas Price Forecast.
NYMEX:NG1! COMEX:GC1! AMEX:UNG COMEX:SI1!

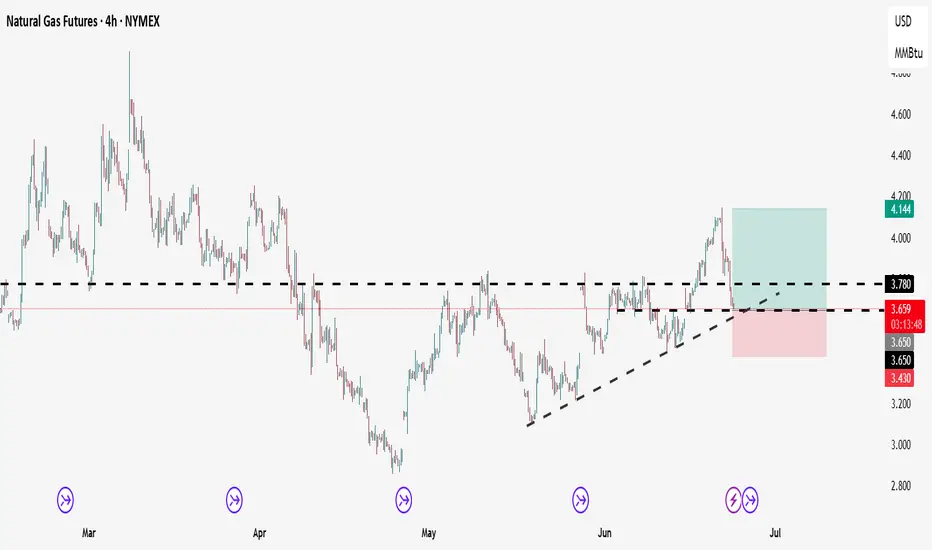
NG1!: Target Is Down! Short!
My dear friends,
Today we will analyse NG1! together☺️
The in-trend continuation seems likely as the current long-term trend appears to be strong, and price is holding below a key level of 3.745 So a bearish continuation seems plausible, targeting the next low. We should enter on confirmation, and place a stop-loss beyond the recent swing level.
❤️Sending you lots of Love and Hugs❤️
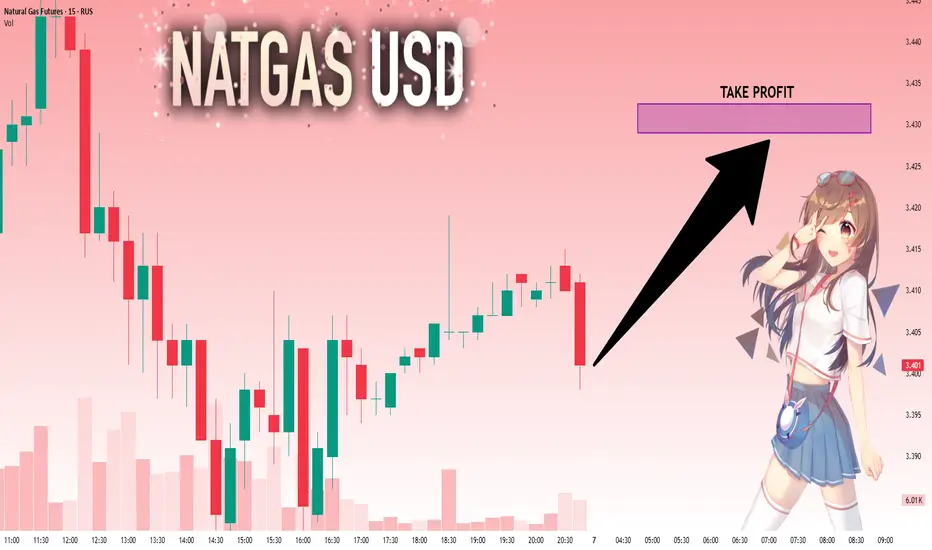
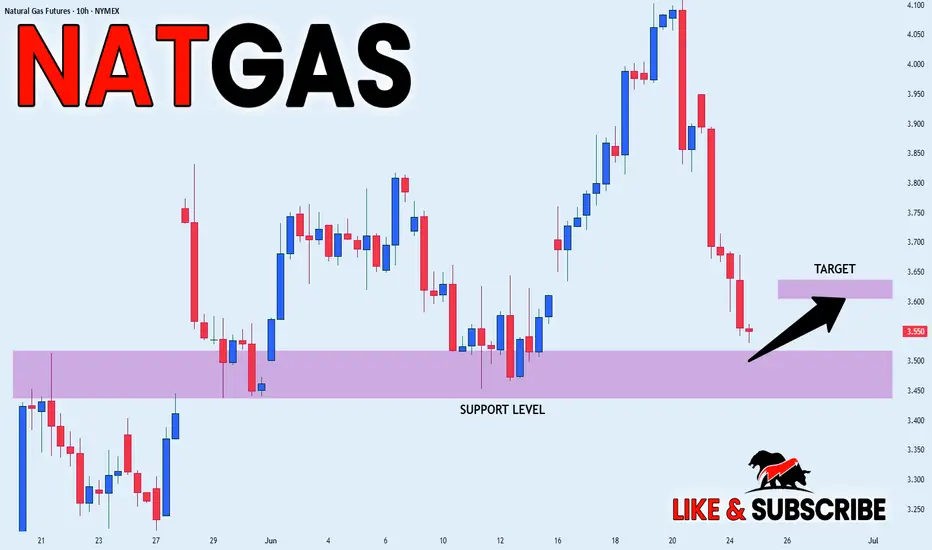
NATGAS SUPPORT AHEAD|LONG|
✅NATGAS is going down now
But a strong support level is ahead at 3.450$
Thus I am expecting a rebound
And a move up towards the target of 3.600$
LONG🚀
✅Like and subscribe to never miss a new idea!✅
Disclosure: I am part of Trade Nation's Influencer program and receive a monthly fee for using their TradingView charts in my analysis.
NATGAS Long setupIf you like my Idea, Don't forget to Boost and comment on my Analysis. The recommendations are purely for educational purpose only, consult you financial advisor before trading.
Natural Gas | Oil | Dollar | Silver | Gold Price Forecast.Natural Gas | Oil | Dollar | Silver | Gold Price Forecast.
NYMEX:NG1! NYMEX:CL1! COMEX:GC1! COMEX:SI1!

NATGAS: Expecting Bullish Movement! Here is Why:
Remember that we can not, and should not impose our will on the market but rather listen to its whims and make profit by following it. And thus shall be done today on the NATGAS pair which is likely to be pushed up by the bulls so we will buy!
Disclosure: I am part of Trade Nation's Influencer program and receive a monthly fee for using their TradingView charts in my analysis.
❤️ Please, support our work with like & comment! ❤️