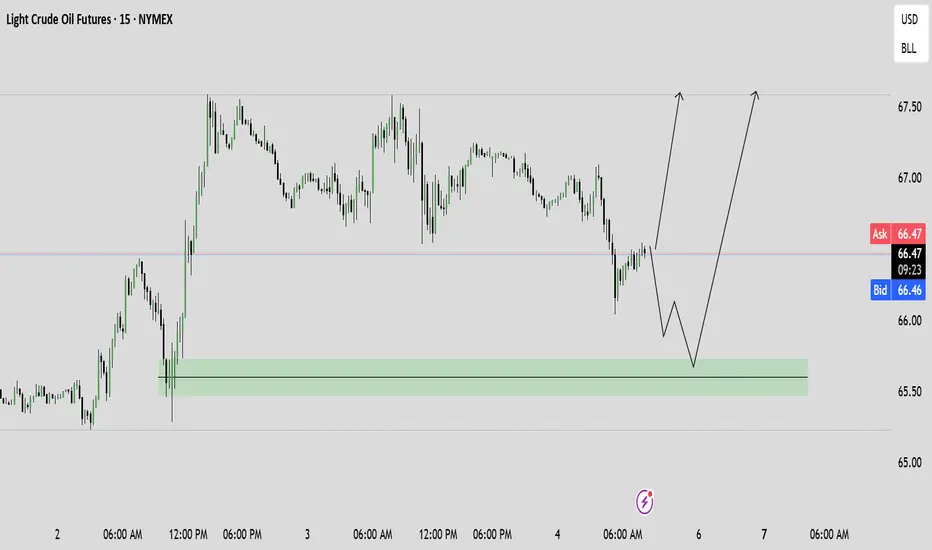
US OILBullish move might continue on US OIL from our zone, can look for confirmation before entry and target Buyside.
MCLQ2028 trade ideas
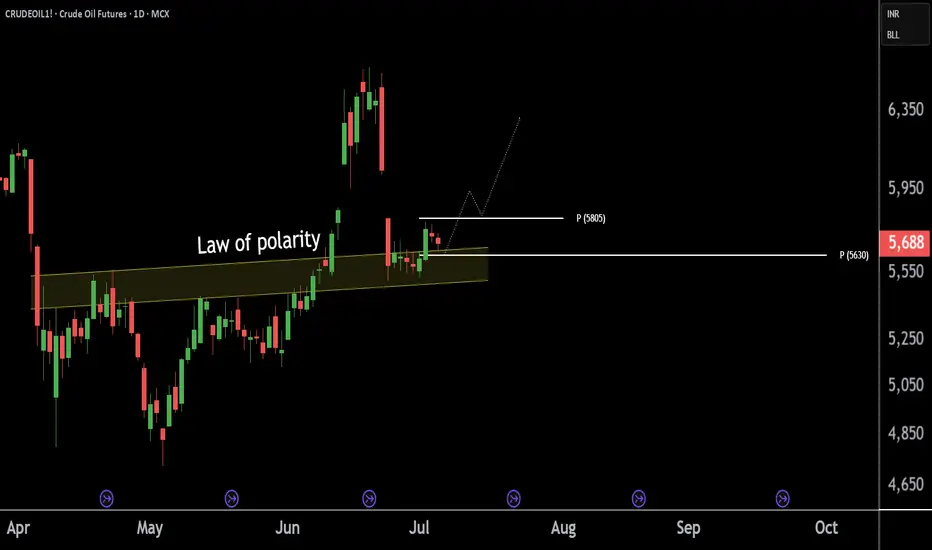
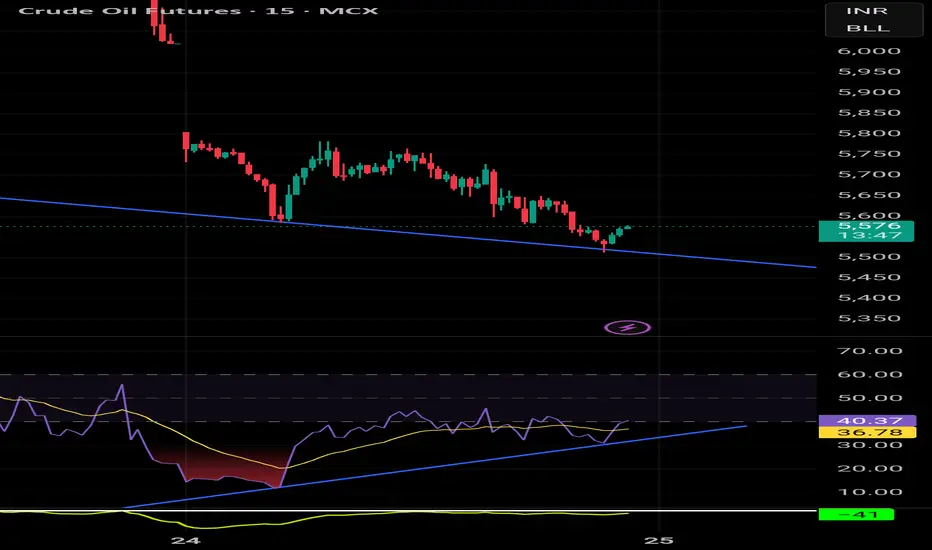
CRUDEOIL1! at Best Support Zone !!This is the Daily Chart of CRUDEOIL1!.
CRUDEOIL1! having a good law of polarity at 5500-5600 level .
CRUDEOIL1! is currently trading between its quarterly pivot 5603 level and monthly pivot 5805 levels , indicating a range-bound movement."
Once the Crudeoil1! sustains above the monthly pivot, it may trigger a potential upside rally."
If this lop is sustain , then we may see higher prices in CRUDEOIL1!
Thank You !!
Oil Went Back to 'Pre-conflict' Level on Israel-Iran Ceasefire The Israel-Iran ceasefire has triggered a sharp reversal in global oil markets, sending prices tumbling back to levels seen before the recent conflict. Brent crude ICEEUR:BRN1! fell below $70 per barrel and West Texas Intermediate NYMEX:CL1! dropped to around $65, erasing the risk premium that had built up during nearly two weeks of hostilities. This rapid decline—nearly 17% from the conflict’s peak—reflects investor relief that the threat of major supply disruptions, especially through the vital Strait of Hormuz, has receded for now.
However, the outlook remains uncertain. While the ceasefire has calmed immediate fears, the truce is fragile, with both sides accusing each other of violations within hours of its announcement. Shipping activity through the Strait of Hormuz is still subdued, insurance costs for tankers remain elevated, and some shipowners are steering clear of the region, indicating persistent caution in energy logistics.
If the ceasefire holds, markets may stabilize further, supporting global economic recovery and easing inflationary pressures.
But any renewed escalation or disruption in the Strait of Hormuz could quickly reverse these gains, keeping energy markets on alert for further geopolitical shocks.
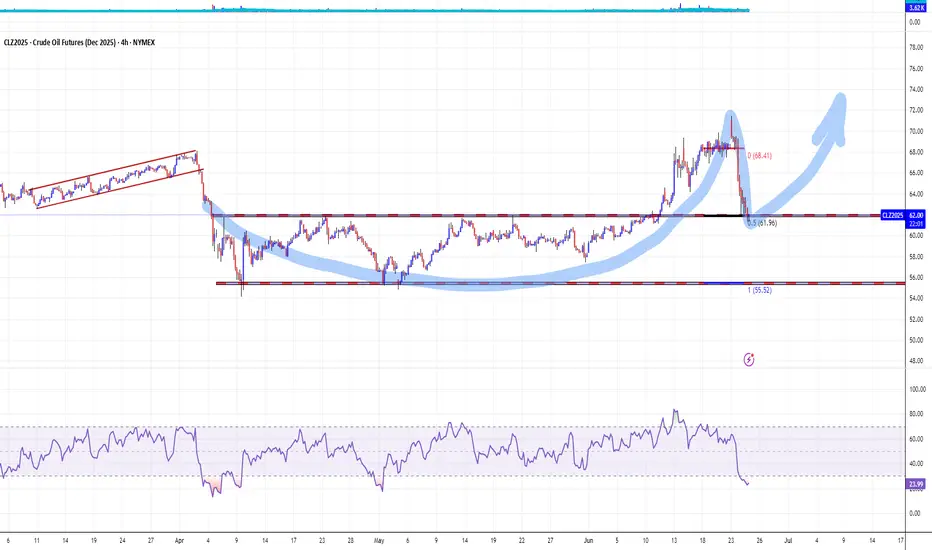
The main technical graph for Dec'25 WTI Futures NYMEX:CLZ2025 indicates on 'cup and handle' technical structure with the nearest support around $62 per bll, and further 'double top' price action in upcoming development.
--
Best wishes,
@PandorraResearch Team 😎
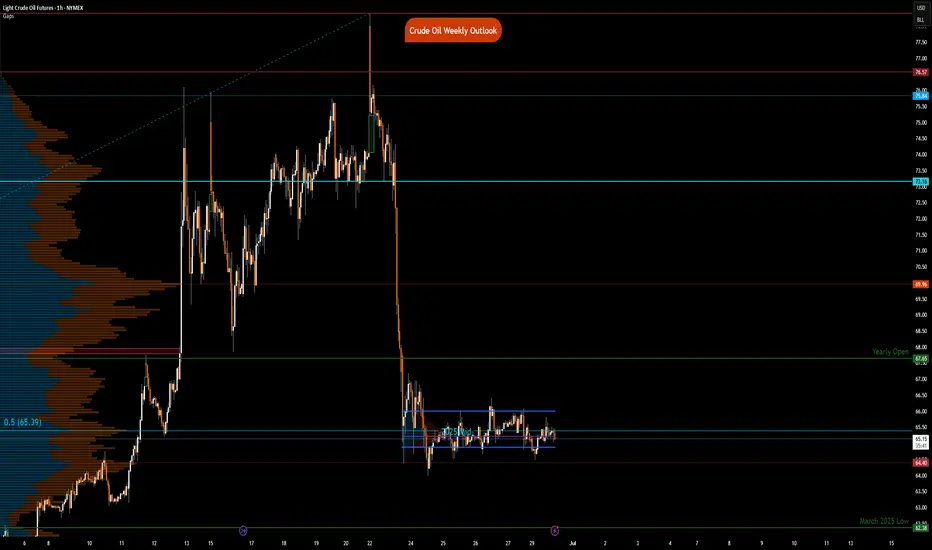
Crude Oil Weekly OutlookNYMEX:CL1! NYMEX:MCL1!
With Nasdaq futures hitting all-time highs, our attention now turns to Crude Oil, which has seen a sharp pullback over the past week.
All-time highs in equity indices present a unique challenge:
There are no historical reference points—no prior price or volume data to lean against. Traders typically turn to tools like Fibonacci extensions, measured moves, or rely on market-generated information and emerging intraday levels before making decisions.
What Has the Market Done?
Crude Oil Futures (CL) posted a record drop last week, falling sharply from a Sunday open high of $78.40 to a Monday close low of $64.38—a $14.02 decline.
This sharp sell-off followed developments suggesting a potential Iran–Israel ceasefire and the end of a two-week conflict, prompting markets to rapidly unwind the geopolitical risk premium.
What is it trying to do?
CL Futures have since consolidated around the 2025 mid-range. The market appears to be in a balancing phase, digesting the removal of war-related premiums and recalibrating based on fundamentals.
How Good of a Job Is It Doing?
Having effectively priced out war risk, the market is now refocusing on fundamentals.
The global demand outlook is improving, driven in part by progress in trade deals.
OPEC’s June Monthly Oil Market Report (MOMR) forecasts global oil demand growth of 1.3 mb/d for 2025.
This transition from headline risk to fundamental drivers indicates market maturity and resilience, albeit within a still-volatile regime.
What Is More Likely to Happen From Here?
Today marks the final trading day of the month, and seasonal demand will become increasingly relevant.
Summer weather and travel activity are expected to drive demand for jet fuel and gasoline.
These seasonal tailwinds, if sustained, could help stabilize price action around key technical zones.
Key Levels:
yOpen: 67.65
pHi: 66.09
pIB Hi: 66
2025 mid-range: 65.39
pLow: 64.80
Overnight Low: 64.55
Naked VPOC: 64.50
Scenario 1: Continued Consolidation (Balance Holds)
Crude oil maintains range-bound behavior.
Strategy: “Outside-in” trading—fade moves at range extremes until new directional information emerges.
Scenario 2: Break from Balance
If directional conviction builds, price could break the current consolidation.
Upside target: Yearly open near $67.65.
Downside risk: March 2025 low if $64.40 fails.
All intraday levels noted above should be monitored for structure and participation.
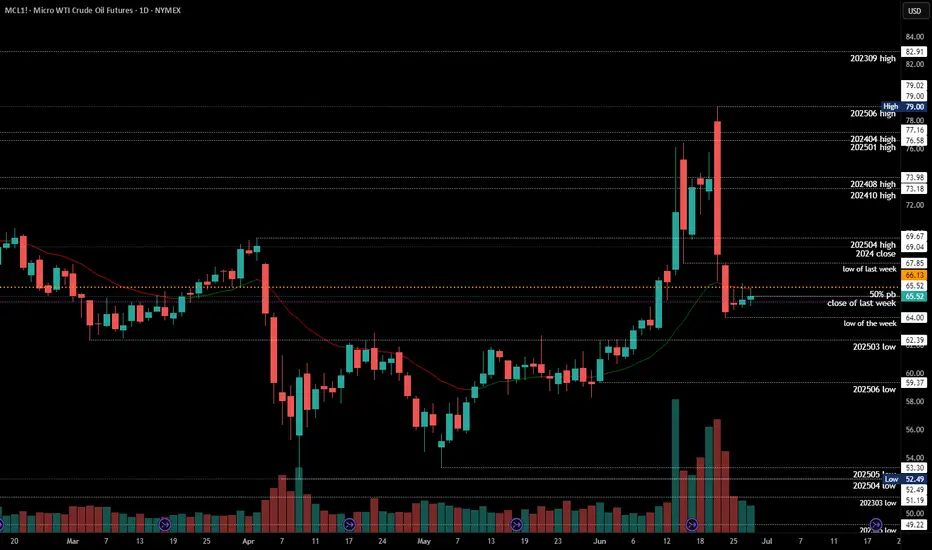
#202526 - priceactiontds - weekly update - wti crude oil futuresGood Day and I hope you are well.
#mcl1 - wti crude oil futures
comment: Yeah I don’t know about this one. Your guess is as good as mine. I could even see this touching 63 before going higher again. Most erratic and extreme price action the past 2 weeks, so maybe wait a bit before jumping the train here.
current market cycle: trading range
key levels: 63 - 80
bull case: Bulls don’t have much. They could not close one decent bar at the high since 2025-06-11 and despite all the bull spikes, we only sold afterwards and are back below 65 where the extreme breakout happened. Best guess here is that we stay above 63 and go sideways. Sideways up to where? No idea. Could be 68, could be 70.
Invalidation is below 63
bear case: Too extreme. Both sides have to take quick profits or the next spike will take them away again. So most likely sideways in a range until a newsbomb hit again. Range could be 63 - 68.
Invalidation is above 79
short term: Neutral. Not touching this unless someone threatens me with a gun.
medium-long term - Update from 2025-06-22: Let’s leave this as “todo” for now. No read on this and I won’t make stuff up just to post something.
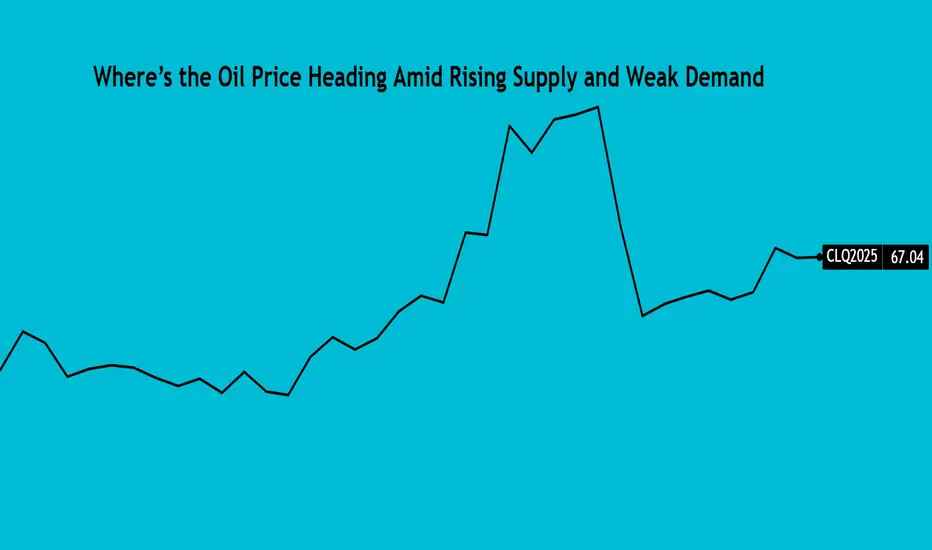
Where’s the Oil Price Heading Amid Rising Supply and Weak DemandThe eight oil-producing nations of OPEC+ agreed to raise output in August, opting for a larger-than-expected increase. OPEC+ cited a steady global economic outlook and healthy market fundamentals. The crude oil market remains under pressure from subdued prices, persistent supply growth, and uncertain demand prospects.
WTI SOARED ON CONFLICT, SANK JUST AS FAST ON CEASEFIRE
June saw heightened volatility in WTI crude prices, driven by a short-lived conflict between Israel and Iran. Prices surged from USD 68/b on 12/Jun (one day before Israel struck Iran) to a five-month high of USD 78.40/b on 23/Jun, following the U.S. strike on three Iranian nuclear facilities.
Fears of a potential closure of the Strait of Hormuz, a critical chokepoint for ~20% of global oil flows, amplified the rally.
However, prices swiftly retreated as a ceasefire was announced within 24 hours. The rapid de-escalation erased most of the geopolitical risk premium, pushing crude back toward pre-conflict levels. Implied volatility and skew also dropped.
Source: CME CVOL
While flare-ups like Iran halting cooperation with the U.N. nuclear watchdog on 02/Jul (Wed) briefly lifted WTI prices but a surprise U.S. inventory build quickly capped the gains.
Overall, June’s rally was driven by geopolitical shocks, not sustained fundamentals. Oversupply concerns remain dominant.
OPEC+ ACCELERATES OUTPUT RESTORATION EVEN AS DEMAND WORRIES LOOM
With geopolitical tensions easing, market attention has shifted back to supply-demand fundamentals. Global oil demand remains sluggish, heightening concerns of a potential oversupply, especially as OPEC+ continues to unwind its production cuts.
On 05/Jul (Sat), eight key members of the OPEC+ alliance—Saudi Arabia, Russia, the UAE, Iraq, Kuwait, Kazakhstan, Algeria, and Oman met virtually and agreed to raise oil output in August. Instead of the anticipated 411,000 bpd increase, the group opted for a steeper hike of 548,000 bpd.
OPEC+ has been curbing output since 2022 to support prices. However, the alliance began reversing course this year to regain market share, amid rising competition from non-OPEC producers and pressure from Washington to help ease fuel prices.
This group began unwinding the voluntary cut of 2.2 million bpd in April. The original plan was to gradually increase production by 137,000 bpd each month through September 2026. Yet, after only one month at that pace, the group accelerated the process, tripling the monthly hike to 411,000 bpd for May, June, and July.
As of August, OPEC+ will have restored 1.92 million bpd of the 2.2 million bpd initially cut, leaving just 280,000 bpd to be brought back.
Following years of output cuts to stabilize prices, OPEC+ is now focused on expanding its market share as global supply competition intensifies.
DEMAND SIGNALS FLASH UNSEASONAL SUMMER WEAKNESS
Recent data paints a bearish demand picture. U.S. crude inventories unexpectedly rose by 3.8 million barrels in the week ending 27/Jun, defying forecasts of a 3.5 million-barrel draw.
A build during peak summer signals weak consumption. Gasoline demand fell to 8.6 million bpd, while stockpiles surged by 4.2 million barrels exceeding expectations of a 0.7 million barrel build.
Source: EIA and Investing.com
Adding to concerns, the U.S. labour market showed signs of strain, with private payrolls unexpectedly dropping by 33,000 in June, according to the ADP report . Analysts had expected private payrolls to rise by 99,000. The soft employment data suggests broader economic weakness that could further dampen fuel use.
China offered a rare positive note, with its Caixin Manufacturing PMI returning to expansion (above 50) in June on stronger orders and output. However, the rebound is unlikely to meaningfully shift the global demand narrative.
WTI TECHNICALS SIGNAL SUSTAINED BEARISH MOMENTUM
As prices retreated from five-month highs post-ceasefire, technical signals turned bearish, a death cross formed on 02/Jul as the 21-day DMA crossed the 9-day DMA, reinforcing downside momentum.
Meanwhile, uncertainty over potential U.S. tariffs after the 09/Jul (Wed) deadline continues to cloud trade and demand outlooks.
Prices slipped below the 150-day SMA on 24/Jun and have held beneath it since, reinforcing the bearish trend.
A bearish MACD and fading RSI underscore continued weakness in WTI prices.
HYPOTHETICAL TRADE SETUP
While the medium-term outlook for WTI remains bearish, the coming week could see heightened volatility driven by two key factors: OPEC+’s larger-than-expected production increase and the U.S. tariff decision due on 09/Jul (Wed).
Although the accelerated OPEC+ supply hikes are priced in, downward pressure on prices is likely to persist. Meanwhile, the U.S. tariff decision adds a layer of uncertainty; any escalation or renewal of tariffs could weigh further on oil prices, while a rollback might offer temporary support.
Aside from another geopolitical shock, upside risks remain limited. In this context, a long straddle is a prudent strategy to capture potential sharp price swings in either direction.
Source: CME QuikStrike
This paper proposes a long straddle strategy using the Monday weekly WTI crude oil options expiring on 14/Jul (ML2N5), designed to benefit from heightened volatility regardless of price direction.
The position involves purchasing a USD 66.50/b call and a USD 66.50/b put, resulting in breakeven levels at USD 63.58/b and USD 69.42/b. The total cost of the trade is a net premium of USD 2.92/b, or USD 2,920 per contract.
The strategy offers unlimited upside potential if prices move beyond the breakeven levels, while the maximum loss is limited to the premium paid.
The accompanying chart, generated via CME Group’s QuikStrike Strategy Simulator , provides a detailed visualization of the strategy’s performance under various market scenarios.
MARKET DATA
CME Real-time Market Data helps identify trading set-ups and express market views better. If you have futures in your trading portfolio, you can check out on CME Group data plans available that suit your trading needs tradingview.com/cme .
DISCLAIMER
This case study is for educational purposes only and does not constitute investment recommendations or advice. Nor are they used to promote any specific products, or services.
Trading or investment ideas cited here are for illustration only, as an integral part of a case study to demonstrate the fundamental concepts in risk management or trading under the market scenarios being discussed. Please read the FULL DISCLAIMER the link to which is provided in our profile description.
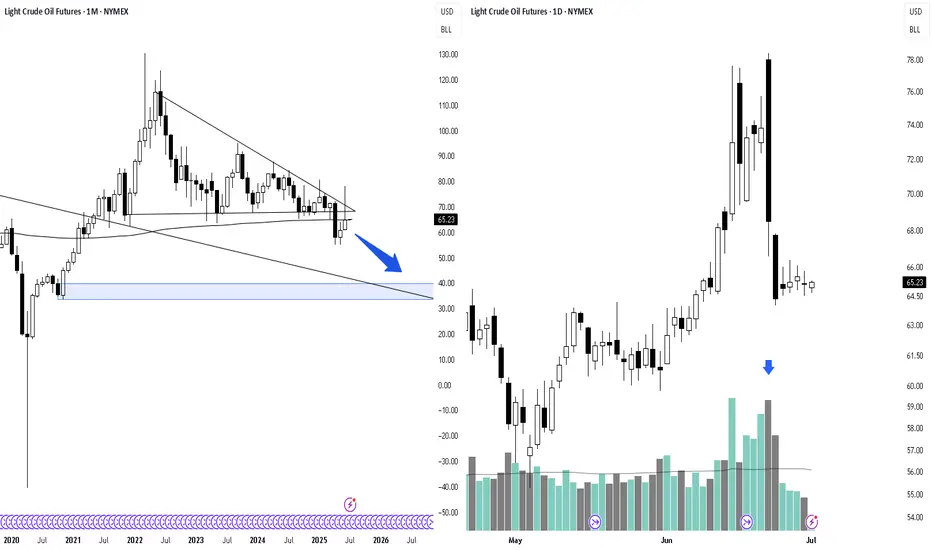
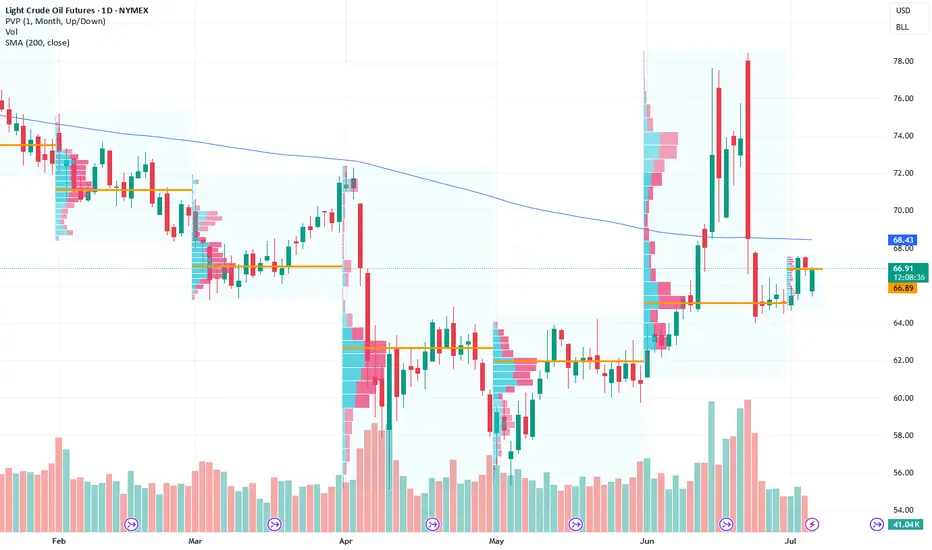
40–50% Decline Possible for Crude OilLight Crude Oil Futures broke below a descending triangle and re-tested the breakdown level on volume twice as high as the 50 day moving average (daily chart). I anticipate a 40–50% decline to approximately $30–40 over the next 6–12 months, despite geopolitical tensions in the Middle East. This move aligns with a broader macro correction. Long-term, I remain bullish on oil.
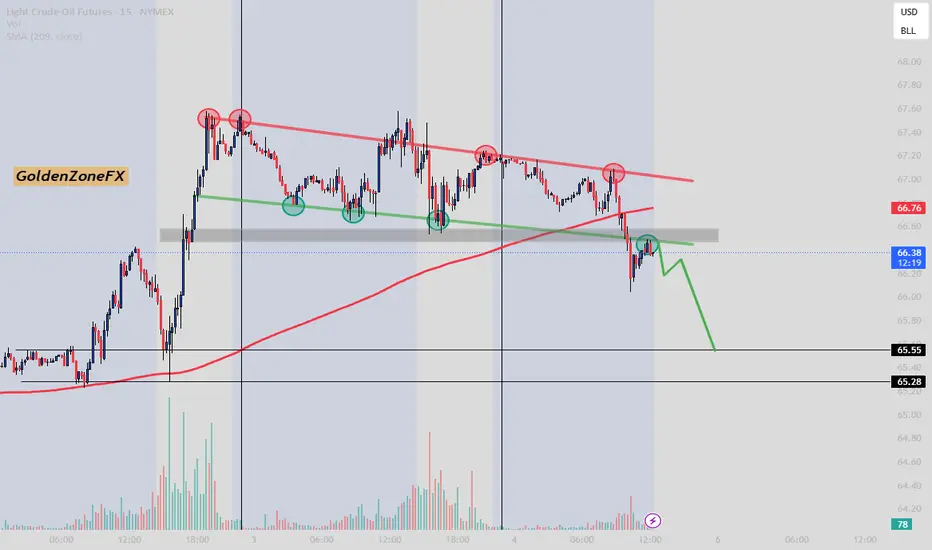
Crude Oil and the BOS bearish move might steps in?Watching the volume rising is a good confirmation for the Bearish Bias.
Follow @GoldenZoneFX For more Content and valuable insights.
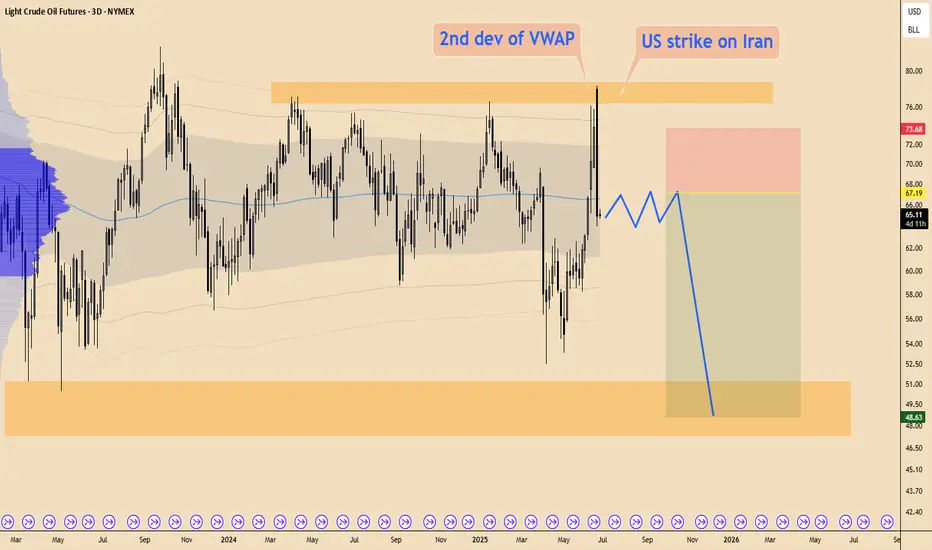
OIL - is going to hit $50I expect the drop in OIl will go on
During such big news as potential WW3 price bararly rose
Also on bigger time frame price only reached 2nd vwap deviation
that's why after some consolidation price will go down toward range LOW
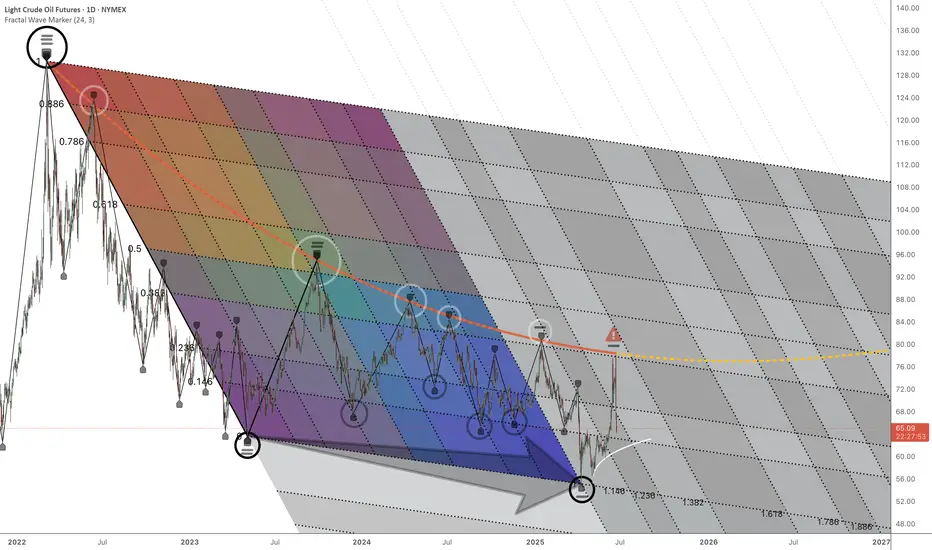
CL1! Structural NarrativeResearch Idea
If look we beyond surface appearances, we would ask what kind of iterative, generative, or probabilistic mechanisms could have created those movements. Complexity can arise from simplicity, and that what looks messy may follow deep mathematical logic.
We can see the curve that connects series rejections that exposes where selling pressure extends compression until broken.
Another pattern would be current price expressed as a fibonacci ratio of a broader cycle as it splits them into phases.
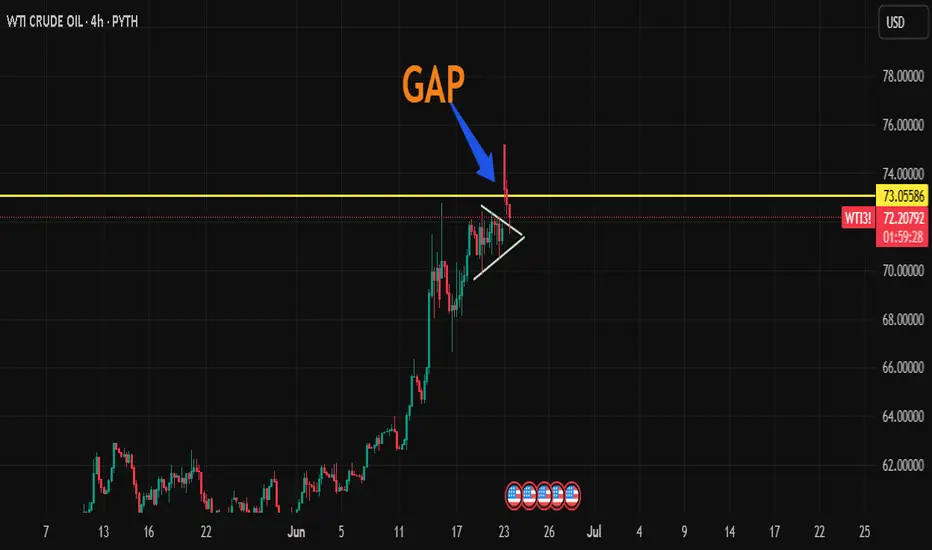
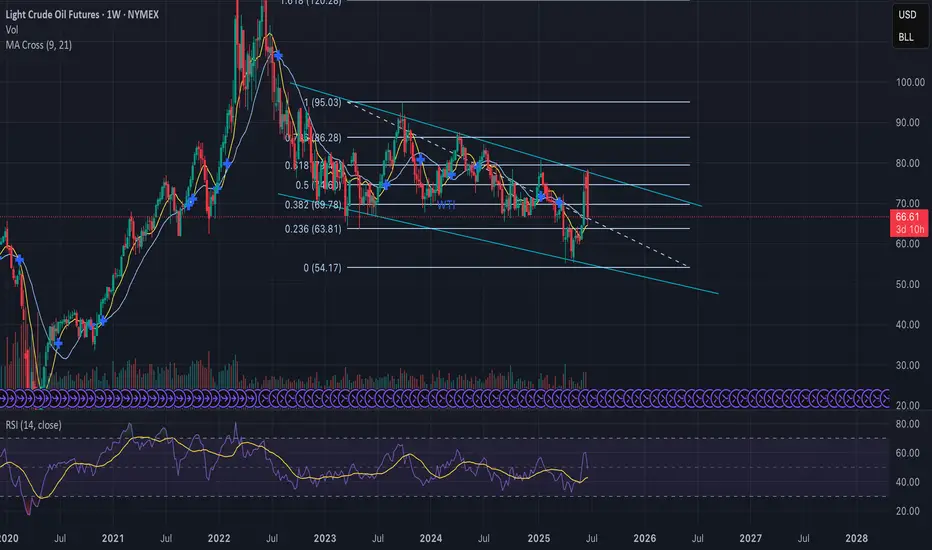
Oil Price: Breakout or Fakeout? Watch This Zone Closely Technical Overview:
The current price action is testing the upper boundary of a descending wedge, a bullish reversal pattern. The recent strong green candle indicates a potential breakout attempt, yet price is hovering near a critical resistance level at $74.20 (Fib 0.5).
Key levels from the Fibonacci retracement are:
🔼 Resistance at $74.20 (0.5), then $78.16 (0.618)
🧲 Local support at $69.78 (0.382)
🛡️ Strong demand zone near $63.81 (0.236) if rejection occurs
Structure + Patterns:
Price has been compressing inside a falling wedge, which statistically resolves to the upside.
The breakout candle broke above the 20 EMA and touched the upper wedge resistance — signaling a decision point.
Volume is rising on bullish candles — initial confirmation of buyer interest, but not yet decisive.
Scenarios to Watch
Bullish Case:
Break and close above $74.20 on higher volume → likely move toward $78–$86 resistance zone.
Confirmation of wedge breakout could trigger trend reversal, aligning with bullish fib levels.
Momentum could accelerate if macro factors support demand (see geopolitics below).
Bearish Case:
Failure to close above $74.20 = fakeout risk → price may reject down to $69.78 or even retest $63.81.
Bearish rejection wick on the daily/4H would be an early signal.
Macro & Geopolitical Factors to Monitor:
Middle East Tensions: Any escalation (especially around Iran or shipping lanes) could spike oil due to supply fears.
US Strategic Reserves & Elections: Moves to refill reserves or control inflation could support demand.
China Demand Recovery: Data showing improved industrial output or stimulus from PBoC may strengthen global oil outlook.
Final Thoughts:
Price is at a pivot zone — breaking this wedge with strength could shift the short-to-midterm trend. Until then, this remains a "show me" breakout . Watch how the next 1–2 weekly candles close around the $74–$75 area to confirm direction.
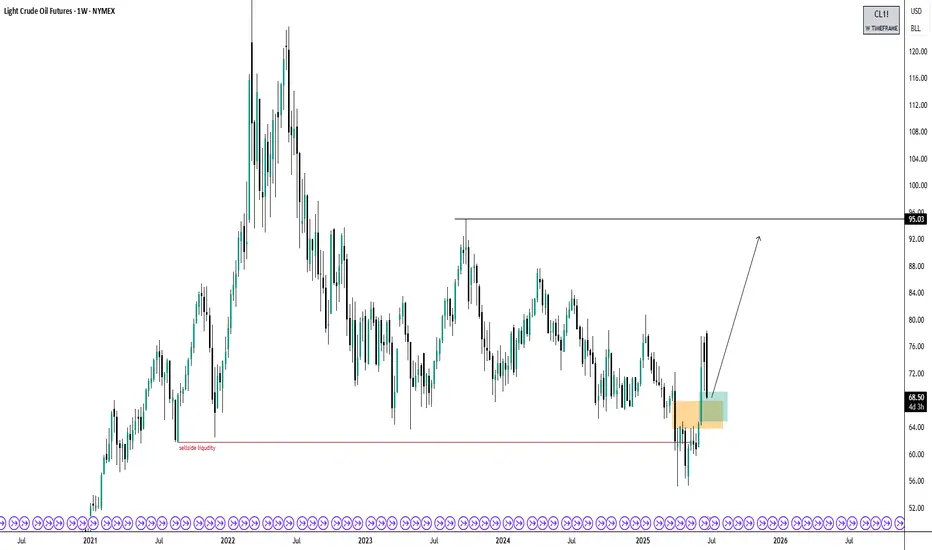
Crude Oil Bullish BiasThree years ago, I predicted that oil would trade below $61 when the price was around $118. Price traded to $55 and is now up to $68. I now believe price has exhausted sell-side liquidity and will trade higher, possibly seeing $95 and beyond.
*Not financial advice
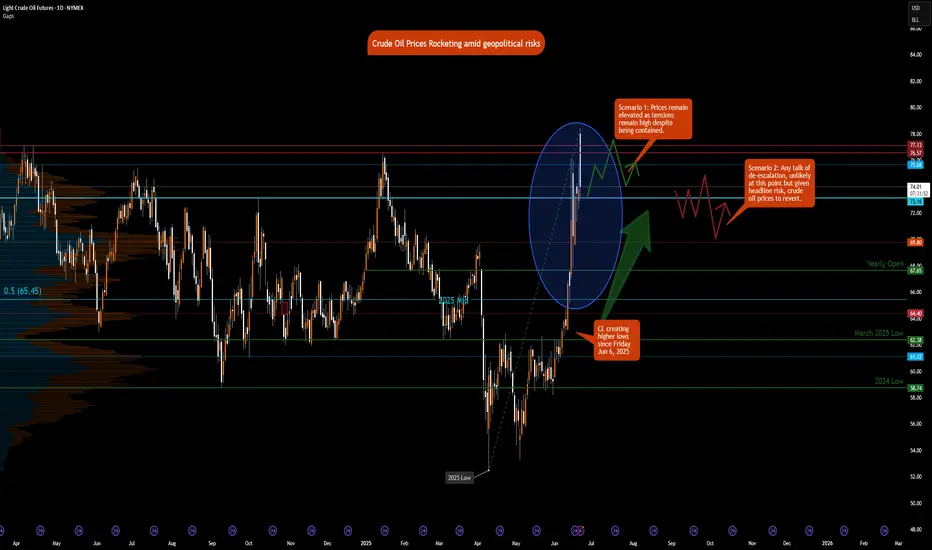
Crude Oil Prices Rocketing amid geopolitical risks
NYMEX:CL1! NYMEX:MCL1! NYMEX:BZ1!
Macro:
Geopolitical tensions remain high and markets are now likely to price in our scenario discussing ongoing air and missile war, given one-off intervention from the US thus far. According to Reuters, the U.S. now assesses that Iranian retaliation could occur within the next two days.What happens next is anybody’s guess but as traders, it is important to navigate these uncertainties with scenario planning and/or reduce risk to account for increased volatility.
We also get Services and Manufacturing PMI data today and PCE Price Index on Friday. Chair Powell is set to testify on Tuesday 9am CT.
Key levels:
Jan 2025 High: 76.57
2025 High: 78.40
2025 CVAH(Composite Value Area High): 75.68
Key LIS zone: 73.50-73.15
We anticipate the following scenarios in crude oil:
Scenario 1:
Prices remain elevated as tensions remain high, despite limited retaliation, however, the situation overall now escalated beyond return to diplomacy.
Scenario 2:
Any push towards de-escalation, unlikely in our analysis, but given the headline risk, crude prices may remain volatile and come off the highs.
Given our key LIS (Line in Sand) zone above, we favor longs above this and shorts below this zone.
CRUDE OIL poised to go UP AGAIN? Usually my posts on crude oil are short. but here’s a longer one for a change.
Back in December, I predicted that crude oil would hit the highlighted zone around $57. That’s exactly what happened, hit the target and bounced.
Over the past two weeks, we’ve seen wild swings in crude oil prices as tensions between Iran and Israel escalated. But now, following the ceasefire announcement brokered by President Trump, and considering Iran’s response over the past couple of days, crude oil has dropped below its pre-conflict price levels.
While I truly hope for a peaceful world where no innocent lives are harmed, my personal view is that this ceasefire feels fragile and may not last long.
So, what’s next for crude oil? Up or down?
If the ceasefire holds and we don’t see further conflict in the Middle East, I think crude oil could hover in the $65–$75 range. There’s even a slim chance we dip as low as $45.
However, based on my technical analysis model, and my doubts about the durability of the ceasefire, I expect oil prices to rise in the next 6 to 9 months. My targets? $78 and $85.
Of course, I might be wrong this time. :)
Cheers!

Crudeoil bullish momentum coming with help of technicals Crudeoil creating RSI divergence
THE MOVEMENT WILL COME AFTER RSI CROSS ABOVE 55
Crude Oil: Key Breakout Levels Suggest Bullish MomentumCurrent Price: $65.81
Direction: LONG
Targets:
- T1 = $67.45
- T2 = $69.30
Stop Levels:
- S1 = $64.20
- S2 = $62.50
**Wisdom of Professional Traders:**
This analysis synthesizes insights from thousands of professional traders and market experts, leveraging collective intelligence to identify high-probability trade setups. The wisdom of crowds principle suggests that aggregated market perspectives from experienced professionals often outperform individual forecasts, reducing cognitive biases and highlighting consensus opportunities in Crude Oil.
**Key Insights:**
Crude Oil is showing signals of a potential recovery after recent bearish movements. Technical indicators such as the Relative Strength Index (RSI) and Moving Average Convergence Divergence (MACD) demonstrate bullish divergence, suggesting upward momentum could be on the horizon. Additionally, easing geopolitical tensions may stabilize global energy markets, fostering an environment for prices to rally. Supply adjustments by OPEC+ members and ongoing production data are crucial elements to monitor, given their direct impact on crude oil price action.
**Recent Performance:**
In recent sessions, crude oil has seen a rebound following a sharp sell-off. Prices have ranged within a consolidation zone near $65. Global factors, including inflation risks and geopolitical concerns, pressured prices downward before entering a stabilization phase. This recovery is supported by improved market sentiment and reduced volatility linked to energy commodities.
**Expert Analysis:**
Market watchers have noted mixed signals in Crude Oil’s technical chart patterns, where support levels around $64 have held firmly against downward pressure. Some analysts forecast a breakout above $67 in the short term, potentially targeting the $69 range if conditions remain favorable. Factors like increased demand expectations from Asia and continued OPEC+ discipline reinforce bullish sentiment. Conversely, traders should watch for unexpected supply shocks or policy changes that could challenge upward movement.
**News Impact:**
Recent geopolitical developments, particularly reduced tensions in key oil-producing regions, have positively impacted global crude prices. Additionally, expectations of further interest rate moderation by major economies may aid crude oil’s price trajectory by reducing recession risks. The U.S.'s strategic push for renewable energy has had mixed implications for hydrocarbon demand in the short term, underpinning crude oil prices in global markets.
**Trading Recommendation:**
Given current technical setups and improving fundamentals, taking a bullish position on Crude Oil offers a promising opportunity. Key support levels suggest limited downside risk, while near-term targets provide a favorable risk-reward ratio. Traders should focus on the $67.45 mark as an initial upside pivot, with extended gains anticipated at $69.30 under strengthened bullish conditions.
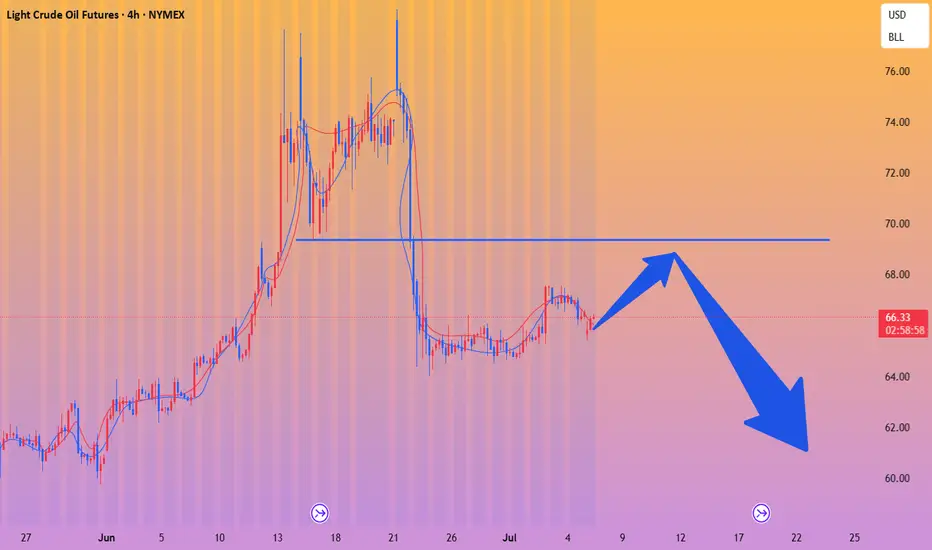
Crude oil------sell near 67.00, target 62.00-60.00Crude oil market analysis:
The recent crude oil daily line began to fluctuate, and entered a stagnant market after a sharp drop. Without the influence of the Middle East situation, it is inevitable that crude oil will start to fall all the way. Crude oil will rebound this week. Pay attention to the suppression of 67.00. Consider selling it close to it. Crude oil rebounds greatly and sells. Sell it when it rebounds slightly. The strong support below is around 63.00 and 60.00.
Fundamental analysis:
Last week, we experienced the Independence Day holiday in the United States, and the suppression of the previous non-agricultural employment data. At present, the data and fundamentals are suppressing gold and crude oil. However, the US dollar did not rise, but kept falling.
Operation suggestion
Crude oil------sell near 67.00, target 62.00-60.00
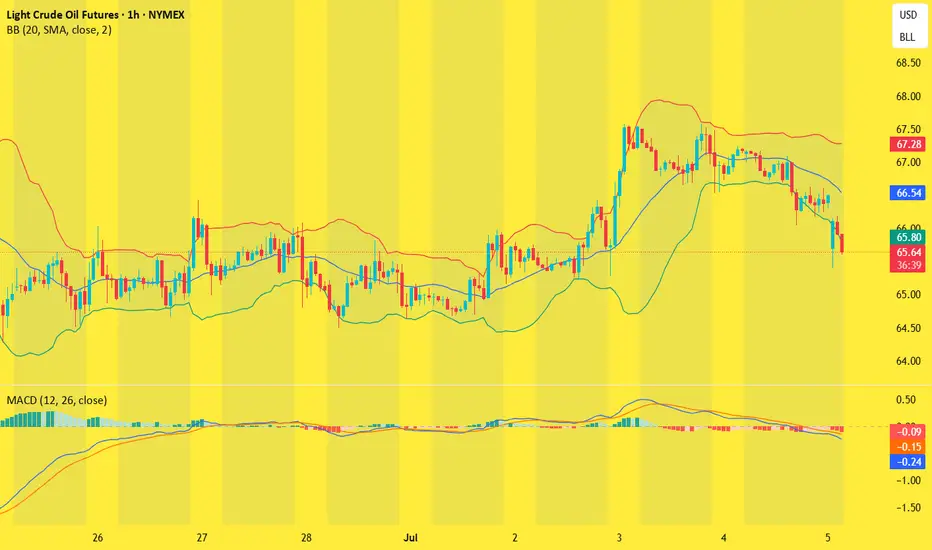
WTI(20250707)Today's AnalysisMarket news:
OPEC+ agreed to increase daily production by 548,000 barrels in August, further accelerating production increases.
Technical analysis:
Today's buying and selling boundaries:
65.73
Support and resistance levels:
66.77
66.38
66.13
65.33
65.08
64.69
Trading strategy:
If the price breaks through 65.33, consider buying, with the first target price of 65.73
If the price breaks through 65.08, consider selling, with the first target price of 64.69
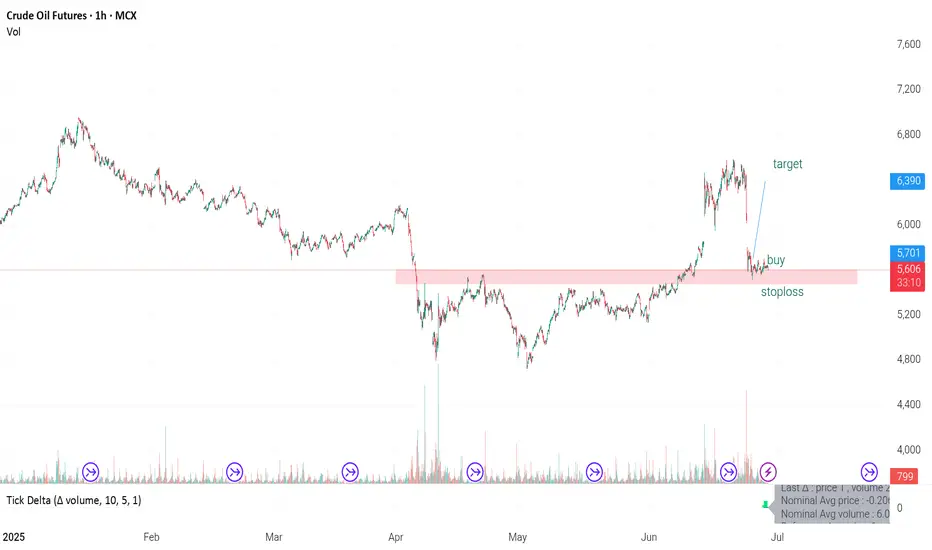
Crudeoil is near a strong support one can buy with a tight stopCrudeoil is near a strong support one can buy with a tight stop
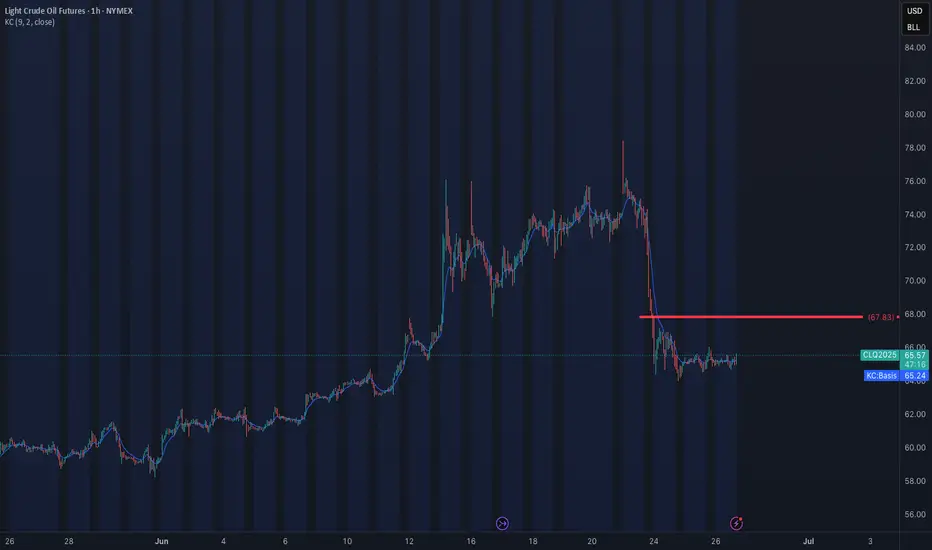
Geopolitical tensions is making oil fun to tradeFor the unexperienced traders, be very careful trading NYSE:CL , you can get caught anytime wether you are long or short right or wrong.
Nevertheless, if you follow my LIS, you can have a clear picture of where oil is heading to.
Right now, oil is set up as bearish but it can change in a matter of a bomb. Jokes aside, the LIS stands at 67.8. So below still bearish, above turn bullish.
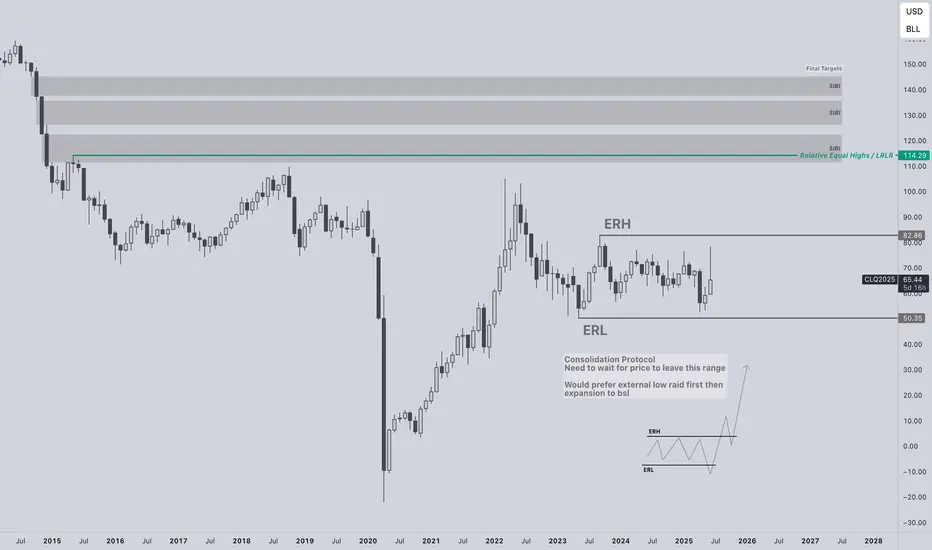
OIL Bullish BiasCurrently sitting on my hands but closely watching oil, especially after Iran & Israel
Consolidation Protocol active. Need to see external range taken. I will not trade inside this range. Favoring longs.
Think accumulation, manipulation, distribution. Right now its in the accumulation phase. Manipulation phase is next. Preferably sweeping external low first then distribution higher to bsl.
Relative equal highs / LRLR at 114.29 first long term target.
Final target are the inefficiencies at 130 - 150.
Crude Oil Testing $75 Resistance with Key Price Movements Targets:
- T1 = $78.00
- T2 = $80.50
Stop Levels:
- S1 = $74.00
- S2 = $72.50
**Wisdom of Professional Traders:**
This analysis synthesizes insights from thousands of professional traders and market experts, leveraging collective intelligence to identify high-probability trade setups. The wisdom of crowds principle suggests that aggregated market perspectives from experienced professionals often outperform individual forecasts, reducing cognitive biases and highlighting consensus opportunities in Crude Oil.
**Key Insights:**
Crude Oil has been holding strong amid mixed macroeconomic data, with traders noting resilience around the $75 price level acting as a key support. Recent production cuts by OPEC+ have further tightened supply, providing support for bullish sentiment. Dollar weakness also boosts commodity prices, as global markets eye policy decisions from central banks.
Additionally, technical indicators suggest upward momentum is building. RSI levels are nearing overbought zones but remain favorable for a continued upward push. Moving averages show upward crossover patterns, signaling strong bullish possibilities.
**Recent Performance:**
Crude Oil has seen fluctuating performance over the last month, with prices rebounding from lows of $72 and climbing steadily to current levels. A temporary pullback earlier in the week was followed by renewed buying interest, demonstrating the strength of underlying bullish sentiment despite volatile macroeconomic conditions.
**Expert Analysis:**
Industry analysts highlight that geopolitical risks and tightening supply conditions could lead to further upward price pressure. The $75.13 level corresponds to a critical juncture that traders are closely watching for breakouts. A breach above this level would likely signal further upside momentum, potentially reaching the $80 mark as broader optimism prevails.
**News Impact:**
Recent news surrounding OPEC+ production strategies and lower inventories in key storage hubs like Cushing have contributed to bullish sentiment. Simultaneously, macroeconomic factors — including U.S. inflation data and Federal Reserve remarks — are influencing crude oil’s directional moves, albeit in a secondary role.
**Trading Recommendation:**
A bullish position is recommended on Crude Oil as it continues to show potential for a breakout above current resistance levels. Traders should aim for targets of $78.00 and $80.50, using stop-loss orders at $74.00 and $72.50 to mitigate downside risks. Current technical setups and macroeconomic signals support upward momentum, making this a favorable opportunity for disciplined trading.
WTI(oil)For oil, what I have in mind, considering the conditions we are in, if the Strait of Hormuz is not closed, we will remain at the same prices, that is, $75 to $80. But if the Strait is closed 100%, the price will go up to $130 and $150 in the short term.