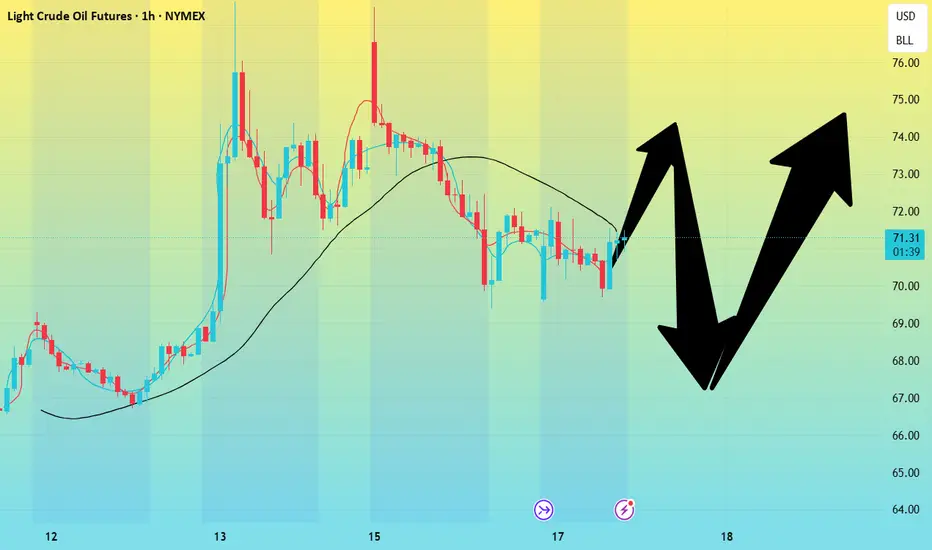
Crude oil---Buy near 71.00, target 76.00-79.00Crude oil market analysis:
We still buy crude oil in the recent daily line, but yesterday's crude oil daily line closed with a big negative line. Short-term crude oil is about to start repairing. The retracement during the repair is our opportunity to buy again. Crude oil follows the long-term trend. In addition, the war between Iran and Israel is a long-term support for crude oil purchases. If the situation escalates, crude oil may easily stand above the 100 mark in the later period. Consider buying crude oil at 71.00 today.
Fundamental analysis:
Yesterday, Iran and Israel began to bomb each other again, and the situation began to escalate.
Operation suggestions:
Crude oil---Buy near 71.00, target 76.00-79.00
TCS1! trade ideas
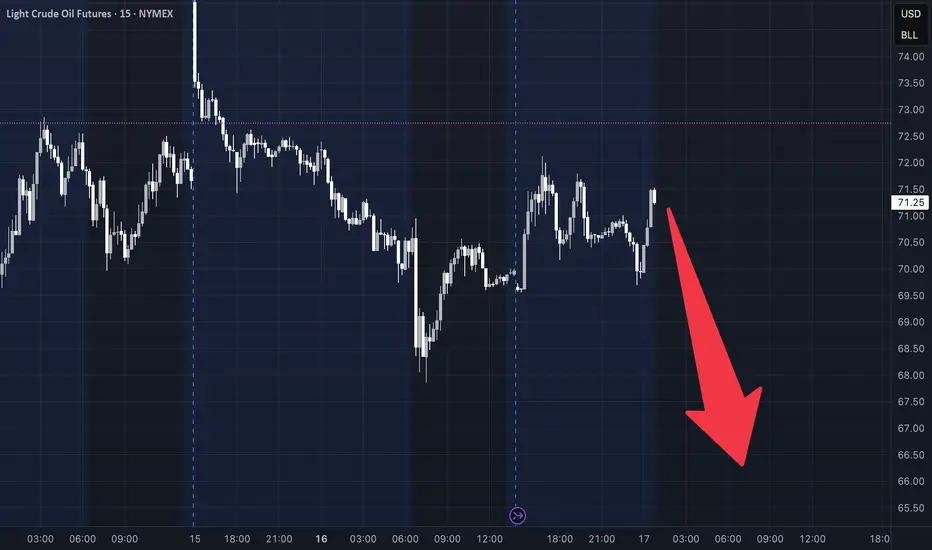
CL Futures Weekly Trade Setup — June 17, 2025🛢️ CL Futures Weekly Trade Setup — June 17, 2025
🎯 Instrument: CL (Crude Oil Futures)
📉 Strategy: Short Swing
📅 Entry Timing: Market Open
📈 Confidence: 68%
🔍 Model Insights Recap
🧠 Grok/xAI – Bearish due to overbought RSI + price stalling near MAs
🤖 Claude/Anthropic – Bearish pullback expected, despite recent strength
📊 Llama/Meta – Overextended Bollinger Band + RSI = short bias
🧬 DeepSeek – Supports downside via divergence + high volatility
⚠️ Gemini/Google – Bullish thesis based on momentum; diverges from consensus
📉 Consensus Takeaway
While short-term momentum is strong, most models forecast a pullback due to:
🔼 Overbought RSI readings
📈 Price extended well above key moving averages
🧨 High volatility and profit-taking zone near $73–$74
✅ Recommended Trade Setup
Metric Value
🔀 Direction Short
🎯 Entry Price $72.65
🛑 Stop Loss $74.20
🎯 Take Profit $68.80
📏 Size 1 contract
📈 Confidence 68%
⏰ Timing Market Open
⚠️ Key Risks & Considerations
🌍 Geopolitical events or OPEC news can cause unexpected surges
📉 If bullish momentum resumes, upside breakout could invalidate short thesis
📏 Risk management is critical—stick to stop-loss if price breaks above $74.20
🧾 TRADE_DETAILS (JSON Format)
json
Copy
Edit
{
"instrument": "CL",
"direction": "short",
"entry_price": 72.65,
"stop_loss": 74.20,
"take_profit": 68.80,
"size": 1,
"confidence": 0.68,
"entry_timing": "market_open"
}
💡 Watch price action at the open. If oil opens weak or fails to reclaim $73, this short setup has a strong edge.
WTI(20250617)Today's AnalysisMarket news:
Revised version of the Republican tax cut bill in the US Senate: It is planned to raise the debt ceiling to 5 trillion, and the overall framework is consistent with the House version.
Technical analysis:
Today's buying and selling boundaries:
70.41
Support and resistance levels:
75.98
73.90
72.55
68.27
66.92
64.84
Trading strategy:
If the price breaks through 72.55, consider buying, and the first target price is 73.90
If the price breaks through 70.41, consider selling, and the first target price is 68.27

WTI(20250616)Today's AnalysisMarket news:
Trump: The United States may still intervene in the Iran-Israel conflict. If Iran launches an attack on the United States, the United States will "fight back with all its strength on an unprecedented scale." Iran and Israel should reach an agreement.
Technical analysis:
Today's buying and selling boundaries:
71.11
Support and resistance levels:
78.59
75.79
73.98
68.24
66.43
63.64
Trading strategy:
If the price breaks through 73.98, consider buying in, the first target price is 75.79
If the price breaks through 71.11, consider selling in, the first target price is 68.24

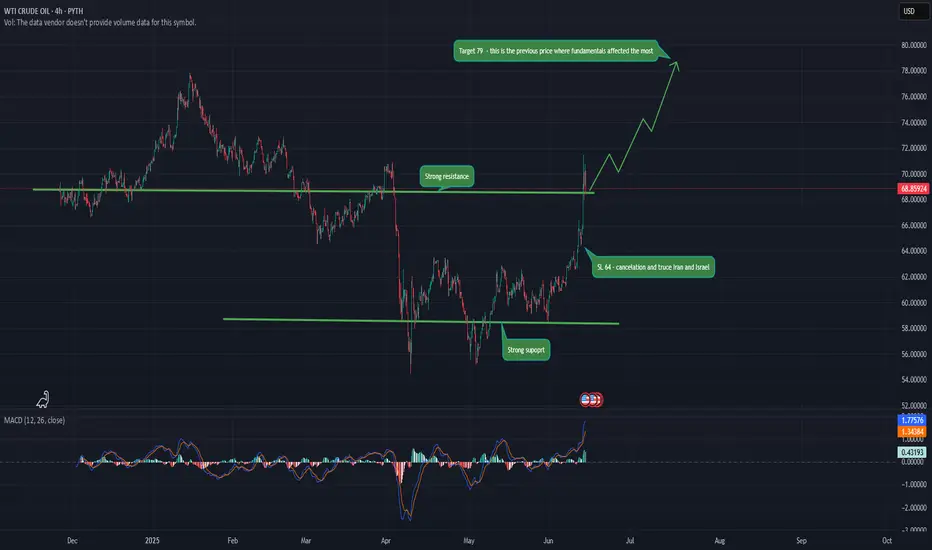
Crude Oil - we follow up with the momenetumCrude Oil Analysis: Why Prices Could Keep Rising Amid Israel-Iran Conflict? 🛢 🛢 🛢
📈 📈 📈The ongoing tensions between Israel and Iran have significantly intensified geopolitical risk in the Middle East—home to a third of the world’s oil supply. As hostilities escalate, crude oil prices are poised for continued upward momentum due to three key factors:
1️⃣ Supply Disruption Fears: The Strait of Hormuz, a critical chokepoint through which 20% of global oil flows, could be compromised if Iran retaliates or is targeted more directly. Any disruption—even speculative—typically sends prices higher.
2️⃣ Production Uncertainty: Iran, a major OPEC member, may face new sanctions or physical damage to infrastructure. In retaliation, Iran could also target regional energy infrastructure, including in the UAE or Saudi Arabia, shrinking global supply.
3️⃣ Market Sentiment and Risk Premiums: Investors tend to price in risk quickly. With oil markets already tight due to OPEC+ cuts and tepid U.S. production growth, heightened instability adds a strong speculative premium.
Bottom Line: Unless the Israel-Iran conflict de-escalates, crude oil has a strong bullish case. With limited spare capacity globally and increased geopolitical fragility, expect prices to remain elevated or climb further—especially if rhetoric turns into regional escalation. 💡 💡
📌 Trade plan
⬇️ Entry : On market open
✅Target : 79.00
❌SL: 64.00
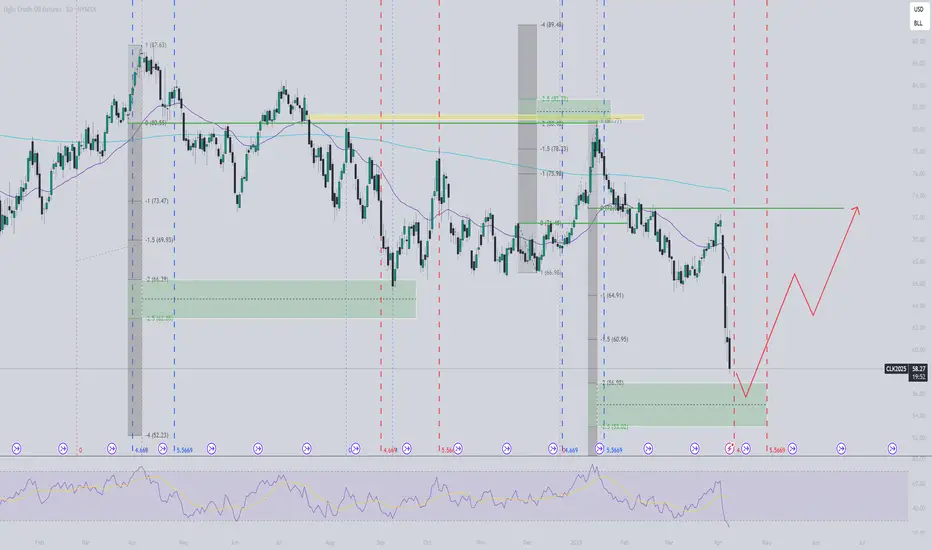
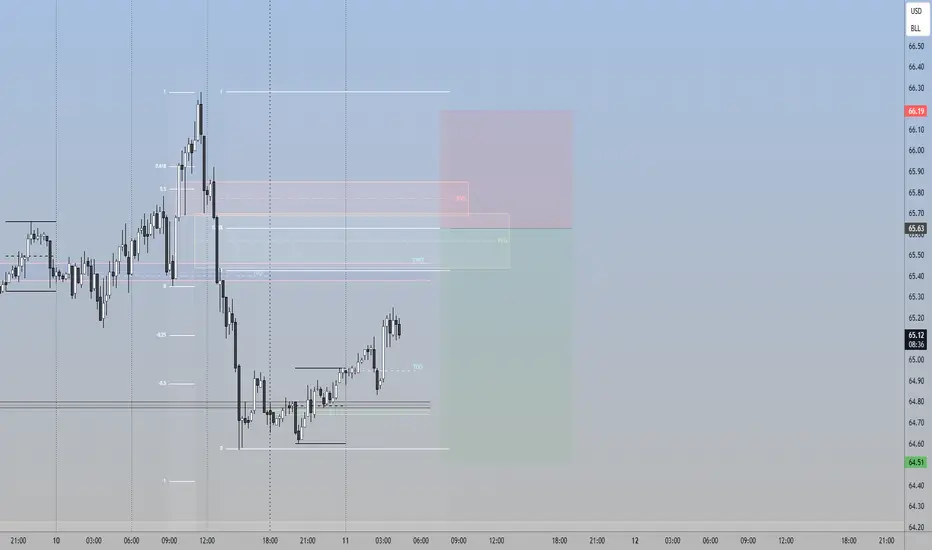
CL ready for new move upBased on time fib and Feigenbaum constants, CL is closing in on the bottom for this swing, expected within marked timezone. The swing highs/lows follows the Feigenbaum projections for the last few swings. I expect a dip below $57 before a new run higher, at least to $72-73.
WTI(20250613)Today's AnalysisMarket news:
The number of initial jobless claims in the United States for the week ending June 7 was 248,000, higher than the expected 240,000, the highest since the week of October 5, 2024. The monthly rate of the core PPI in the United States in May was 0.1%, lower than the expected 0.30%. Traders once again fully priced in the Fed's two interest rate cuts this year.
Technical analysis:
Today's buying and selling boundaries:
66.96
Support and resistance levels:
69.10
68.30
67.78
66.13
65.61
64.81
Trading strategy:
If the price breaks through 67.78, consider buying in, and the first target price is 68.30
If the price breaks through 66.96, consider selling in, and the first target price is 66.13

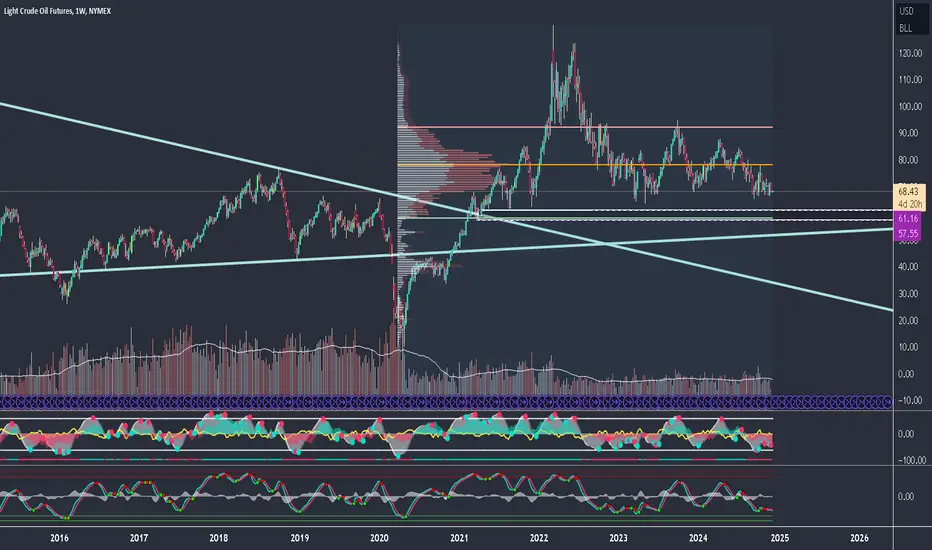
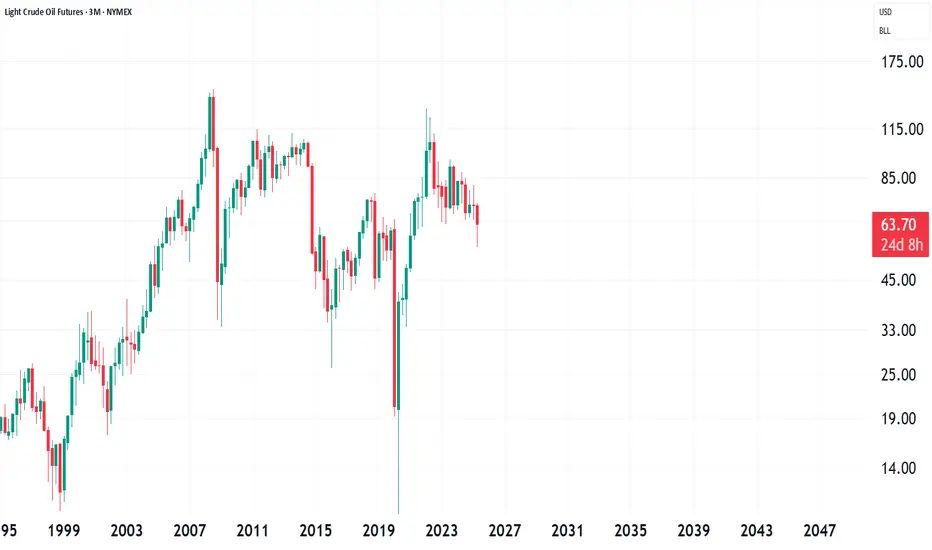
Light Crude Oil Futures will dump between 61.16 and 57.55 (-15%)CL1! In the monthly timeframe is showing strong selling side that will lead the price between the region of 57.55 and 61.16 that is the value area low from march20 and the fibonacci 61.8% from the same low.
Crude Oil Breaks out of Channel More Upside Ahead?Hey traders so in continuation of the last post which was Can Crude Oil Close above $68?
The answer is YES that didn't take long. 😁
One rule to live by that I have learned as a trader is Always Expect the Unexpected in Trading!
So I bored out of my mind watching paint dry and then all of sudden Boom out of nowhere news that changes everything can happen in the blink of eye in these markets!
So what Happened Opec? Iraq? Inventory Reports?
Well truthfully it great to read to the news but I prefer to read the charts instead. The charts are already showing you that demand has increased so regardless of if you caught the news yesterday or not the charts have already told the story.
Ok so now what it has closed above $68 which a strong bullish candle on 06/11 so did we miss the move?
Not at all especially if this is the beginning of new trend so best way to trade the break out of a channel is watch for it to retest the breakout zone.
So the breakout zone on the charts was $65 but now at $68 so if we can get a retest of $65-66 I believe it would be a great place to buy back in this market.
Like I always say don't chase the market let it come to you. The party has already started but that doesn't mean you missed the party. We might get a second invitation at $65 or $66 so if trading this market place a buy order around there and stop loss somewhere below support and half way in the channel around $62-63 below to give the market room to breathe.
What if we don't get a retest?
Well thats how it is sometimes I would rather wait for the market to pullback then enter at the highest price of the move. I have missed moves sometimes because of this disicpline but sooner or later eventually the profit taking will bring it back down. Patience is key imo unless you don't mind buying at the high.
Also Seasonally Oil Prices normally get increased demand due to the summer driving season. I will say sometimes there are fake channel breakouts to watch out for but this one looks bullish imo.
Always use Risk Management!
(Just in case your wrong in your analysis most experts recommend never to risk more than 2% of your account equity on any given trade.)
Hope This Helps Your Trading 😃
Clifford

WTI(20250612)Today's AnalysisMarket news:
① The EU hopes that the trade negotiations will be extended beyond the suspension period set by Trump. ② Bessant: As long as "sincerity" is shown in the negotiations, the Trump administration is willing to extend the current 90-day tariff suspension period beyond July 9. ③ Trump will hold multiple bilateral talks during the G7 summit. ④ The total customs revenue of the United States in May reached a record high of US$23 billion, an increase of nearly four times year-on-year. ⑤ Lutnick: One deal after another will be reached.
Technical analysis:
Today's buying and selling boundaries:
66.02
Support and resistance levels:
69.56
68.23
67.38
64.66
63.80
62.47
Trading strategy:
If the price breaks through 67.38, consider buying in, and the first target price is 68.23
If the price breaks through 66.02, consider selling in, and the first target price is 64.66

Crude Oil ShortsDaily imbalance resting below, looking for price to respect daily rejection block. H6 SIBI + H1 Range. Looking simply for OTE Retracement before selling off. will look for M5 confirmation entry too.
Crude Oil Stuck in Consolidation Watch for Breakout! Hey Traders so today was looking at oil market seems to be stuck in a very powerful pattern called the Narrow Sideways Channel. Basically market has been going no where for the last 75 days stuck between the highs and the lows moving back and forth moving sideways.
Most traders have probably fallen alseep because this market is boring as watching paint dry
just stuck in a range of $55-$65. I guess some traders can trade the range buy at the bottom or the channel sell near the top but imo the best way to trade is wait for a breakout of the channel.
Now if you research historical sideways channels or range markets you will find that almost every market that has ever traded sideways for more than 90 days or more led to an explosive breakout at one point in time!
Finally exciting news! That means the longer it consolidates the better for us traders to catch the breakout.
So if we look closely at the chart we can see right out of the channel top there is resistance ahead at $68. However if market can break above $68 and close above that level at the daily close that would be a serious buy signal for more upside. But don't go by intraday go by the close of the day intraday means nothing imo.
The Daily Close it all that counts!
So watch for breakout above $68 then look to buy on pullback if I does not break above $68 tje we are back to watching paint dry. 😂
Always use Risk Management!
(Just in case your wrong in your analysis most experts recommend never to risk more than 2% of your account equity on any given trade.)
Hope This Helps Your Trading 😃
Clifford

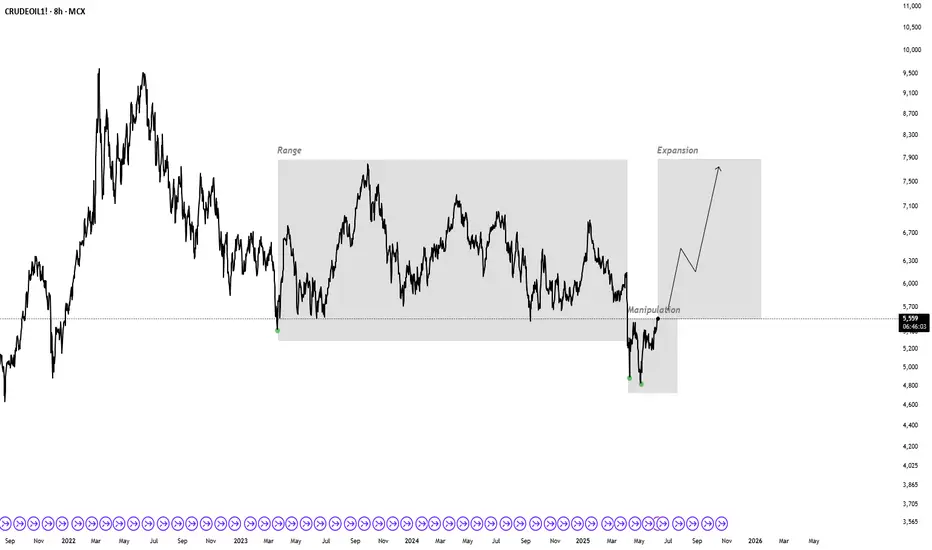
Crude oil PO3I am watching this PO3 for a while now. The invalidation for this would be below the last low and the technical target is at least the range high.
WTI(20250609)Today's AnalysisMarket news:
Fed Harker: Amid uncertainty, the Fed may still cut interest rates later this year. Musallem: There is a 50% chance that the trade war will lead to a sustained inflation outbreak. Tariffs may push up inflation within one or two quarters. The ECB cut three key interest rates by 25 basis points. Lagarde hinted that the rate cut cycle will end, and the market is no longer fully pricing in another 25 basis point rate cut this year.
Technical analysis:
Today's buying and selling boundaries:
63.43
Support and resistance levels:
65.29
64.60
64.14
62.71
62.26
61.56
Trading strategy:
If the price breaks through 64.14, consider buying in, with the first target price of 64.60
If the price breaks through 63.43, consider selling in, with the first target price of 62.71
.382 - 65.24 almost there Well I'll try a 55 m tf chart - support still hasn't updated prev but we're almost there -my daily chart from March 11 th shows bigger picture . watching if this is a bear at the .382 or how it's played - green is mid mth barn -supply to April - 65 to stay alive . keep your stick on the ice - GL

Weekly Market Forecast: BUY Stock Indices & Oil! Sell Gold! In this Weekly Market Forecast, we will analyze the S&P 500, NASDAQ, DOW JONES, Gold and Silver futures, for the week of June 9 - 13th.
Stock Indices are looking more bullish. Valid buys only!
Gold is weak. Sells only until there is a market structure shift upwards.
Oil prices have room to go higher. Buy it.
Silver is a wait and see. Should start to pull back this week, as it closed last week stronger than Gold.
CPI Wednesday. After the news is announced, the market should be very tradeable for the rest of the week.
Enjoy!
May profits be upon you.
Leave any questions or comments in the comment section.
I appreciate any feedback from my viewers!
Like and/or subscribe if you want more accurate analysis.
Thank you so much!
Disclaimer:
I do not provide personal investment advice and I am not a qualified licensed investment advisor.
All information found here, including any ideas, opinions, views, predictions, forecasts, commentaries, suggestions, expressed or implied herein, are for informational, entertainment or educational purposes only and should not be construed as personal investment advice. While the information provided is believed to be accurate, it may include errors or inaccuracies.
I will not and cannot be held liable for any actions you take as a result of anything you read here.
Conduct your own due diligence, or consult a licensed financial advisor or broker before making any and all investment decisions. Any investments, trades, speculations, or decisions made on the basis of any information found on this channel, expressed or implied herein, are committed at your own risk, financial or otherwise.

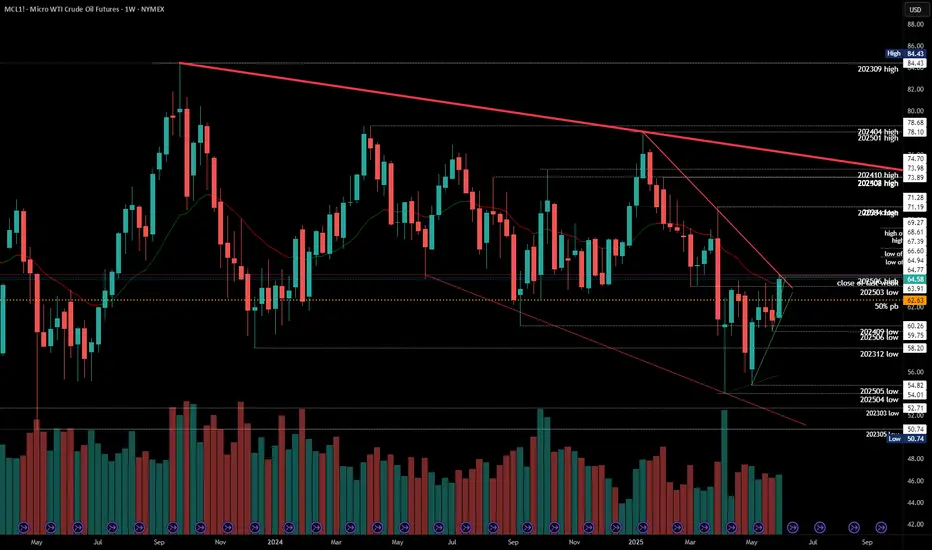
#202523 - priceactiontds - weekly update - wti crude oilGood Day and I hope you are well.
comment: Time to be very cautious as a bear and hopeful as a bull. 3 clear legs down and the third could not make a new low. Now the market closed at the weekly high and it’s a fitting place for a reversal. 65 should be the highest bears should allow it. If bulls get follow-through beyond, this is a buy with stop 59.5. The target above 65 is obviously 70 and maybe even the bigger bear trend line around 73.
current market cycle: monthly time frame is a broad bear channel - weekly tf is a bear wedge - daily is a trading range
key levels: 59 - 65
bull case: Bulls got their first daily close above the weekly20 ema since February. Bears tried to get the market below 60 but failed to keep it below - 3 times now since April. Markets will try one thing only so much until they try something else. 65 is the next target which will likely get hit early next week but I expect a bit more sideways until one side clearly gives up. Technically this is a double bottom April/May lows and now a higher low and bulls want to get the major trend reversal.
Invalidation is below 65.5
bear case: Bears are hopeful that the bear wedge is still enough resistance that we test down to 60 but they need a strong reversal below 65 to make it happen and when a weekly bar closes at the very high, it’s probably not a good time to be a bear. Best bears can hope for here is to stay below 65 and continue inside the current range 60-65.
Invalidation is above 65.5
short term: Bullish. I think a bull breakout is much more likely than hitting 60 again. Buying 64.58 with a stop 59.5 is likely a decent trade already. Confirmation for the breakout is 65.5ish.
medium-long term - Update from 2025-06-08: Market finds no acceptance below 60 since 2021 and now we have 3 clear legs down, a higher low and a breakout above prior high with a weekly close at the highs and the weekly 20ema. This is likely as good of a swing long as you can get.
Crude. Daily Internal to External Range Liquidity. 06.06.25Covering the crude expansion from daily internal towards the first external range liquidity

Crude oil-----Sell near 64.00, target 63.00-62.00Crude oil market analysis:
Crude oil is still bearish, and we will continue to sell on rebounds. If it does not break 65.00, it will fluctuate. The general trend is bearish. If it breaks, we will adjust our thinking. Today's crude oil is the key. Will it start to take off before the data? The previous crude oil inventory data did not allow crude oil to break the position. The crude oil fluctuation range is 60.00-65.00. If it breaks this range, we will adjust our thinking on fluctuations.
Operational suggestions
Crude oil-----Sell near 64.00, target 63.00-62.00

Long On CrudeI hold a strong conviction that in July Oil prices may soar above current trading levels
REVERSE HEAD AND SHOULDER PATTERNSCrude oil looks good can go long with Stoploss. Bigbreakout expected

WTI(20250606)Today's AnalysisMarket news:
The European Central Bank cut three key interest rates by 25 basis points. Lagarde hinted that the rate cut cycle will end, and the market is no longer fully pricing in another 25 basis point rate cut this year.
Technical analysis:
Today's buying and selling boundaries:
62.58
Support and resistance levels:
63.97
63.45
63.12
62.05
61.71
61.19
Trading strategy:
If the price breaks through 63.12, consider buying, and the first target price is 63.45
If the price breaks through 62.58, consider selling, and the first target price is 62.05
CL SELLSELL CL at 71.0000 or 68.000, riding it down to 55.5000 to 51.0000 as Profit Targets, Stop Loss is at 73.0000!
Warning: This is only for entertainment and opinion purpose. Trading is a risky business, so do your own due diligence, and trade at your own risk. You can loose all of your money and much more.
