#202526 - priceactiontds - weekly update - wti crude oil futuresGood Day and I hope you are well.
#mcl1 - wti crude oil futures
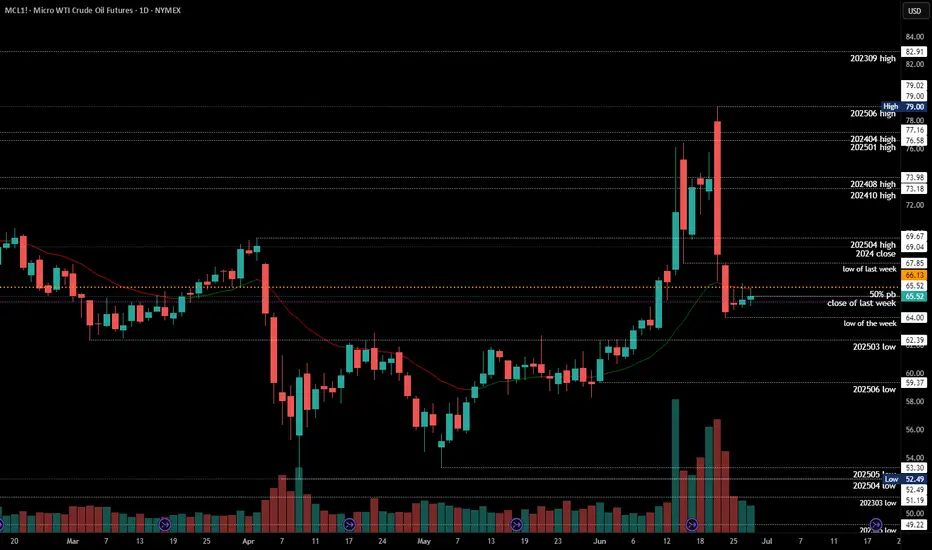
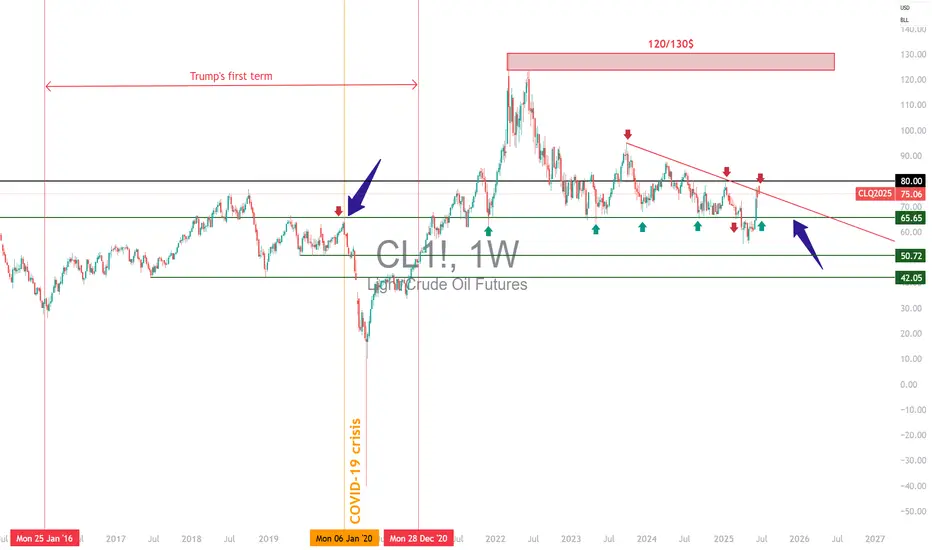
comment: Yeah I don’t know about this one. Your guess is as good as mine. I could even see this touching 63 before going higher again. Most erratic and extreme price action the past 2 weeks, so maybe wait a bit before jumping the train here.
current market cycle: trading range
key levels: 63 - 80
bull case: Bulls don’t have much. They could not close one decent bar at the high since 2025-06-11 and despite all the bull spikes, we only sold afterwards and are back below 65 where the extreme breakout happened. Best guess here is that we stay above 63 and go sideways. Sideways up to where? No idea. Could be 68, could be 70.
Invalidation is below 63
bear case: Too extreme. Both sides have to take quick profits or the next spike will take them away again. So most likely sideways in a range until a newsbomb hit again. Range could be 63 - 68.
Invalidation is above 79
short term: Neutral. Not touching this unless someone threatens me with a gun.
medium-long term - Update from 2025-06-22: Let’s leave this as “todo” for now. No read on this and I won’t make stuff up just to post something.
WTI1! trade ideas
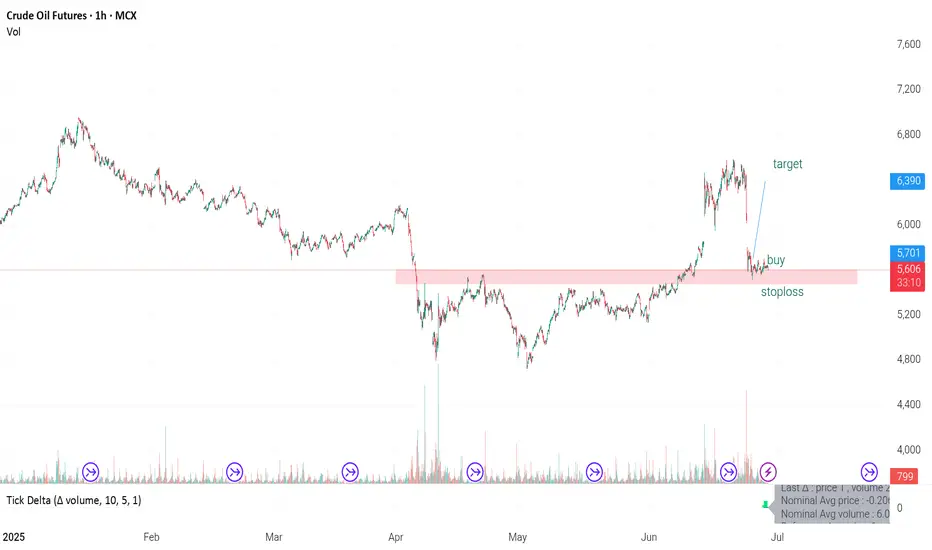
Crudeoil is near a strong support one can buy with a tight stopCrudeoil is near a strong support one can buy with a tight stop
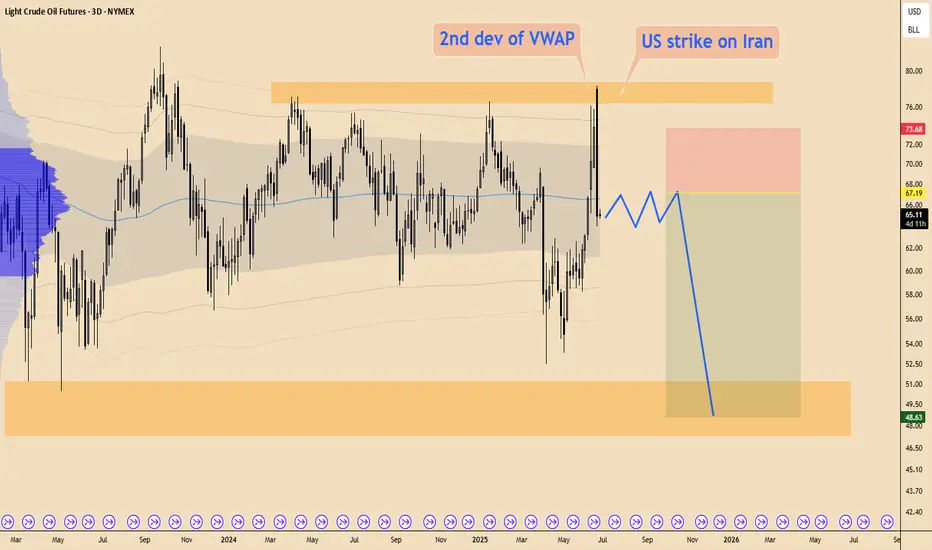
OIL - is going to hit $50I expect the drop in OIl will go on
During such big news as potential WW3 price bararly rose
Also on bigger time frame price only reached 2nd vwap deviation
that's why after some consolidation price will go down toward range LOW
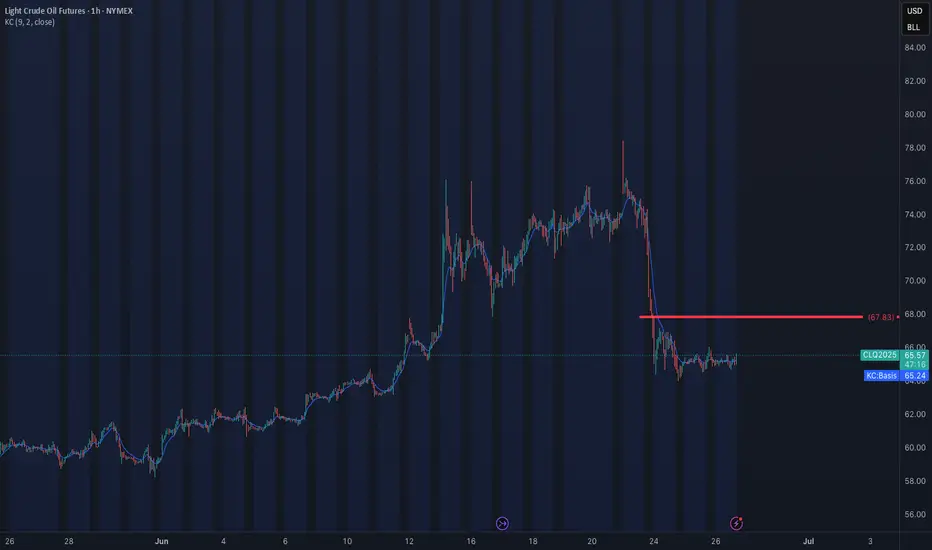
Geopolitical tensions is making oil fun to tradeFor the unexperienced traders, be very careful trading NYSE:CL , you can get caught anytime wether you are long or short right or wrong.
Nevertheless, if you follow my LIS, you can have a clear picture of where oil is heading to.
Right now, oil is set up as bearish but it can change in a matter of a bomb. Jokes aside, the LIS stands at 67.8. So below still bearish, above turn bullish.
OIL Bullish BiasCurrently sitting on my hands but closely watching oil, especially after Iran & Israel
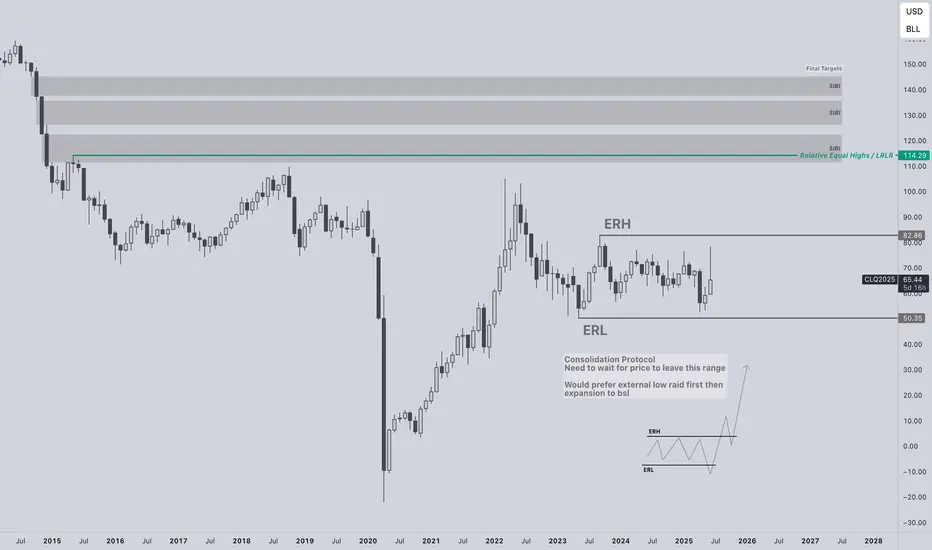
Consolidation Protocol active. Need to see external range taken. I will not trade inside this range. Favoring longs.
Think accumulation, manipulation, distribution. Right now its in the accumulation phase. Manipulation phase is next. Preferably sweeping external low first then distribution higher to bsl.
Relative equal highs / LRLR at 114.29 first long term target.
Final target are the inefficiencies at 130 - 150.
CL1! Structural NarrativeResearch Idea
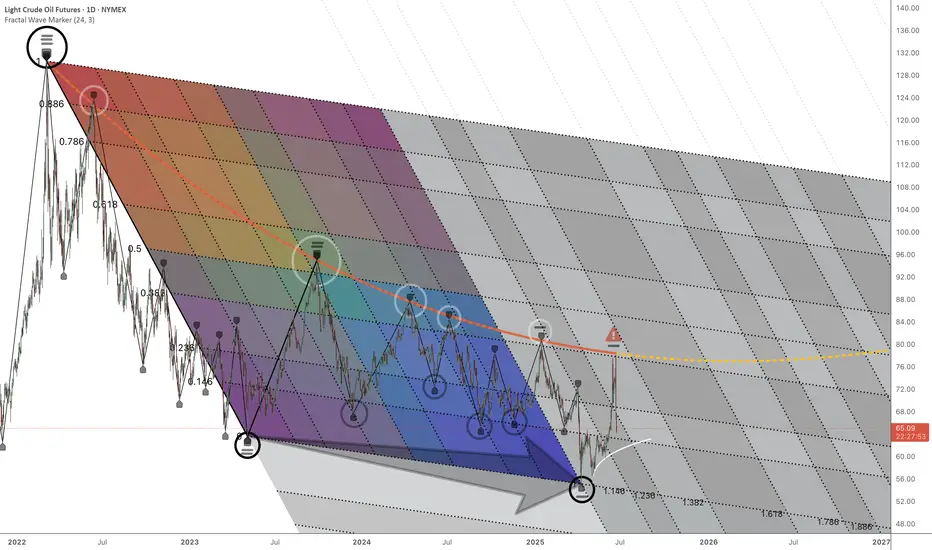
If look we beyond surface appearances, we would ask what kind of iterative, generative, or probabilistic mechanisms could have created those movements. Complexity can arise from simplicity, and that what looks messy may follow deep mathematical logic.
We can see the curve that connects series rejections that exposes where selling pressure extends compression until broken.
Another pattern would be current price expressed as a fibonacci ratio of a broader cycle as it splits them into phases.
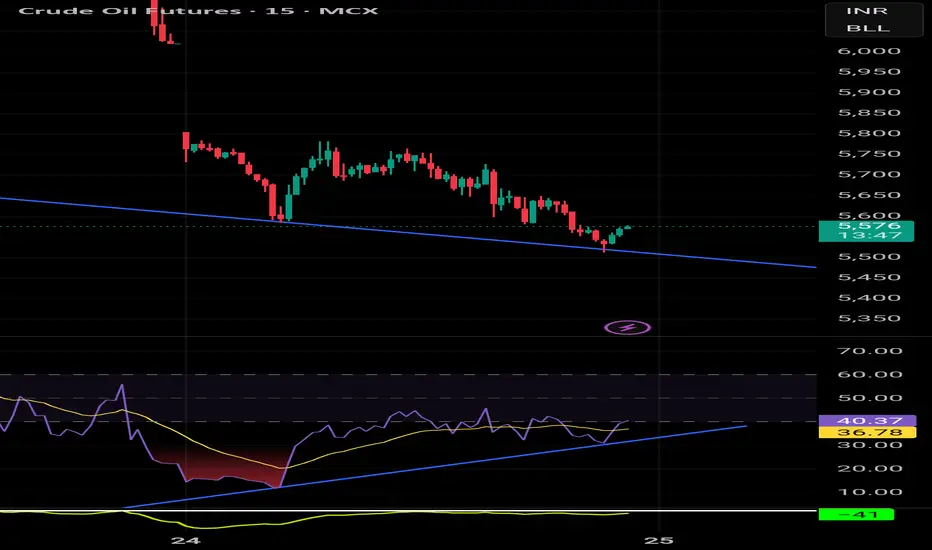
Crudeoil bullish momentum coming with help of technicals Crudeoil creating RSI divergence
THE MOVEMENT WILL COME AFTER RSI CROSS ABOVE 55
CRUDE OIL poised to go UP AGAIN? Usually my posts on crude oil are short. but here’s a longer one for a change.
Back in December, I predicted that crude oil would hit the highlighted zone around $57. That’s exactly what happened, hit the target and bounced.
Over the past two weeks, we’ve seen wild swings in crude oil prices as tensions between Iran and Israel escalated. But now, following the ceasefire announcement brokered by President Trump, and considering Iran’s response over the past couple of days, crude oil has dropped below its pre-conflict price levels.
While I truly hope for a peaceful world where no innocent lives are harmed, my personal view is that this ceasefire feels fragile and may not last long.
So, what’s next for crude oil? Up or down?
If the ceasefire holds and we don’t see further conflict in the Middle East, I think crude oil could hover in the $65–$75 range. There’s even a slim chance we dip as low as $45.
However, based on my technical analysis model, and my doubts about the durability of the ceasefire, I expect oil prices to rise in the next 6 to 9 months. My targets? $78 and $85.
Of course, I might be wrong this time. :)
Cheers!

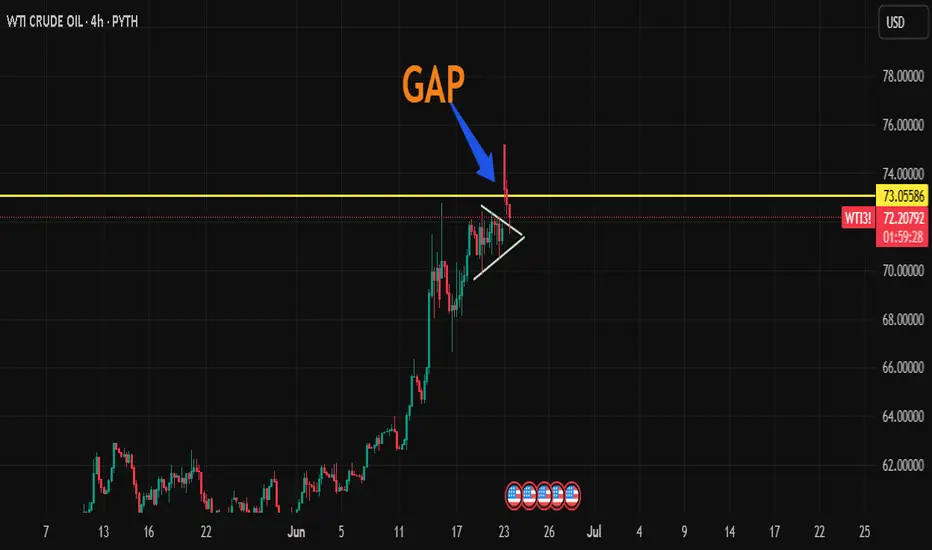
Oil Price: Breakout or Fakeout? Watch This Zone Closely Technical Overview:
The current price action is testing the upper boundary of a descending wedge, a bullish reversal pattern. The recent strong green candle indicates a potential breakout attempt, yet price is hovering near a critical resistance level at $74.20 (Fib 0.5).
Key levels from the Fibonacci retracement are:
🔼 Resistance at $74.20 (0.5), then $78.16 (0.618)
🧲 Local support at $69.78 (0.382)
🛡️ Strong demand zone near $63.81 (0.236) if rejection occurs
Structure + Patterns:
Price has been compressing inside a falling wedge, which statistically resolves to the upside.
The breakout candle broke above the 20 EMA and touched the upper wedge resistance — signaling a decision point.
Volume is rising on bullish candles — initial confirmation of buyer interest, but not yet decisive.
Scenarios to Watch
Bullish Case:
Break and close above $74.20 on higher volume → likely move toward $78–$86 resistance zone.
Confirmation of wedge breakout could trigger trend reversal, aligning with bullish fib levels.
Momentum could accelerate if macro factors support demand (see geopolitics below).
Bearish Case:
Failure to close above $74.20 = fakeout risk → price may reject down to $69.78 or even retest $63.81.
Bearish rejection wick on the daily/4H would be an early signal.
Macro & Geopolitical Factors to Monitor:
Middle East Tensions: Any escalation (especially around Iran or shipping lanes) could spike oil due to supply fears.
US Strategic Reserves & Elections: Moves to refill reserves or control inflation could support demand.
China Demand Recovery: Data showing improved industrial output or stimulus from PBoC may strengthen global oil outlook.
Final Thoughts:
Price is at a pivot zone — breaking this wedge with strength could shift the short-to-midterm trend. Until then, this remains a "show me" breakout . Watch how the next 1–2 weekly candles close around the $74–$75 area to confirm direction.
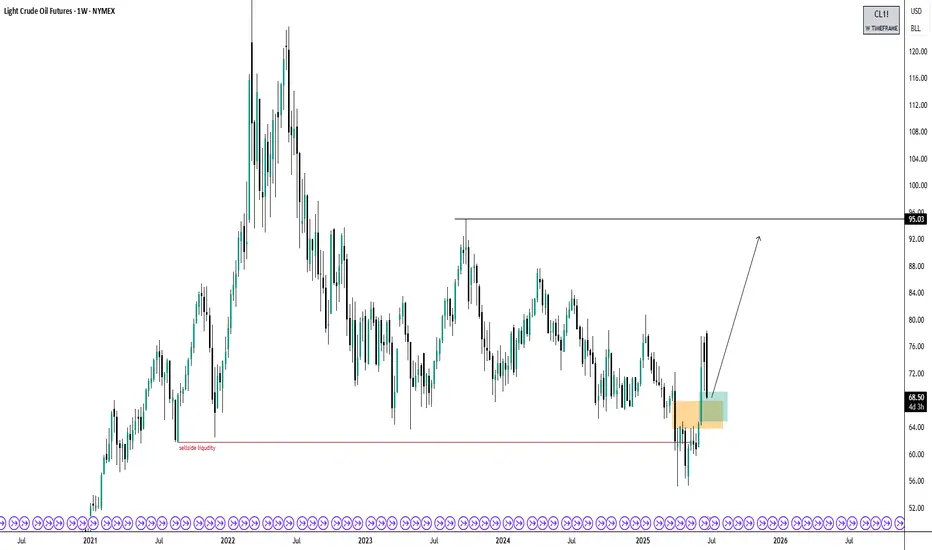
Crude Oil Bullish BiasThree years ago, I predicted that oil would trade below $61 when the price was around $118. Price traded to $55 and is now up to $68. I now believe price has exhausted sell-side liquidity and will trade higher, possibly seeing $95 and beyond.
*Not financial advice
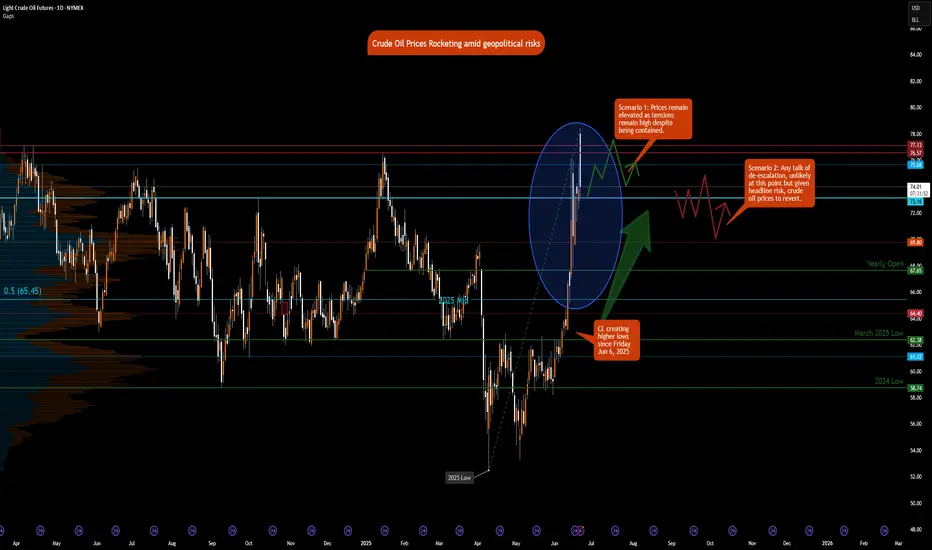
Crude Oil Prices Rocketing amid geopolitical risks
NYMEX:CL1! NYMEX:MCL1! NYMEX:BZ1!
Macro:
Geopolitical tensions remain high and markets are now likely to price in our scenario discussing ongoing air and missile war, given one-off intervention from the US thus far. According to Reuters, the U.S. now assesses that Iranian retaliation could occur within the next two days.What happens next is anybody’s guess but as traders, it is important to navigate these uncertainties with scenario planning and/or reduce risk to account for increased volatility.
We also get Services and Manufacturing PMI data today and PCE Price Index on Friday. Chair Powell is set to testify on Tuesday 9am CT.
Key levels:
Jan 2025 High: 76.57
2025 High: 78.40
2025 CVAH(Composite Value Area High): 75.68
Key LIS zone: 73.50-73.15
We anticipate the following scenarios in crude oil:
Scenario 1:
Prices remain elevated as tensions remain high, despite limited retaliation, however, the situation overall now escalated beyond return to diplomacy.
Scenario 2:
Any push towards de-escalation, unlikely in our analysis, but given the headline risk, crude prices may remain volatile and come off the highs.
Given our key LIS (Line in Sand) zone above, we favor longs above this and shorts below this zone.
Crude Oil Testing $75 Resistance with Key Price Movements Targets:
- T1 = $78.00
- T2 = $80.50
Stop Levels:
- S1 = $74.00
- S2 = $72.50
**Wisdom of Professional Traders:**
This analysis synthesizes insights from thousands of professional traders and market experts, leveraging collective intelligence to identify high-probability trade setups. The wisdom of crowds principle suggests that aggregated market perspectives from experienced professionals often outperform individual forecasts, reducing cognitive biases and highlighting consensus opportunities in Crude Oil.
**Key Insights:**
Crude Oil has been holding strong amid mixed macroeconomic data, with traders noting resilience around the $75 price level acting as a key support. Recent production cuts by OPEC+ have further tightened supply, providing support for bullish sentiment. Dollar weakness also boosts commodity prices, as global markets eye policy decisions from central banks.
Additionally, technical indicators suggest upward momentum is building. RSI levels are nearing overbought zones but remain favorable for a continued upward push. Moving averages show upward crossover patterns, signaling strong bullish possibilities.
**Recent Performance:**
Crude Oil has seen fluctuating performance over the last month, with prices rebounding from lows of $72 and climbing steadily to current levels. A temporary pullback earlier in the week was followed by renewed buying interest, demonstrating the strength of underlying bullish sentiment despite volatile macroeconomic conditions.
**Expert Analysis:**
Industry analysts highlight that geopolitical risks and tightening supply conditions could lead to further upward price pressure. The $75.13 level corresponds to a critical juncture that traders are closely watching for breakouts. A breach above this level would likely signal further upside momentum, potentially reaching the $80 mark as broader optimism prevails.
**News Impact:**
Recent news surrounding OPEC+ production strategies and lower inventories in key storage hubs like Cushing have contributed to bullish sentiment. Simultaneously, macroeconomic factors — including U.S. inflation data and Federal Reserve remarks — are influencing crude oil’s directional moves, albeit in a secondary role.
**Trading Recommendation:**
A bullish position is recommended on Crude Oil as it continues to show potential for a breakout above current resistance levels. Traders should aim for targets of $78.00 and $80.50, using stop-loss orders at $74.00 and $72.50 to mitigate downside risks. Current technical setups and macroeconomic signals support upward momentum, making this a favorable opportunity for disciplined trading.
WTI(oil)For oil, what I have in mind, considering the conditions we are in, if the Strait of Hormuz is not closed, we will remain at the same prices, that is, $75 to $80. But if the Strait is closed 100%, the price will go up to $130 and $150 in the short term.
A barrel at $130? Not unless Hormuz closes for good.As tensions in the Middle East between Iran, Israel and the United States escalate, speculation about a $130 oil barrel resurfaces on the markets. While the recent rise in prices is very real, fuelled by geopolitics, there is nothing in the fundamentals or in the technical analysis to justify such an extreme scenario for the time being. Unless... the Strait of Hormuz is blocked. Here are some explanations.
1) Oil rebounds, but no technical red alert
Since its low point in May, oil prices have surged by over 40%, buoyed by regional tensions and renewed volatility. The market is anticipating a rise in geopolitical risk, but for the time being, this recovery is not being accompanied by any technical red flags.
Indicators such as the COT report (Commitment of Traders), volumes and key technical thresholds on WTI and Brent are not confirming extreme tension at the current stage, as long as US oil remains below resistance at $80 a barrel. Although the 200-day moving average has been breached, and the reintegration of the $65 level has provided the starting point for a bullish impulse, the price of oil is now at a technical crossroads.
The chart below shows a bearish resistance line (red) on WTI, and the same applies to Brent. If these resistances were to be breached, this would be a strong bullish warning signal for the price of a barrel of oil towards $90/95.
2) A market under pressure... but framed by OPEC
Indeed, only a major supply constraint can push oil up to $130 a barrel.
The current geopolitical context comes at the worst possible time for OPEC. The oil cartel, led by Saudi Arabia, had recently decided to increase production after years of restrictions. The objectives were to respond to what was seen as robust demand, win back market share from US producers and punish less disciplined members.
In May, June and July, an increase of 411,000 barrels per day is scheduled. In other words, the market is receiving additional supply, which mechanically limits the risk of a speculative surge, barring a major exogenous shock such as the long-term closure of the Strait of Hormuz.
3) Iran/Israel/USA: the market prices the risk, but doesn't panic. Traders are currently considering three scenarios:
1. Tougher sanctions against Iran, reducing supply by 500,000 to 1 million barrels a day.
2. A targeted attack on Iran's oil infrastructure.
3. A temporary closure of the Strait of Hormuz.
The first two cases can be absorbed by the market, notably thanks to the production capacities of other OPEC+ members or the strategic release of reserves. On the other hand, blocking the Strait of Hormuz would be a “game changer”.
The Strait of Hormuz, between the Persian Gulf and the Gulf of Oman, is the gateway to 20% of the world's oil supply, i.e. some 17 to 18 million barrels a day. It is also a vital route for liquefied natural gas (LNG), particularly from Qatar.
Even a partial shutdown would have an immediate impact on all logistics chains and the energy security of importing countries, and would trigger a brutal price shock. In this case, oil at 130 dollars would no longer be an extreme hypothesis, but a plausible scenario in the very short term.
The situation is, of course, evolving, and investors need to keep an eye out for weak signals: military movements in the Strait, targeted attacks on energy infrastructures, bellicose rhetoric. In the absence of a blockade of Hormuz, the fundamentals (rising OPEC production, slowing Chinese demand, technical stability) militate in favor of a ceiling of around $80/90.
A barrel at $130? Yes, but only if Hormuz closes completely.
DISCLAIMER:
This content is intended for individuals who are familiar with financial markets and instruments and is for information purposes only. The presented idea (including market commentary, market data and observations) is not a work product of any research department of Swissquote or its affiliates. This material is intended to highlight market action and does not constitute investment, legal or tax advice. If you are a retail investor or lack experience in trading complex financial products, it is advisable to seek professional advice from licensed advisor before making any financial decisions.
This content is not intended to manipulate the market or encourage any specific financial behavior.
Swissquote makes no representation or warranty as to the quality, completeness, accuracy, comprehensiveness or non-infringement of such content. The views expressed are those of the consultant and are provided for educational purposes only. Any information provided relating to a product or market should not be construed as recommending an investment strategy or transaction. Past performance is not a guarantee of future results.
Swissquote and its employees and representatives shall in no event be held liable for any damages or losses arising directly or indirectly from decisions made on the basis of this content.
The use of any third-party brands or trademarks is for information only and does not imply endorsement by Swissquote, or that the trademark owner has authorised Swissquote to promote its products or services.
Swissquote is the marketing brand for the activities of Swissquote Bank Ltd (Switzerland) regulated by FINMA, Swissquote Capital Markets Limited regulated by CySEC (Cyprus), Swissquote Bank Europe SA (Luxembourg) regulated by the CSSF, Swissquote Ltd (UK) regulated by the FCA, Swissquote Financial Services (Malta) Ltd regulated by the Malta Financial Services Authority, Swissquote MEA Ltd. (UAE) regulated by the Dubai Financial Services Authority, Swissquote Pte Ltd (Singapore) regulated by the Monetary Authority of Singapore, Swissquote Asia Limited (Hong Kong) licensed by the Hong Kong Securities and Futures Commission (SFC) and Swissquote South Africa (Pty) Ltd supervised by the FSCA.
Products and services of Swissquote are only intended for those permitted to receive them under local law.
All investments carry a degree of risk. The risk of loss in trading or holding financial instruments can be substantial. The value of financial instruments, including but not limited to stocks, bonds, cryptocurrencies, and other assets, can fluctuate both upwards and downwards. There is a significant risk of financial loss when buying, selling, holding, staking, or investing in these instruments. SQBE makes no recommendations regarding any specific investment, transaction, or the use of any particular investment strategy.
CFDs are complex instruments and come with a high risk of losing money rapidly due to leverage. The vast majority of retail client accounts suffer capital losses when trading in CFDs. You should consider whether you understand how CFDs work and whether you can afford to take the high risk of losing your money.
Digital Assets are unregulated in most countries and consumer protection rules may not apply. As highly volatile speculative investments, Digital Assets are not suitable for investors without a high-risk tolerance. Make sure you understand each Digital Asset before you trade.
Cryptocurrencies are not considered legal tender in some jurisdictions and are subject to regulatory uncertainties.
The use of Internet-based systems can involve high risks, including, but not limited to, fraud, cyber-attacks, network and communication failures, as well as identity theft and phishing attacks related to crypto-assets.
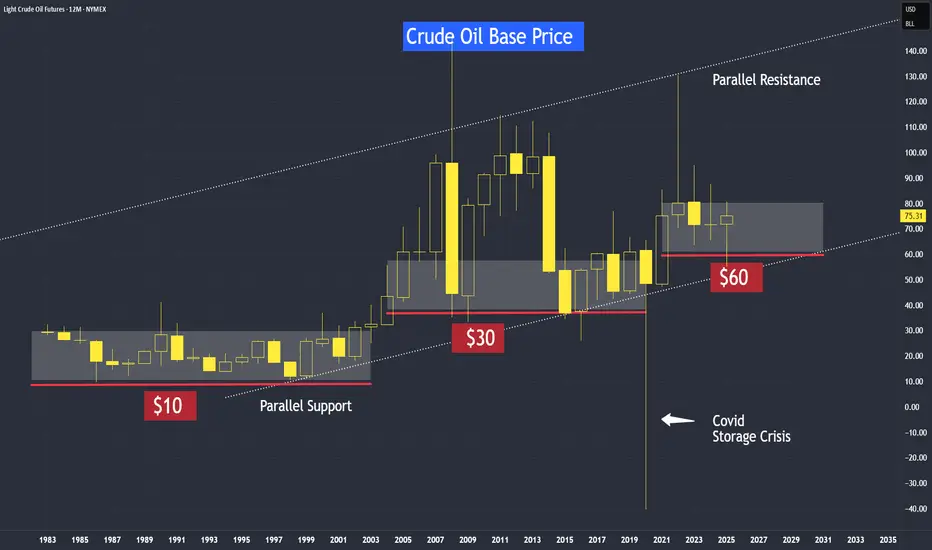
What Is the Base Price or Long-term Support for Crude Oil?What is the base price for oil? Specifically, today we will discuss crude oil, and we can apply this understanding to other commodities as well.
I won't go into too much technical detail about the difference between the base price and the cost price for crude oil, but for most people, it helps to see the title as “Is there a bottom-line price or support level for crude oil?”
My answer is yes, and this is due to inflation. Over time, we tend to pay higher prices for food, gas and many others that we consume.
The cost of goods varies between producers and merchants, and then from merchants to end consumers. However, it all starts with the producer. Before a producer acquires oil for refining, they reference crude oil prices as a benchmark to decide whether to make a purchase or hold back.
So, “Is there a bottom-line price or support level for crude oil?”
As we can see from the yearly chart, in every few years the base price of crude oil keeps adjusting higher; in levels and stages.
There is also this parallel channel formed by joining across its troughs and mirror it to its prominent resistance, we can observe crude oil prices range bound between this broad uptrend over time.
We can try to apply this analysis to other commodities; we will find a similar broad uptrend across most of them. But why? Because of inflation.
Regarding the bottom-line support for crude oil, we observed that it was at $10 from the 1980s until the turn of the millennium. Over time, accounting for inflation, this support level shifted upward to around $30 from the early 2000s until 2020, the year of COVID-19. And now we can see there is a new support at $60 since the start of 2020.
How to explain this break below $30 base price and went to -$40?
In technical analysis, this break is considered a false break, because, at the close of that year, on this yearly chart, prices settled above the support line at $30.
The story behind this is that when COVID hit, airlines were grounded, leading to storage issues for large quantities of oil. It cost more to store the oil than its selling price, which caused prices to drop below zero, reaching as low as -$40. But prices ultimately found its equilibrium and settle at a fair value at $48 that year.
Where is the support for crude oil, and what is its current direction?
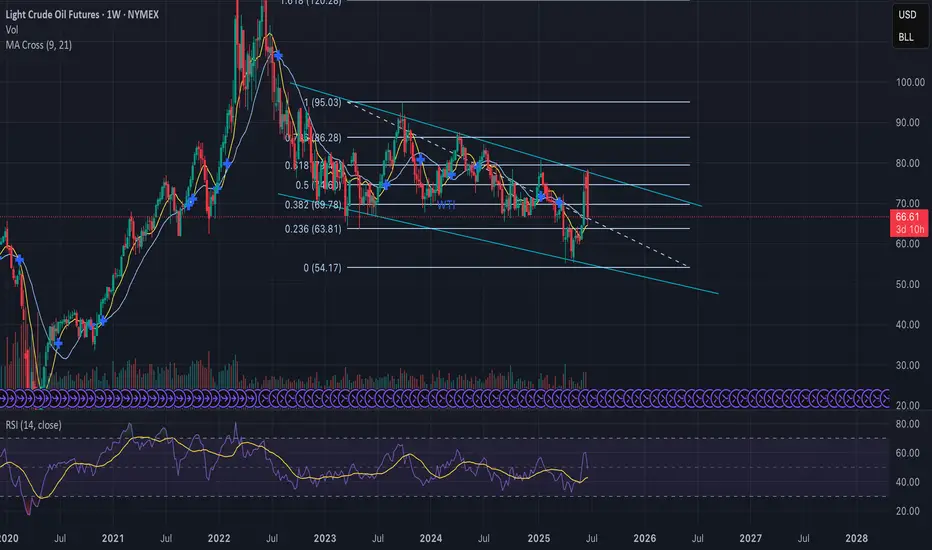
This was a video analysis on Sep 2024, in this weekly chart, we can see a wedge pattern. Then I believe if the price breaks above this downtrend line, it suggests that we may see higher crude oil prices. And this analysis is taking shape today.
We can see prices initially broke above this trendline, but shortly sink below and broke this support line at $66 to $55. And today we are at $73 after the renewal of the Middle East tension.
How should I interpret the move to the recent low around $55?
I would encourage to always discover the development with different time frame as time progress.
Switching to the yearly chart, we observed that crude oil is still supported above $60 that year.
Please also make a point to adjust this downtrend line from time to time as market dynamic changes.
Watch the full video:
WTI Crude Oil Futures & Options
Ticker: MCL
Minimum fluctuation:
0.01 per barrel = $1.00
Disclaimer:
• What presented here is not a recommendation, please consult your licensed broker.
• Our mission is to create lateral thinking skills for every investor and trader, knowing when to take a calculated risk with market uncertainty and a bolder risk when opportunity arises.
CME Real-time Market Data help identify trading set-ups in real-time and express my market views. If you have futures in your trading portfolio, you can check out on CME Group data plans available that suit your trading needs tradingview.sweetlogin.com
Trading the Micro: www.cmegroup.com
www.cmegroup.com
Missiles Flying! Buy OIL, GOLD! Sell the Stock Indices!In this Weekly Market Forecast, we will analyze the S&P 500, NASDAQ, DOW JONES, Gold and Silver futures, for the week of June 22-28th.
This is a revision of the Weekly Forecast I posted yesterday! With the latest US strikes into Iran nuke sites, the fundamentals go from zero to a hundred! Risk on turns immediately to risk off, and gap opens are likely to present themselves.
Look to long the safe havens and short the equities until tensions ease.
Enjoy!
May profits be upon you.
Leave any questions or comments in the comment section.
I appreciate any feedback from my viewers!
Like and/or subscribe if you want more accurate analysis.
Thank you so much!
Disclaimer:
I do not provide personal investment advice and I am not a qualified licensed investment advisor.
All information found here, including any ideas, opinions, views, predictions, forecasts, commentaries, suggestions, expressed or implied herein, are for informational, entertainment or educational purposes only and should not be construed as personal investment advice. While the information provided is believed to be accurate, it may include errors or inaccuracies.
I will not and cannot be held liable for any actions you take as a result of anything you read here.
Conduct your own due diligence, or consult a licensed financial advisor or broker before making any and all investment decisions. Any investments, trades, speculations, or decisions made on the basis of any information found on this channel, expressed or implied herein, are committed at your own risk, financial or otherwise.

#202525 - priceactiontds - weekly update - wti crude oilGood Day and I hope you are well.
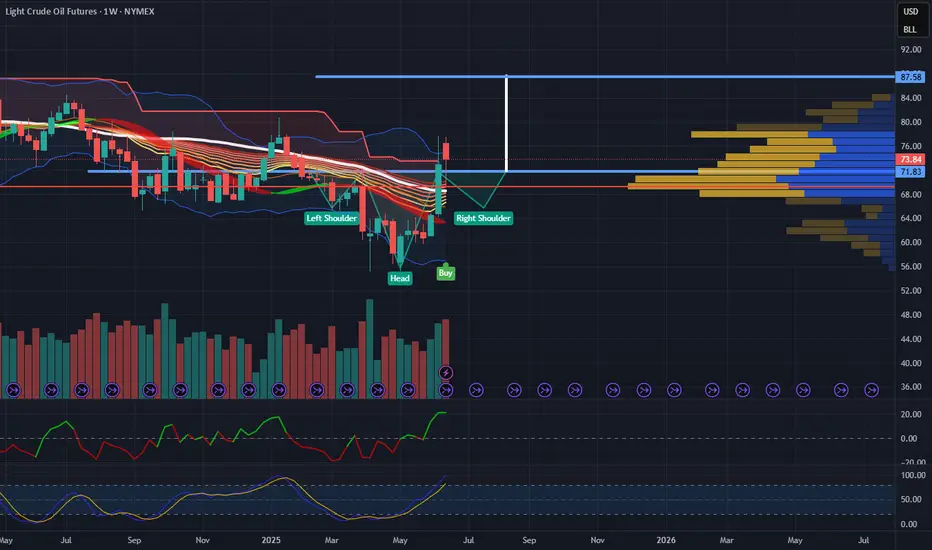
comment: Many gaps on different time frames and I only marked the ones from the daily. Next targets above for the bulls are 80 and the 2023-09 high at 82.91. I think we can see a futures gap up above 81 and then another huge pullback. Supply shock for Oil is still not there or we would not see the market pull back that much. Given the current macro risk we can only expect higher prices but the swings are too wild for me tbh.
current market cycle: bull trend but trading range on 1h tf
key levels: 67 - 83
bull case: Bulls have all the arguments on their side. Their only issue is that we are still seeing 5-10% intraday swings to both sides and only if the pull backs become smaller and we leave gaps behind, can we go meaningful higher and stay there. We have two open gaps on the daily chart but market would have to stay above 70 now to confirm them. 77 is the next target for the bulls which would be a higher high above the 2024-04 high.
Invalidation is below 70 - if we drop below, we most likely continue sideways inside the big range until we maybe get another big breakout above
bear case: US bombs on Iran. Interesting to see if we stay below 77 and move sideways. I can not see it but I obviously did not saw the 11% pullback on Monday as well. That was insane. Best bears can hope for is to move sideways and continue with the deep pullbacks. Bears can also make big money on these wild swings, which is not something seen in strong bull trends.
Invalidation is above 77
short term: Bullish but too cautious to trade it. Future gap ups were sold heavily and market has not found acceptance above 73 for the entire week. Still expecting 77 to get hit and there is no reason why we can’t see 80$ on oil over next 2 weeks.
medium-long term - Update from 2025-06-22: No bigger opinion other than “don’t be a bear here”. No idea if market can sustain the buying and stay above 70 for longer or even 80 for that matter. Too many big risks which will move the market big time.
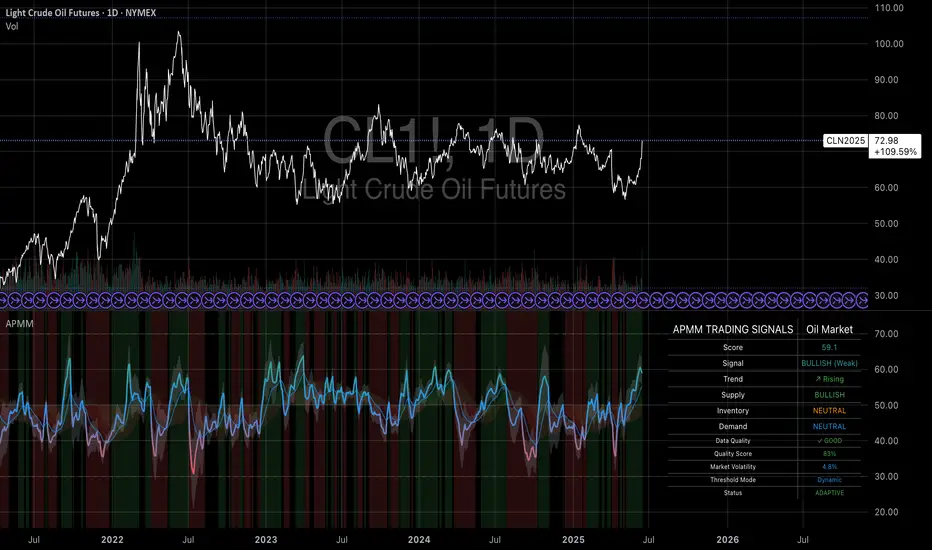
Why Oil Stays Bullish: Israel-Iran and the APMMCurrent geopolitical tensions between Israel and Iran have precipitated significant volatility in global oil markets. This study analyzes the immediate and medium-term impacts of the conflict on oil prices utilizing the Advanced Petroleum Market Model (APMM), a multifactorial fundamental analysis framework. The analysis reveals that both robust supply fundamentals and geopolitical risk premiums are currently supporting oil prices at elevated levels.
1. Introduction
Global energy markets are experiencing upward pressure from escalating tensions between Israel and Iran. Israeli military actions against Iranian targets have triggered immediate oil price responses, with Brent crude rising up to 10% and reaching the highest levels since January 2024 (Al Jazeera, 2024). The Strait of Hormuz, through which approximately 20% of global oil trade flows, remains central to geopolitical risk pricing in oil markets (CNBC, 2024).
2. Current APMM Market Assessment
The Advanced Petroleum Market Model currently indicates a Bullish (Weak) regime with a composite score of 69.1 and a rising trend. Supply indicators are bullish, inventory and demand are neutral. The model's adaptive status shows it is successfully adjusting to current market conditions.
3. Market and Model-Based Scenario Analysis
- Brent Crude: 5-7% increase to over $87/barrel
- WTI Crude: 6% daily gain
- Geopolitical Risk Premium: $8-12/barrel (Goldman Sachs, 2024)
The APMM's current reading suggests oil markets are in a "Fundamental Support Regime" reinforced by geopolitical risk premiums. Geopolitical uncertainty is inherently bullish for oil prices as it increases supply disruption risks and drives precautionary demand.
Scenario Probabilities
- Base Scenario (65%): Bullish (Weak) regime persists, prices stabilize at $75-85/barrel
- Escalation (25%): Strong Bullish regime, prices at $85-95/barrel
- Extreme (10%): Extreme Bullish regime, prices above $100/barrel
4. Long-term and Policy Implications
- Diversification: Importers seek alternatives to Middle Eastern oil
- Strategic Reserves: Governments reconsider reserve strategies
- Energy Transition: Geopolitical risks strengthen investments in renewables
5. Conclusion
Despite robust supply, oil prices are supported by both fundamentals and persistent geopolitical risk premiums. The APMM reflects this environment with a Bullish (Weak) signal and rising trend. Geopolitical uncertainty remains a key bullish factor for oil markets.
References
Al Jazeera. (2024). Oil prices spike as Israel strikes Iran amid Middle East tensions.
Armstrong Economics. (2024). Oil Prices & the Israel-Iran Crisis - A Historical Perspective.
BBC. (2024). Israel Iran: What could conflict mean for oil and gas prices?
Chen, S., Liu, P., & Wang, J. (2024). Uncertainty about interest rates and crude oil prices. Financial Innovation, 10(1), 1-28.
CNBC. (2024). Oil prices could spike to $95 if Iran-Israel conflict escalates, Goldman Sachs warns.
Goldman Sachs. (2024). Commodities Research: Middle East Risk Premium in Oil Markets.
Al-Shboul, M., & Alqaralleh, H. (2025). Dynamic Effects of Economic Uncertainties and Geopolitical Risks on Saudi Stock Market Returns. Journal of Risk and Financial Management, 18(1), 12.
HMMMCL1! Crude Oil Futures – 1D & 4H Technical Breakdown by GOAT
This chart presents a comprehensive multi-timeframe analysis of NYMEX Crude Oil Futures (CL1!), utilizing daily and 4-hour views to outline key technical levels, trend momentum, and potential trade setups.
🟤 Left Panel – CL1! Daily Chart (1D):
Macro Resistance Test: Price is retesting a major descending trendline from the 2022 highs, now acting as a key long-term resistance zone between 75.80–77.00.
Breakout Structure: A strong push from the $62.50 base has created a steep rally, with price entering a historically reactive supply zone.
Rejection Risk: Highlighted red box signals a high-probability reversal zone unless price confirms a clean breakout above trendline resistance.
RSI Observation: Daily RSI near overbought levels (~78), reflecting possible exhaustion and signaling caution for bulls.
🟠 Right Panel – CL1! Intraday Chart (4H):
EMA Structure: Price riding the 21/50/100 EMA cluster with trend confirmation—momentum remains bullish but flattening.
Channel & Pullback Setup: Short-term ascending trendline may act as a bounce point. Failure could shift price toward 71.30 or lower.
Divergence Watch: Bearish RSI divergence forming, suggesting weakening momentum on recent highs.
Trade Zone: Boxed region shows a potential long setup targeting the 75.80–77.00 area with a stop below 71.30, giving a clear R:R window.
📉 RSI Panels:
Daily RSI: Approaching historical overbought levels. Traders should watch for momentum reversal or confirmation through trend continuation.
4H RSI: Divergence vs price highs and loss of recent bullish slope could foreshadow a short-term correction.
🧠 Summary:
Crude oil is at a critical confluence zone, testing a macro trendline on the daily and showing slowing momentum intraday. Price action over the next few candles will likely determine whether we see a breakout continuation toward 80+ or a rejection back toward the mid-60s.
⚙️ Educational chart designed for technical traders – not financial advice.


$100 a barrel coming soon for Crude oil futures In this video we focus on the current accumulation in the oil chart and the prospect of higher prices ahead .
I highlight how the respect of the previous quinquennial pivots gave us a 45% move to the upside in the past 8 weeks .
Looking ahead on the monthly timeframe we have the following confluences above the current price of $75 .
Above the current pa we have the point of control at $ 88 and the avwap at $97, if we can reclaim the poc I think we will continue to push up to the fib levels that I have mentioned in the video.
In addition to the above we also have the decennial pivots at $107/$112 alongside the value area high .
All of this validates for me why oil will be pushing back up throughout the course of the year .
Tools used in the video
Tr pocket , pivots , fived range volume profile and fib expansion

MCL to $71.50Oil has just crossed a strong upwards trend line with 4 touch points indicating a move to the downside. Price target $71.50 in the short term.
Because of the situation in the middle east at the current moment, price has the potential to move back towards the previous swing high. If price closes above the opposite trend line I will cut all of my position.
