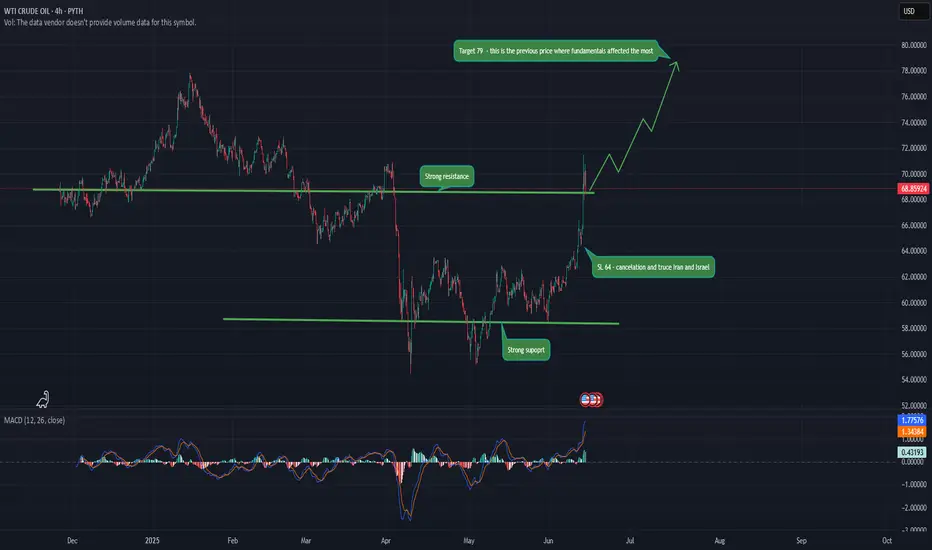
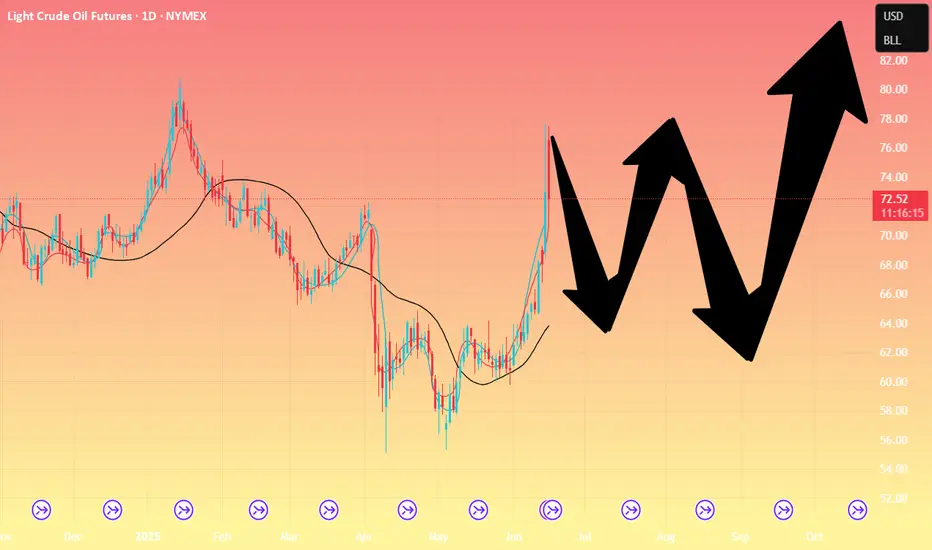
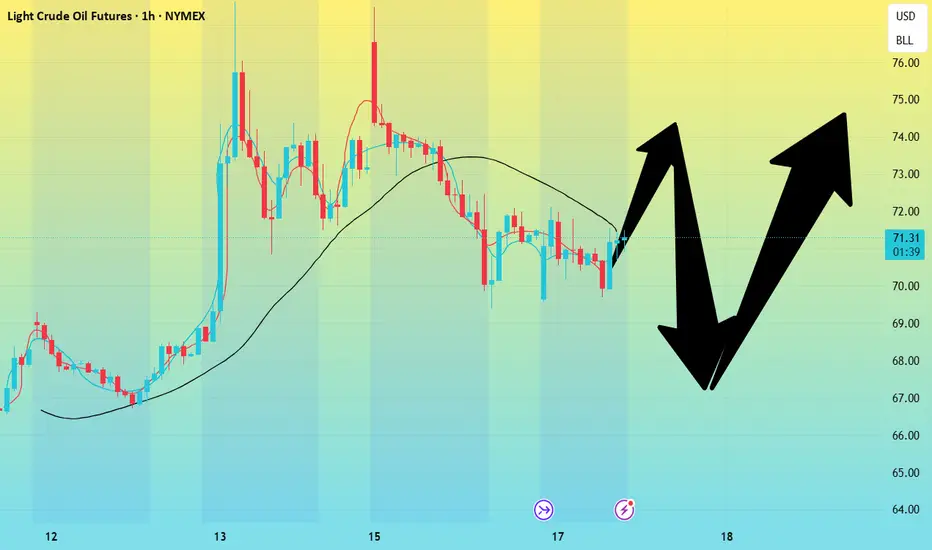
Crude oil------Buy around 74.00, target 75.00-76.50Crude oil market analysis:
Crude oil has been strong recently, and it is also because of the support of fundamentals and inventory data that crude oil has begun to strengthen. Today's idea is still bullish on crude oil. Continue to buy after the retracement. The daily moving average has begun to diverge. The small support for buying has reached around 72.00. The suppression position is around 74.00 and 77.60. I estimate that it will form a small shock and then break through and rise again. If it does not break 70.00, it is still strong. Buy crude oil around 74.00 today.
Fundamental analysis:
The interest rate results announced by the Federal Reserve last night remained unchanged at 4.25%-4.50%, and the fourth consecutive meeting remained unchanged, which was in line with market expectations. The uncertainty of the United States about the future has led to no major changes in monetary policy in the near future.
Operational suggestions
Crude oil------Buy around 74.00, target 75.00-76.50
WTI1! trade ideas
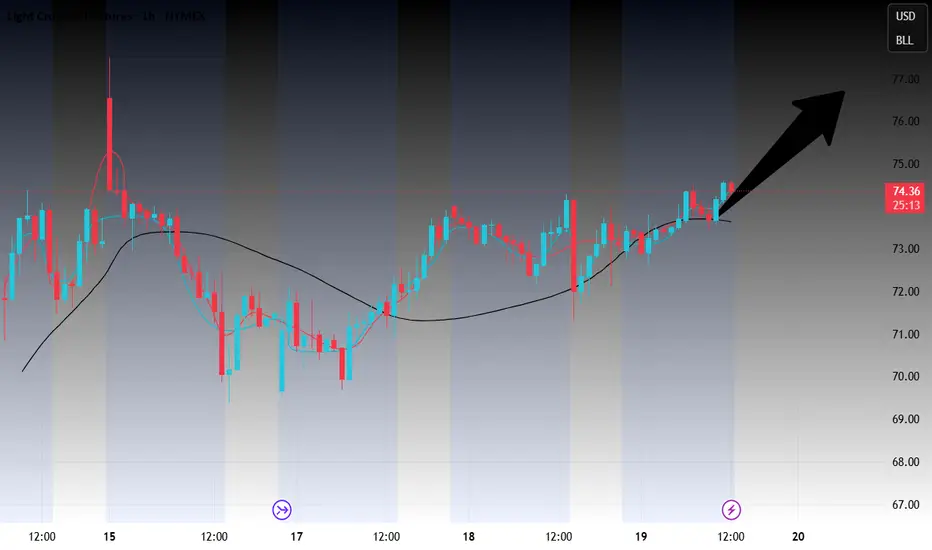
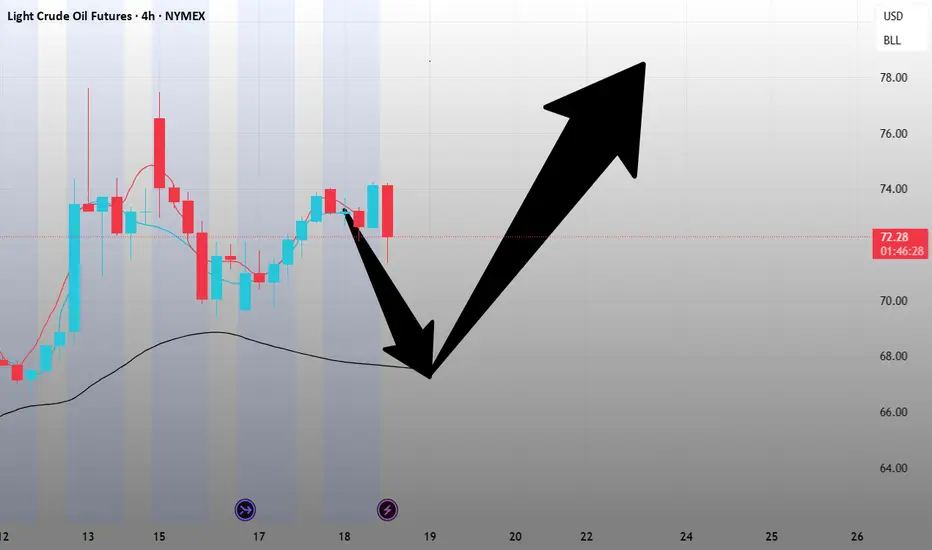
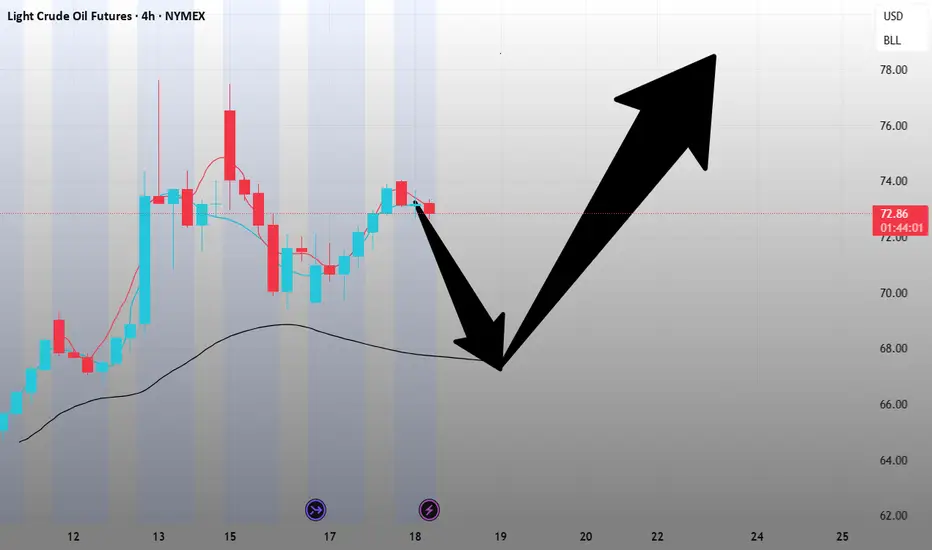
Crude Oil Pushing Into Supply Zone — Watching for Breakout or ReCrude Oil (CL) has been trending strongly bullish today — price is now testing the red supply zone overhead.
I am watching very closely:
✅ If buyers can break this zone with strong momentum, I will look for a breakout continuation trade to ride the trend higher.
✅ If buyers get trapped and order flow shifts bearish inside this zone, I will look for a short opportunity targeting the green demand zone below.
Important: I always study buyer and seller behavior inside the zones first — no blind trades! I also use order flow tools to catch traps and spot aggressive traders on the wrong side of the move.
Patience first — waiting for the zone to tell me what to do. ✅

Geopolitical Oil Shocks May Be Short-Lived and Prices May Fall
Crude oil prices are climbing by over 1% today across both Brent and West Texas Intermediate, approaching their highest levels since January.
These gains are driven by rising concerns over the fallout from a potential escalation in the Israel–Iran war, especially with the prospect of direct U.S. military involvement that could widen the conflict and threaten oil supplies from the Middle East.
Talks are intensifying around a possible U.S. strategic bomber strike on Iran’s Fordow uranium enrichment facility. Such a move would mark a dangerous new phase of escalation, raising the risk of supply disruptions from key oil-exporting countries via the Strait of Hormuz or the Bab el-Mandeb Strait, according to several analysts and opinion columnists . Iran’s major oil export facilities may also be pulled into the conflict sooner rather than later.
Any attack on these energy assets could trigger a price shock that sends oil soaring toward $130 per barrel, according to estimates from JPMorgan .
The first step toward this new phase of escalation may not be far off, as former President Trump appears unshaken by potential consequences—the include regional instability to possible retaliatory attacks on U.S. and allied interests abroad. According to Axios , he is doubtful about the effectiveness of the bunker-busting bombs intended for a Fordow strike.
Even without such a strike, a prolonged conflict with little hope for a diplomatic resolution would likely increase the vulnerability of global oil flows, as reported by the Wall Street Journal earlier this week. However, such disruptions are expected to remain short-term, in my opinion.
In the longer run, this war is unlikely to be sustainable in its current form. Israel is reportedly facing a dwindling supply of interceptor missiles, with reserves potentially lasting just 12 more days at the current rate of Iranian rocket fire, according to experts cited by The Washington Post . The Journal also quoted a U.S. official who mentioned a decline in Israel’s supply of Arrow missiles used to intercept ballistic threats.
In my view, Israel will likely avoid reaching such a tipping point unless it achieves a decisive turning point in the conflict, whether through sidelining U.S. involvement or toppling Iran’s regime. If neither is achieved, Israel may resort to targeting Iran’s oil and gas export infrastructure to enforce a surrender. This action that could send oil prices into shock in the coming days. A drawn-out war in its current form is unsustainable for either side.
Still, a diplomatic solution is not entirely off the table. A senior Iranian foreign ministry official told the New York Times that Tehran may accept Trump’s offer to meet soon for a potential ceasefire discussion. Such developments could reduce the geopolitical risk premium priced into oil and potentially push U.S. crude back below $70 per barrel.
In any case, I believe any shock to oil prices would likely be temporary, as major producers are generally capable of offsetting short-term supply disruptions unless we enter into extreme scenarios, as noted by the Wall Street Journal’s Editorial Board earlier this week.
On another front, oil prices are also under increasing pressure from concerns around prolonged monetary tightening by the Federal Reserve. Jerome Powell’s speech yesterday disappointed markets, striking a more hawkish and cautious tone than before on interest rate cuts.
Policymakers have grown increasingly wary of inflation risks, particularly with the renewed trade war and rising geopolitical tensions, which could potentially push inflation above 3 percent again.
Such extended tightening could weigh further on economic growth or even trigger a recession, dragging down oil demand and keeping prices on a downward trajectory.
Monetary tightening risks also overlap with persistent negative signals from China. Despite improvements in retail sales and declining unemployment, both industrial production and fixed-asset investment slowed unexpectedly in May. Goldman Sachs also expects continued weakness in China’s housing market, which could remain at just a quarter of its 2017 peak level for years to come.
Should trade negotiations between the U.S. and China fail, both economies and oil prices could face further downward pressure.
Samer Hasn

WTI(20250619)Today's AnalysisMarket news:
Fed's June meeting - kept interest rates unchanged for the fourth time in a row, and the dot plot showed two rate cuts this year, but the number of officials who expected no rate cuts this year rose to 7, and the rate cut expectations for next year were cut to 1. Powell continued to call for uncertainty, and the current economic situation is suitable for waiting and watching. He also expects tariff-driven inflation to rise in the coming months.
Technical analysis:
Today's buying and selling boundaries:
72.69
Support and resistance levels:
75.60
74.51
73.81
71.58
70.88
69.79
Trading strategy:
Upward breakthrough of 73.81, consider entering the market to buy, the first target price is 74.51
Downward breakthrough of 72.69, consider entering the market to sell, the first target price is 71.58

What Is the Base Price for Oil?What is the base price for oil? Specifically, today we will discuss crude oil, and we can apply this understanding to other commodities as well.
I won't go into too much technical detail about the difference between the base price and the cost price for crude oil, but for most people, it helps to see the title as “Is there a bottom-line price or support level for crude oil?”
My answer is yes, and this is due to inflation. Over time, we tend to pay higher prices for food, gas and many others that we consume.
WTI Crude Oil Futures & Options
Ticker: MCL
Minimum fluctuation:
0.01 per barrel = $1.00
Disclaimer:
• What presented here is not a recommendation, please consult your licensed broker.
• Our mission is to create lateral thinking skills for every investor and trader, knowing when to take a calculated risk with market uncertainty and a bolder risk when opportunity arises.
CME Real-time Market Data help identify trading set-ups in real-time and express my market views. If you have futures in your trading portfolio, you can check out on CME Group data plans available that suit your trading needs tradingview.sweetlogin.com
Trading the Micro: www.cmegroup.com
www.cmegroup.com

Crude oil---Buy near 72.00, target 72.90-74.90Oil market analysis:
Recently, the daily crude oil line has started to pull up, and buying has begun to rise. The retracement is our opportunity to buy again. The moving average support of the daily crude oil line has begun to move up, and the pattern has reached around 69.60. Today's idea is to buy at 72.00. The pattern is difficult to see, just buy repeatedly. The fight between Iran and Israel is a great support for crude oil. In addition, there is EIA crude oil inventory data today.
Fundamental analysis:
Previously, we have been paying attention to geopolitical factors in the fundamentals. Indeed, the situation in the Middle East has also changed the way of gold and crude oil. Today we focus on the monetary policy of the Federal Reserve, and Chairman Powell's speech during the US trading time.
Operational suggestions:
Crude oil---Buy near 72.00, target 72.90-74.90
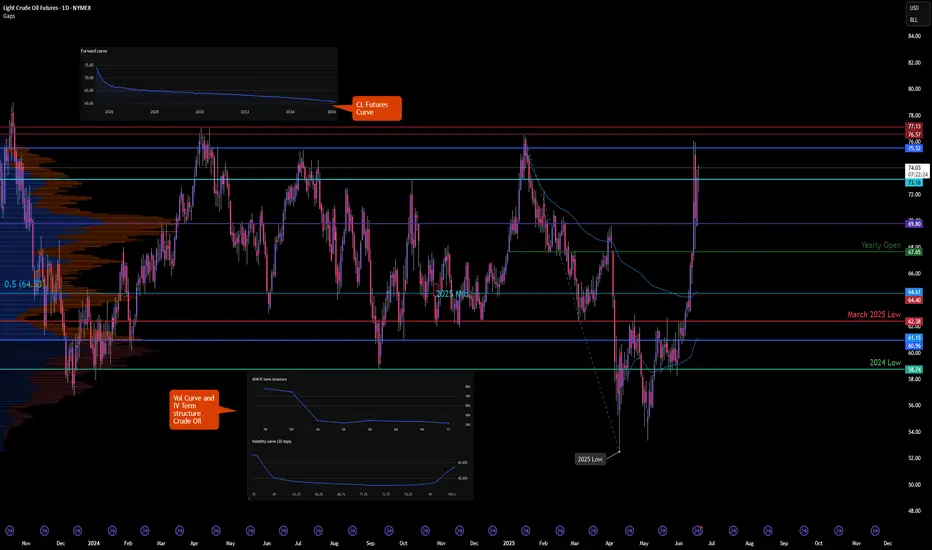
Crude Oil Futures: Navigating Geopolitical Risk and VolatilityMarket Context:
NYMEX:CL1! COMEX:GC1! CBOT:ZN1! CME_MINI:ES1! CME_MINI:NQ1! CME:6E1!
Implied volatility (IV) in the front weeks (1W and 2W) is elevated, and the futures curve is in steep backwardation. This indicates heightened short-term uncertainty tied to geopolitical tensions, particularly in the Middle East involving Iran and Israel. The forward curve, however, suggests the market is not fully pricing in sustained or escalating conflict.
We evaluate three possible geopolitical scenarios and their implications for the Crude Oil Futures market:
Scenario 1: Ceasefire Within 1–2 Weeks
• Market Implication: Short-term geopolitical premium deflates.
• Strategy: Short front-month / Long deferred-month crude oil calendar spread.
o This position benefits from a reversion in front-month prices once the risk premium collapses, while deferred months—already pricing more stable conditions—remain anchored.
o Risk: If the ceasefire fails to materialize within this narrow window, front-month prices could spike further, causing losses.
Scenario 2: Prolonged War of Attrition (No Ceasefire, Ongoing Missile and Air War)
• Market Implication: Front-end volatility may ease slightly but remain elevated; deferred contracts may begin to price in more geopolitical risk.
• Strategy: Long back-month crude oil futures.
o The market is currently underpricing forward-looking risk premiums. A persistent conflict, even without full-scale escalation, may eventually force the market to adjust deferred pricing upward.
o Risk: Time decay and roll costs. Requires a longer holding horizon and conviction that the situation remains unresolved and volatile.
Scenario 3: Full-Scale Regional War
• Market Implication: Severe market dislocation, illiquidity, potential for capital flight, and broad-based risk-off sentiment across global assets.
• Strategy: Avoid initiating directional exposure in crude. Focus on risk management and capital preservation.
o In this tail-risk scenario, crude oil could spike sharply, but slippage, execution risk, and potential exchange halts or liquidity freezes make it unsuitable for new exposure.
o Alternative Focus: Allocate to volatility strategies, defensive hedging (e.g., long Gold, long VIX futures), and cash equivalents.
o Risk: Sudden market shutdowns or gaps may make exit strategies difficult to execute.
Broader Portfolio Considerations
Given the crude oil dynamics, there are knock-on effects across other markets:
• Gold Futures: Flight-to-safety bid in Scenarios 2 and 3. Long positioning in Gold (spot or near-month futures) with defined stop-loss levels is prudent as a hedge.
• Equity Index Futures (E-mini Nasdaq 100 / S&P 500): Vulnerable to risk-off flows in Scenarios 2 and 3. Consider long volatility (VIX calls or long VX futures) or equity index puts as portfolio hedges. In Scenario 1, equities could rally on resolution optimism—especially growth-heavy Nasdaq.
• Currency Futures: USD likely to strengthen as a safe haven in Scenarios 2 and 3. Consider long positions in Dollar and Short 6E futures.
• Bond Futures: Risk-off flows theoretically should support Treasuries in Scenarios 2 and 3. Long positions in 10Y or 30Y Treasury futures could serve as a defensive allocation. Yields may retrace sharply lower if escalation intensifies. However, given the current paradigm shift with elevated yields, higher for longer rates and long end remaining high, we would not bet too heavily on Bond futures to act as safe haven. Instead, inflows in Gold, strengthening of Chinese Yuan and Bitcoin will be key to monitor here.
Scenario-based planning is essential when markets are pricing geopolitical risk in a non-linear fashion. Crude oil currently reflects a consensus expectation of de-escalation (Scenario 1), which opens the door for relative value and mean-reversion strategies in the front-end of the curve.
However, given the asymmetric risks in Scenarios 2 and 3, prudent exposure management, optionality-based hedges, and a flexible risk framework are imperative. A diversified playbook; leveraging volatility structures, calendar spreads, and cross-asset hedges offers the best path to opportunity while managing downside risk.
WTI(20250618)Today's AnalysisMarket news:
World Gold Council: 95% of central banks expect gold reserves to rise in the next 12 months.
Technical analysis:
Today's buying and selling boundaries:
72.29
Support and resistance levels:
76.53
74.95
73.92
70.66
69.63
68.04
Trading strategy:
If the price breaks through 73.92, consider buying, the first target price is 74.95
If the price breaks through 72.29, consider selling, the first target price is 70.66
WADZ & the Petrodollar RevivalGlobal FX Shift: The Rise of WADZ (2025–2026)
In mid-2025, a war between Iran and Israel spirals fast. Iran strikes hard, Israel’s defenses go offline from cyberattacks, and the U.S. surprisingly doesn’t intervene.
Instead, America steps in quietly, setting up a “peacekeeping” zone along the Jordan-Israel border. It’s called the West Asia Demilitarized Zone (WADZ) — but behind the scenes, it’s about control, not peace.
Oil jumps to $115.
Markets flip. USD/JPY and USD/TRY spike. EUR/USD slides.
Then the U.S. launches WZ-Digital, a USD-backed oil coin. Now, all oil in the region trades through America.
OPEC fractures. Saudi and UAE fall in line.
China gets iced out. USD/CNY shoots past 8.30.
In the desert, a secret U.S. city appears: The Watchtower — a hub that manages oil, data, and borders.
Regional FX Snapshot (2026)
Europe: Gas crisis deepens. EUR/USD drops to 0.95. East Europe leans on U.S.
China: Crypto-oil push fails. Capital flight triggers USD/CNY → 8.80.
Russia: Oil-for-yuan helps short-term, but ruble stays shaky.
Africa: Egypt & Morocco adopt WZ-Digital. Local currencies stay weak.
Southeast Asia: Dual oil trade (USD/WZ). SGD steady, MYR & IDR choppy.
(BRICKS+)
Latin America: Brazil, Argentina resist — then cave. USD demand surges.
Bottom Line:
By end of 2026, USD isn’t just money — it’s a global system.
WADZ quietly reprograms the rules of energy and trade.
No invasion, no headlines. Just quiet, total control.
Bye guys
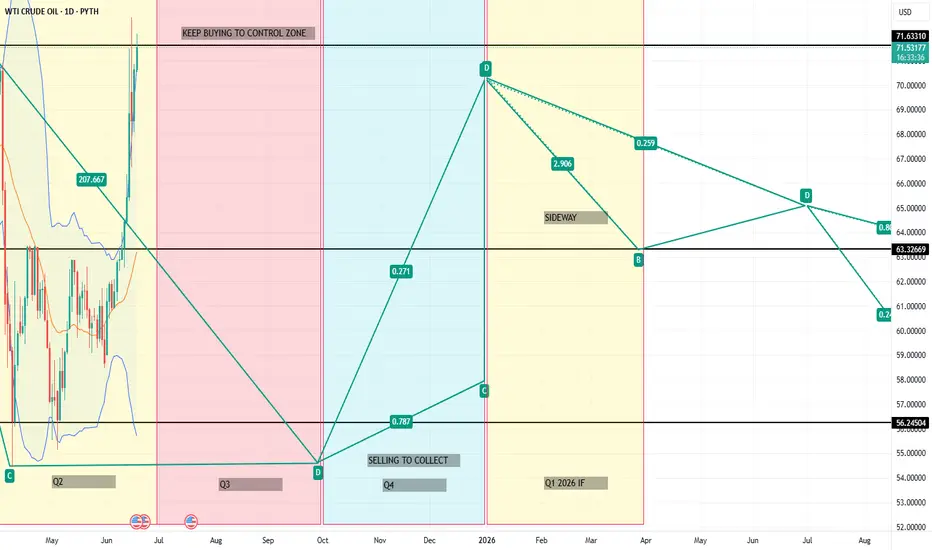
Crude oil----Buy around 71.00-72.00, target 73.00-77.00Crude oil market analysis:
Last week's crude oil was very exaggerated because it broke the super suppression of 65.00 on the daily line. Once this position was broken, crude oil began to be standard. This is also the result of our many predictions of the cycle. Crude oil purchases will continue to soar this week. In addition, the escalation of the situation in the Middle East will make it difficult for crude oil to fall in the short term. I estimate that there is a possibility of repair. The retracement during the repair is our opportunity to buy again. In addition, the delivery period of crude oil futures contracts will also cause it to fluctuate violently again.
Fundamental analysis:
There are many fundamental analyses and data recently. Geopolitical factors are the main reason for its violent fluctuations. In addition, there is a holiday in the United States this week, and there is also a Federal Reserve interest rate result.
Operation suggestions:
Crude oil----Buy around 71.00-72.00, target 73.00-77.00
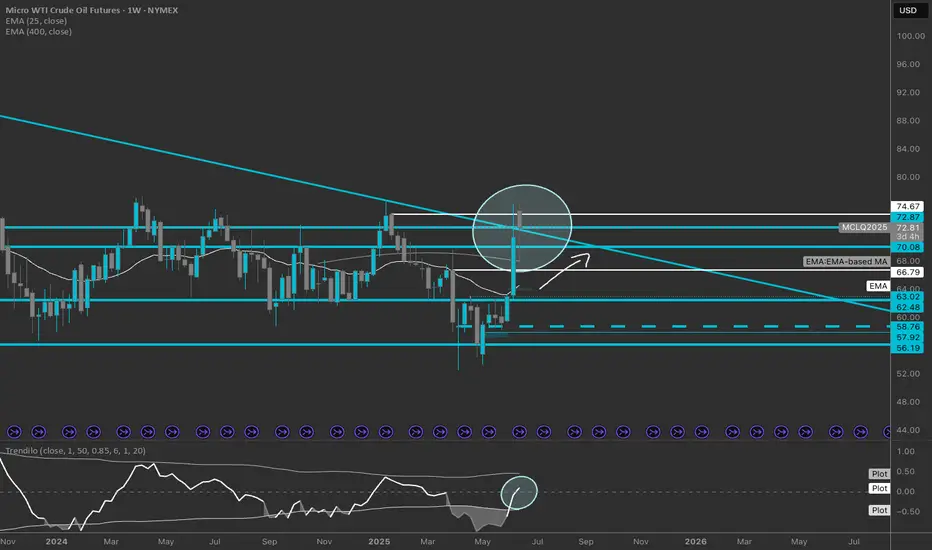
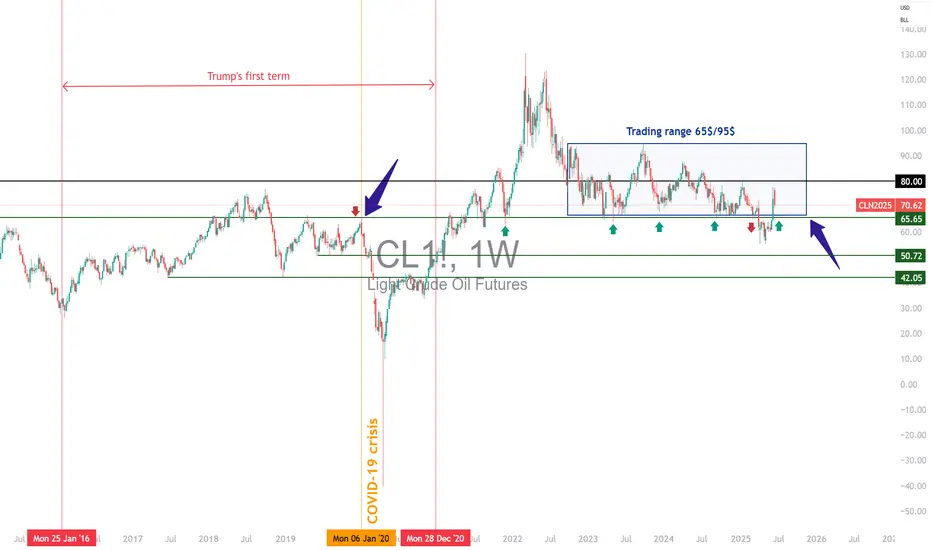
CL1! barking bearish trend. As observed in the weekly time frame, CL1 has broken a bearish trend that emerged after June 2022. Currently, CL1 exhibits bullish sentiment, and based on global news, it is likely to continue its upward trajectory.
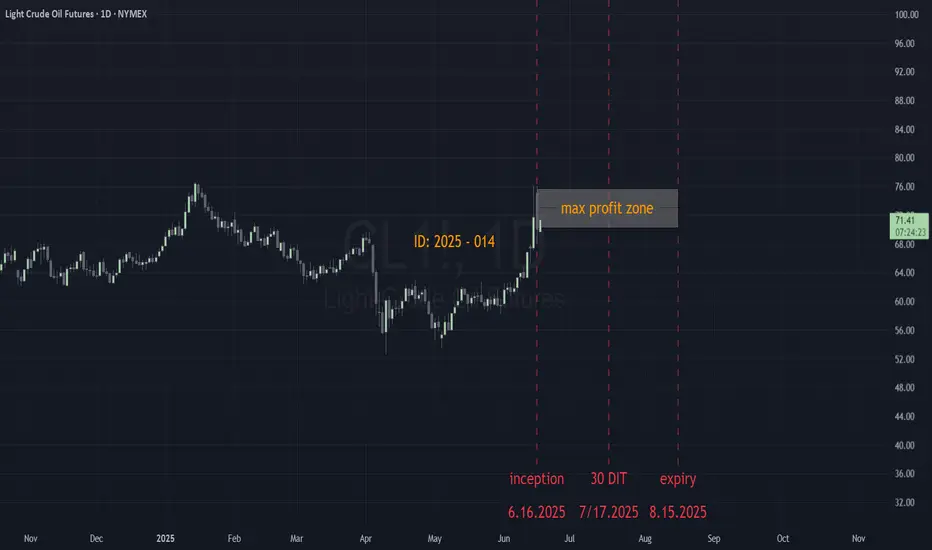
ID: 2025 - 0146.16.2025
Trade #14 of 2025 executed.
Trade entry at 60 DTE (days to expiration).
BULLISH options trade executed on Crude Oil. Once price level of $75.00 gets taken out, this trade will get adjusted to secure a risk-free trade. Targets will be 100% ROI based upon this being a balanced bullish butterfly construct.
Defined risk
Defined reward
Happy Trading!
-kevin
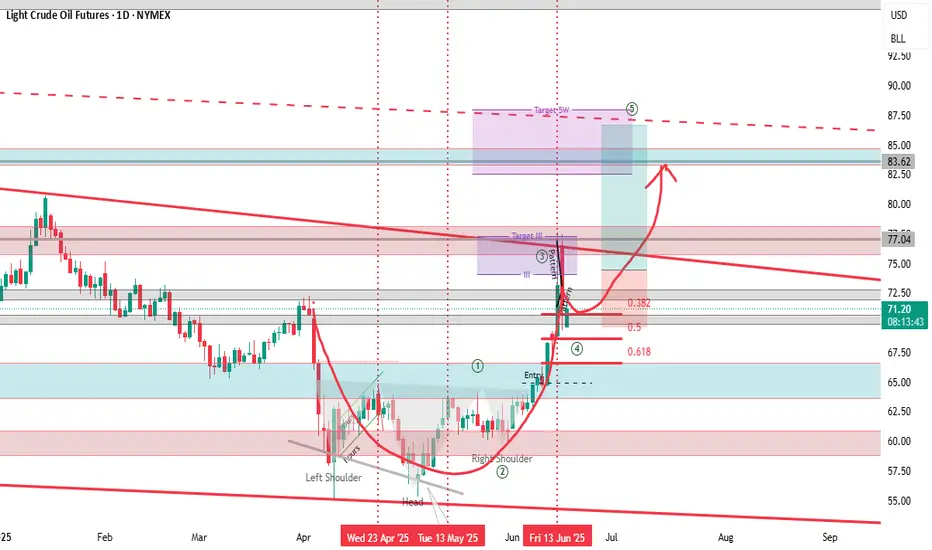
Crude Oil - Cup and HandlePotential Cup and Handle
I have a trigger upper the top .. potential short before the new long wave
Actual we can have completed the 3 of 5.
Crude oil---Buy near 71.00, target 76.00-79.00Crude oil market analysis:
We still buy crude oil in the recent daily line, but yesterday's crude oil daily line closed with a big negative line. Short-term crude oil is about to start repairing. The retracement during the repair is our opportunity to buy again. Crude oil follows the long-term trend. In addition, the war between Iran and Israel is a long-term support for crude oil purchases. If the situation escalates, crude oil may easily stand above the 100 mark in the later period. Consider buying crude oil at 71.00 today.
Fundamental analysis:
Yesterday, Iran and Israel began to bomb each other again, and the situation began to escalate.
Operation suggestions:
Crude oil---Buy near 71.00, target 76.00-79.00
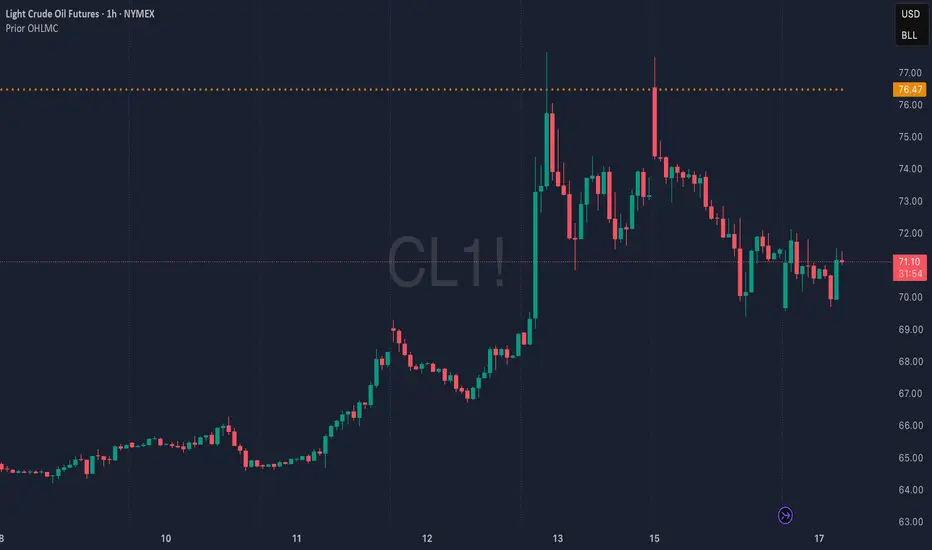
The Hidden Power of Median Price: A Recent Oil Market Case StudyIntroduction
In the world of trading, most market participants focus on popular patterns and oscillators, often missing the true “magnet” zones that drive price action. A recent move in Crude Oil (CL) perfectly illustrates how the prior year’s median price (PYM) can act as a powerful, objective key level—one that offers traders an informational edge when recognized and used properly.
Case Study: Oil’s Rally to the Prior Year Median
What Happened?
• Catalyst: Crude Oil (CL) surged several dollars overnight due to escalating geopolitical tensions and the risk of war in the Middle East.
• Key Level Test: Instead of stalling at arbitrary points, price rallied directly to the prior year’s median price—a level rarely plotted by standard indicators.
• Market Reaction: Upon reaching this PYM, oil rejected sharply not once, but twice in consecutive sessions, creating what many would recognize as a double top.
• Missed Context: While most traders saw only the double top pattern, those aware of the PYM understood the deeper reason for this reversal, adding conviction to their trade ideas.
Why the Median Price Matters
• Objective Anchor: The median price of the prior year is a statistically robust, non-arbitrary level that reflects the “center of gravity” for a full year’s worth of price action.
• Institutional Awareness: Professionals and trading algorithms often use these levels as reference points for liquidity and mean reversion, even if retail traders overlook them.
• Trade Conviction: When a double top or reversal forms at a prior year’s median price, it transforms a generic pattern into a high-conviction setup, providing a clear, data-driven reason for price to reverse or stall.
Data Snapshot: CL Price Action (June 2025)
Date High Low Close Event/Reaction
June 12, 2025 $77.52 $69.50 $73.96 Sharp rally to PYM, first rejection
June 14, 2025 $74.02 $71.48 $72.98 Second push, another rejection
June 15, 2025 $74.22 $73.19 $73.69 Double top confirmed
The $74–$77 area aligns with the 2024 median/average price for WTI crude oil, reinforcing its significance as a magnet and reversal zone.
Lessons for Traders
• Beyond Oscillators: Oscillators and generic chart patterns often lack context and can lead to false signals. Key levels like the median price explain why price reverses, not just where patterns form.
• Edge Through Awareness: Plotting prior year medians and other session-based key levels can turn ordinary setups into high-probability trades by revealing hidden order flow and institutional logic.
• Professional Mindset: Treating these levels as “market memory” aligns your approach with how professionals view the market, offering a real edge over retail-centric tools.
Conclusion
The recent oil rally and rejection at the prior year’s median price is a compelling demonstration of the power of objective, price-based key levels. While most traders saw only a double top, those aware of the PYM had a clear, data-driven reason for heightened conviction and precise execution. Incorporating such levels into your trading toolkit can provide a true informational edge—one that most indicator vendors and platforms still ignore.
Ready to take your trading to the next level? Start plotting median price levels and see the difference for yourself!
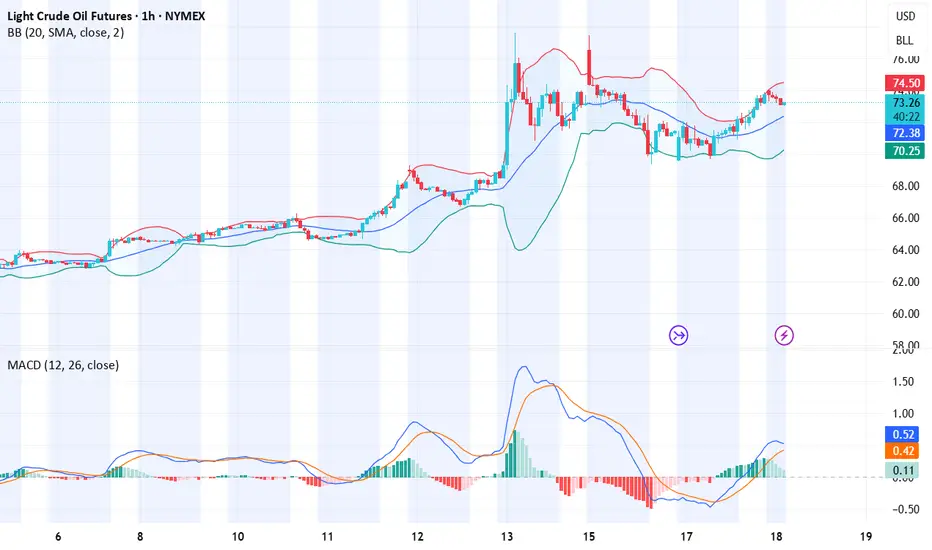
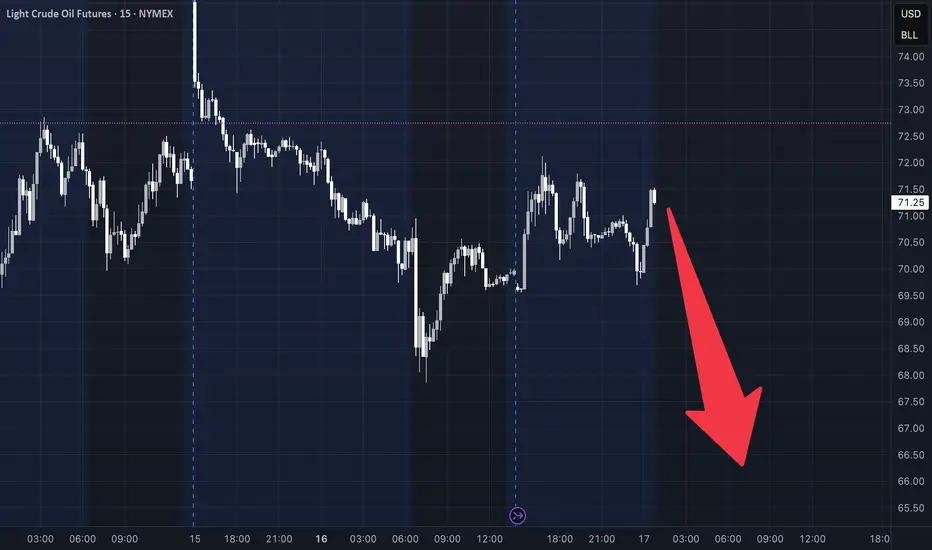
CL Futures Weekly Trade Setup — June 17, 2025🛢️ CL Futures Weekly Trade Setup — June 17, 2025
🎯 Instrument: CL (Crude Oil Futures)
📉 Strategy: Short Swing
📅 Entry Timing: Market Open
📈 Confidence: 68%
🔍 Model Insights Recap
🧠 Grok/xAI – Bearish due to overbought RSI + price stalling near MAs
🤖 Claude/Anthropic – Bearish pullback expected, despite recent strength
📊 Llama/Meta – Overextended Bollinger Band + RSI = short bias
🧬 DeepSeek – Supports downside via divergence + high volatility
⚠️ Gemini/Google – Bullish thesis based on momentum; diverges from consensus
📉 Consensus Takeaway
While short-term momentum is strong, most models forecast a pullback due to:
🔼 Overbought RSI readings
📈 Price extended well above key moving averages
🧨 High volatility and profit-taking zone near $73–$74
✅ Recommended Trade Setup
Metric Value
🔀 Direction Short
🎯 Entry Price $72.65
🛑 Stop Loss $74.20
🎯 Take Profit $68.80
📏 Size 1 contract
📈 Confidence 68%
⏰ Timing Market Open
⚠️ Key Risks & Considerations
🌍 Geopolitical events or OPEC news can cause unexpected surges
📉 If bullish momentum resumes, upside breakout could invalidate short thesis
📏 Risk management is critical—stick to stop-loss if price breaks above $74.20
🧾 TRADE_DETAILS (JSON Format)
json
Copy
Edit
{
"instrument": "CL",
"direction": "short",
"entry_price": 72.65,
"stop_loss": 74.20,
"take_profit": 68.80,
"size": 1,
"confidence": 0.68,
"entry_timing": "market_open"
}
💡 Watch price action at the open. If oil opens weak or fails to reclaim $73, this short setup has a strong edge.
Geopolitics (Iran/Israel), 6 relevant risk barometersGeopolitics is in the spotlight this week, along with the FED's monetary policy decision. Geopolitical news is covered by the general media, so there's no need here to repeat information that's accessible to everyone. We therefore propose to review our selection of stock market barometers which, in our opinion, best measure the intensity of geopolitical risk.
1) Oil and natural gas prices
Naturally, oil price trends are the main barometer of the geopolitical risk of the current confrontation between Israel and Iran. Although Iran accounts for just 3% of the world's oil supply, the region itself represents 20%, and above all there is a risk of closure of the Strait of Hormuz, through which 25% of the world's oil supply passes. Technical analysis of the oil price is therefore the primary tool for measuring the intensity of current geopolitical tensions. The price of oil recently returned to the former technical support of $65, but there is no major bullish technical signal as long as the price of US crude oil remains below resistance at $80. We must therefore keep a close eye on the $80 threshold for US oil.
2) The trend of the S&P 500 index, the benchmark of Western finance
The equity market is the second barometer of geopolitical risk that we offer. The most important thing is to select the stock indices that best represent the perception of geopolitical tensions. We believe that the S&P 500 future contract does this job well, as it is the most widely traded stock market futures index in terms of volume by global high finance.
A few days ago, we published a detailed graphical analysis of the S&P500 index, which you can consult by clicking on the image below.
3) Trends on the main stock markets in the Near and Middle East
Equity markets in the Near and Middle East are excellent indicators of the current perception of geopolitical tensions between Iran and Israel. We suggest you take a look at the Saudi Arabian Stock Exchange (Tadawul), the region's largest in terms of market capitalization. Naturally, you should also follow the trend of the Tel Aviv Stock Exchange's flagship index, the TA 35, as well as that of the Egyptian stock market. These markets have the advantage of being open on Sundays, and are often a good early indicator of trends in Asia and Europe for Monday morning.
4) The trend of the US dollar (DXY) on the foreign exchange market (Forex) and of gold on the commodities market
On the floating foreign exchange market (FX), it is the US dollar that plays to the full its safe-haven aspect. In the event of geopolitical tensions spiraling out of control, it would make a strong bullish reversal. This week, however, the US dollar will be under the influence of the FED.
So it's best to trust gold's trend as a barometer of geopolitical risk. Geopolitics is not necessarily the dominant fundamental factor, but rather the dynamics of interest rates and the US dollar.
5) The TRUFLATION trend
If current geopolitical tensions were to become a major global shock, international trade would be disrupted, and transport difficulties would lead to a sharp rise in prices, particularly for raw materials and industrial goods. This potential price rise would then be rapidly reflected in TRUFLATION, the benchmark for real-time price dynamics in the USA.
DISCLAIMER:
This content is intended for individuals who are familiar with financial markets and instruments and is for information purposes only. The presented idea (including market commentary, market data and observations) is not a work product of any research department of Swissquote or its affiliates. This material is intended to highlight market action and does not constitute investment, legal or tax advice. If you are a retail investor or lack experience in trading complex financial products, it is advisable to seek professional advice from licensed advisor before making any financial decisions.
This content is not intended to manipulate the market or encourage any specific financial behavior.
Swissquote makes no representation or warranty as to the quality, completeness, accuracy, comprehensiveness or non-infringement of such content. The views expressed are those of the consultant and are provided for educational purposes only. Any information provided relating to a product or market should not be construed as recommending an investment strategy or transaction. Past performance is not a guarantee of future results.
Swissquote and its employees and representatives shall in no event be held liable for any damages or losses arising directly or indirectly from decisions made on the basis of this content.
The use of any third-party brands or trademarks is for information only and does not imply endorsement by Swissquote, or that the trademark owner has authorised Swissquote to promote its products or services.
Swissquote is the marketing brand for the activities of Swissquote Bank Ltd (Switzerland) regulated by FINMA, Swissquote Capital Markets Limited regulated by CySEC (Cyprus), Swissquote Bank Europe SA (Luxembourg) regulated by the CSSF, Swissquote Ltd (UK) regulated by the FCA, Swissquote Financial Services (Malta) Ltd regulated by the Malta Financial Services Authority, Swissquote MEA Ltd. (UAE) regulated by the Dubai Financial Services Authority, Swissquote Pte Ltd (Singapore) regulated by the Monetary Authority of Singapore, Swissquote Asia Limited (Hong Kong) licensed by the Hong Kong Securities and Futures Commission (SFC) and Swissquote South Africa (Pty) Ltd supervised by the FSCA.
Products and services of Swissquote are only intended for those permitted to receive them under local law.
All investments carry a degree of risk. The risk of loss in trading or holding financial instruments can be substantial. The value of financial instruments, including but not limited to stocks, bonds, cryptocurrencies, and other assets, can fluctuate both upwards and downwards. There is a significant risk of financial loss when buying, selling, holding, staking, or investing in these instruments. SQBE makes no recommendations regarding any specific investment, transaction, or the use of any particular investment strategy.
CFDs are complex instruments and come with a high risk of losing money rapidly due to leverage. The vast majority of retail client accounts suffer capital losses when trading in CFDs. You should consider whether you understand how CFDs work and whether you can afford to take the high risk of losing your money.
Digital Assets are unregulated in most countries and consumer protection rules may not apply. As highly volatile speculative investments, Digital Assets are not suitable for investors without a high-risk tolerance. Make sure you understand each Digital Asset before you trade.
Cryptocurrencies are not considered legal tender in some jurisdictions and are subject to regulatory uncertainties.
The use of Internet-based systems can involve high risks, including, but not limited to, fraud, cyber-attacks, network and communication failures, as well as identity theft and phishing attacks related to crypto-assets.
WTI(20250617)Today's AnalysisMarket news:
Revised version of the Republican tax cut bill in the US Senate: It is planned to raise the debt ceiling to 5 trillion, and the overall framework is consistent with the House version.
Technical analysis:
Today's buying and selling boundaries:
70.41
Support and resistance levels:
75.98
73.90
72.55
68.27
66.92
64.84
Trading strategy:
If the price breaks through 72.55, consider buying, and the first target price is 73.90
If the price breaks through 70.41, consider selling, and the first target price is 68.27

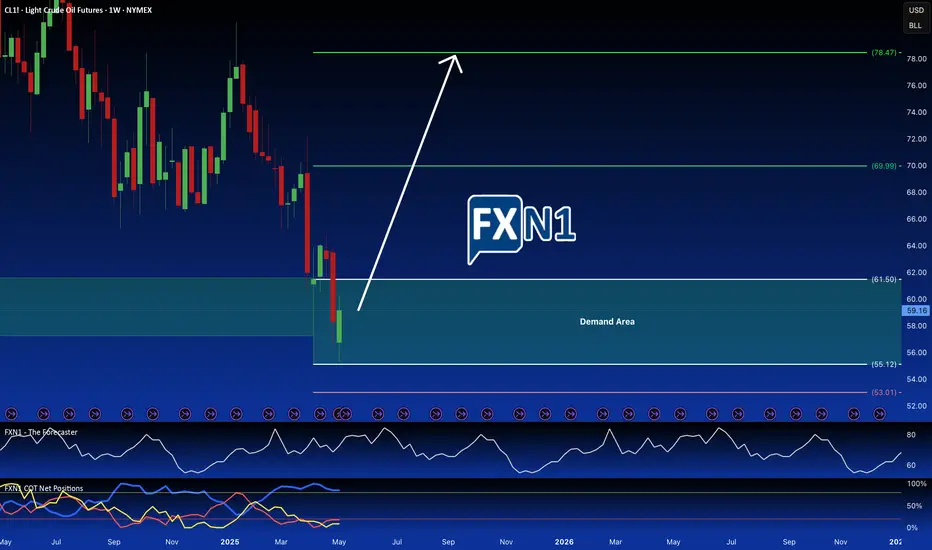
Oil Rebounds to $59 as US Inventories Drop – Reversal Ahead?After recent declines, crude oil futures (CL1!) staged a modest recovery during Thursday’s session, trading near $59.10 per barrel. The rebound comes as US crude inventories unexpectedly dropped, easing concerns about oversupply and providing a short-term lift to prices.
Key Drivers Behind the Rebound
US Inventory Drawdown – The latest EIA report showed a decline in crude stockpiles, signaling stronger demand and helping prices stabilize.
Technical Support Holds Firm – The bounce aligns with a critical daily demand zone, which previously acted as a strong support level on the weekly chart.
Market Sentiment Shifts – While retail traders remain bearish, commercial traders (often considered "smart money") are increasing long positions, hinting at a potential trend reversal.
Traders should watch for follow-through buying to confirm whether this is a short-term correction or the start of a larger reversal.
Bottom Line: Oil’s rebound is fueled by fundamentals (lower inventories) and technicals (strong demand zone). With commercial traders betting on higher prices, the stage may be set for a bullish reversal—if buyers sustain momentum.
✅ Please share your thoughts about CL1! in the comments section below and HIT LIKE if you appreciate my analysis. Don't forget to FOLLOW ME; you will help us a lot with this small contribution.
WTI(20250616)Today's AnalysisMarket news:
Trump: The United States may still intervene in the Iran-Israel conflict. If Iran launches an attack on the United States, the United States will "fight back with all its strength on an unprecedented scale." Iran and Israel should reach an agreement.
Technical analysis:
Today's buying and selling boundaries:
71.11
Support and resistance levels:
78.59
75.79
73.98
68.24
66.43
63.64
Trading strategy:
If the price breaks through 73.98, consider buying in, the first target price is 75.79
If the price breaks through 71.11, consider selling in, the first target price is 68.24

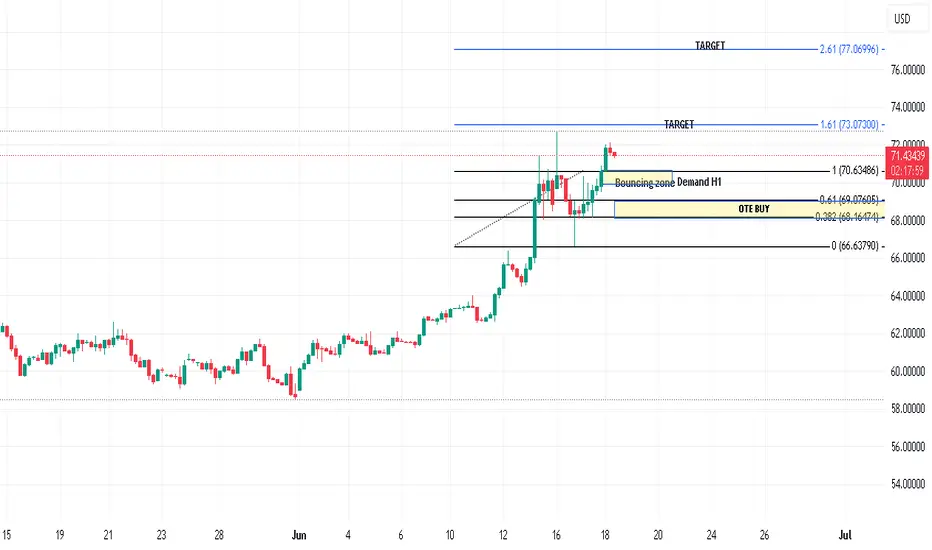
Crude Oil - we follow up with the momenetumCrude Oil Analysis: Why Prices Could Keep Rising Amid Israel-Iran Conflict? 🛢 🛢 🛢
📈 📈 📈The ongoing tensions between Israel and Iran have significantly intensified geopolitical risk in the Middle East—home to a third of the world’s oil supply. As hostilities escalate, crude oil prices are poised for continued upward momentum due to three key factors:
1️⃣ Supply Disruption Fears: The Strait of Hormuz, a critical chokepoint through which 20% of global oil flows, could be compromised if Iran retaliates or is targeted more directly. Any disruption—even speculative—typically sends prices higher.
2️⃣ Production Uncertainty: Iran, a major OPEC member, may face new sanctions or physical damage to infrastructure. In retaliation, Iran could also target regional energy infrastructure, including in the UAE or Saudi Arabia, shrinking global supply.
3️⃣ Market Sentiment and Risk Premiums: Investors tend to price in risk quickly. With oil markets already tight due to OPEC+ cuts and tepid U.S. production growth, heightened instability adds a strong speculative premium.
Bottom Line: Unless the Israel-Iran conflict de-escalates, crude oil has a strong bullish case. With limited spare capacity globally and increased geopolitical fragility, expect prices to remain elevated or climb further—especially if rhetoric turns into regional escalation. 💡 💡
📌 Trade plan
⬇️ Entry : On market open
✅Target : 79.00
❌SL: 64.00