CRM trade ideas

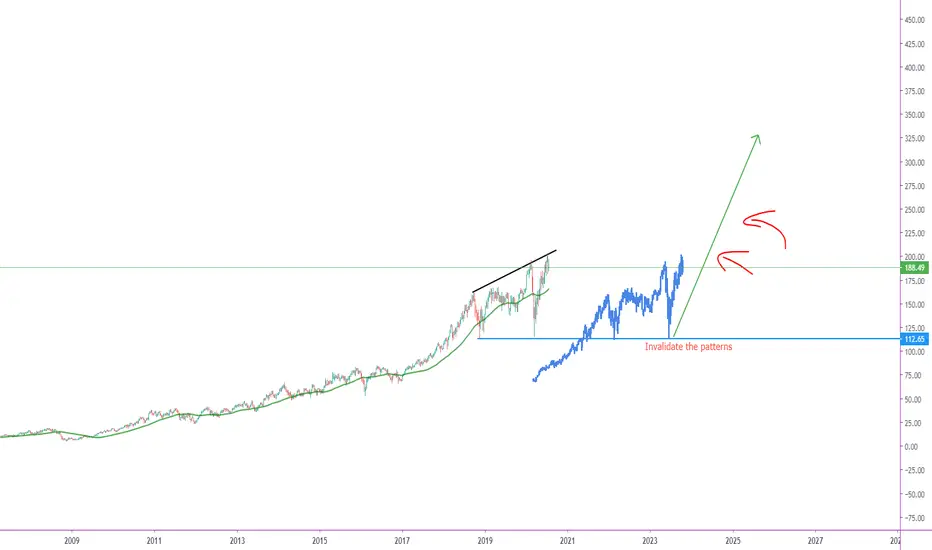
CRM LongAll I hear on the media is tech rotation. Tech too heavy. People forget Tech has few things going that no other sectors have. One tech is the new commerce. Due to Corona virus it is the commerce. Growth is heavily expected. Not US but rest of the world is worried and wants to park their money somewhere there is return for their money. There is no alternative to Tech stocks. This is the new normal. Who will bring growth giants sitting on pile of money like Apple, Google, Fb, Microsoft, NVDA, CRM list goes on and on.
Media is selling fear into lots of new Robinhood traders so they can scoop some of this names they missed on. Look at the forward P/E for most of these names. After their 15 to 20% decline they don't seem this bad. Here is one example CRM. If this week closes even slightly positive this is great long set up. If not price i think will consolidate near this area for few day and then bounce.
Hope this helps. In business weak gets weaker and money man wins money.
This is not a recommendation to buy or sell. This is for educational purposes. Please do your own homework before putting your hard earned money on line strictly based on a post on any websites.


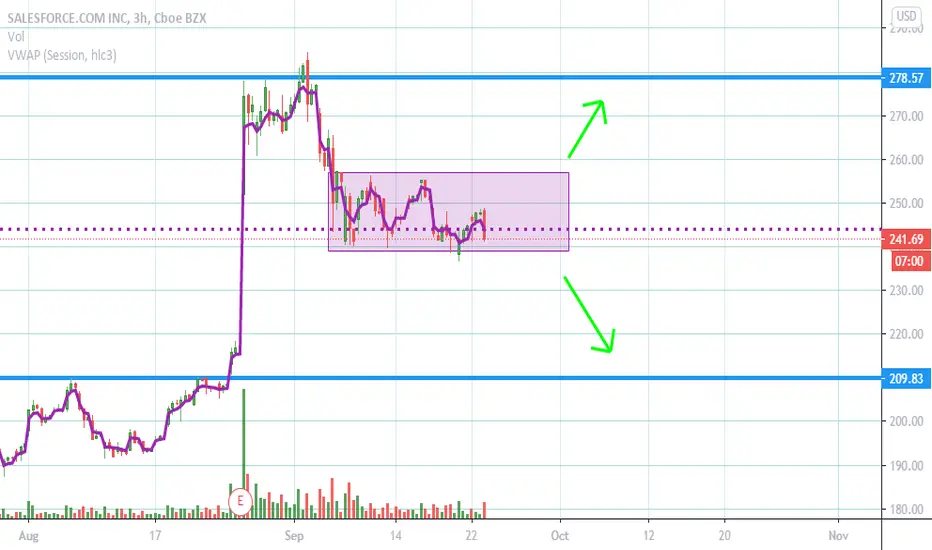
CRM Analysis Bullish Over: 254.38
Bearish Under 240.14
Gap Fill: 218.35
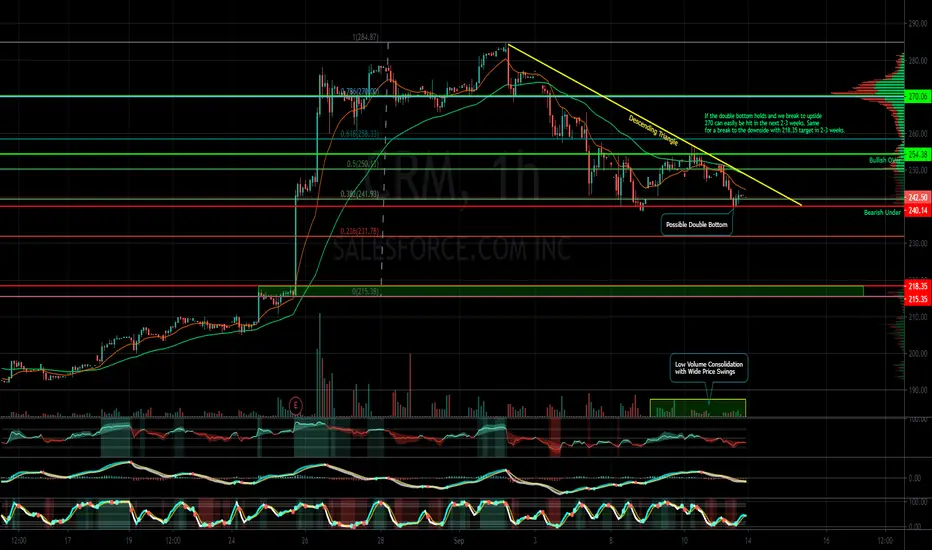
Descending Triangle with extremely low volume and wide price swings. I'm expecting a big move soon. If the double bottom holds and we break to upside 270 can easily be hit in the next 2-3 weeks. Same for a break to the downside with 218.35 target in 2-3 weeks.
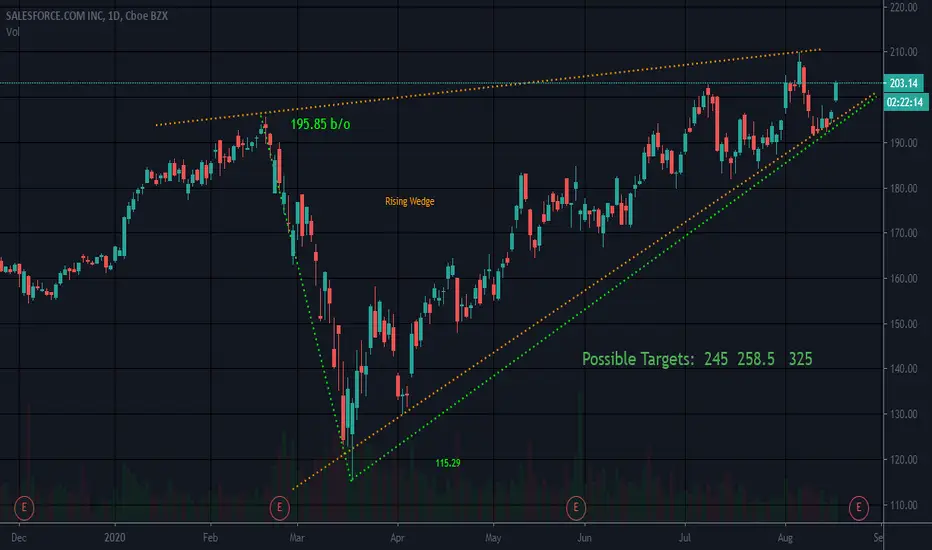
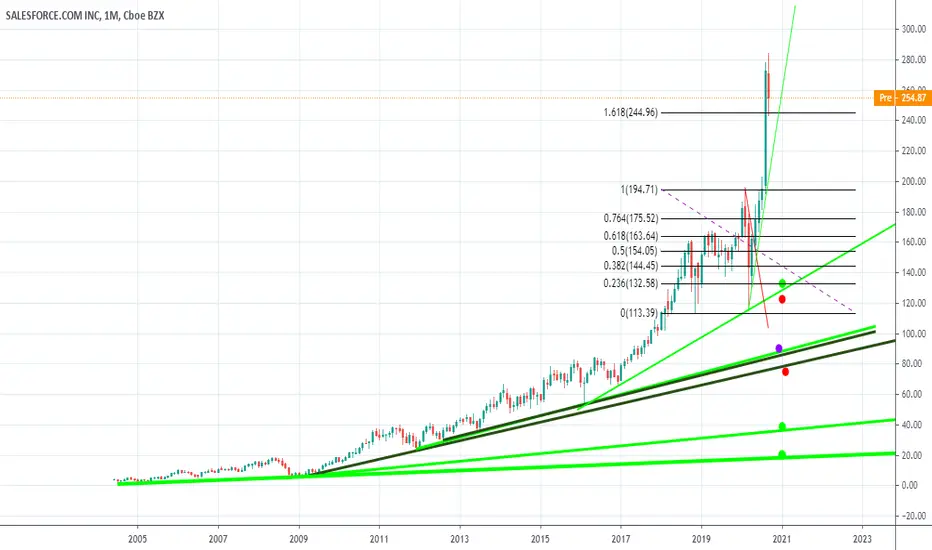
V Bottom Rising WedgeMomentum is riding with this one as well as a rising wedge. CRM has has dipped briefly out of rising wedge when under 195ish.
Perhaps it will not break through any further.
Rising wedges are bearish. Too many buyers without healthy pull backs, leaves no buyers when selling starts. But who knows when that will be? Could hit some targets before or if it ever happens. WDAY has fallen from it's rising wedge already and seems to have recovered. Seems safer to me. We are all different though
Not a recommendation
Fake breakout?We managed to drop below $250 but then we quickly bounced back. If we hold $245-250, this might be a very good trade. Buy @ $250, TP $275-280, SL $240.

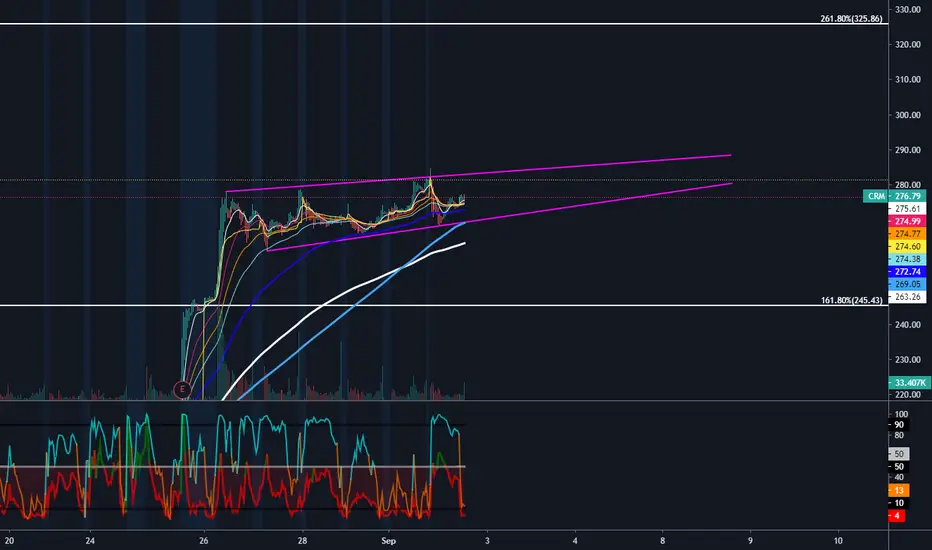
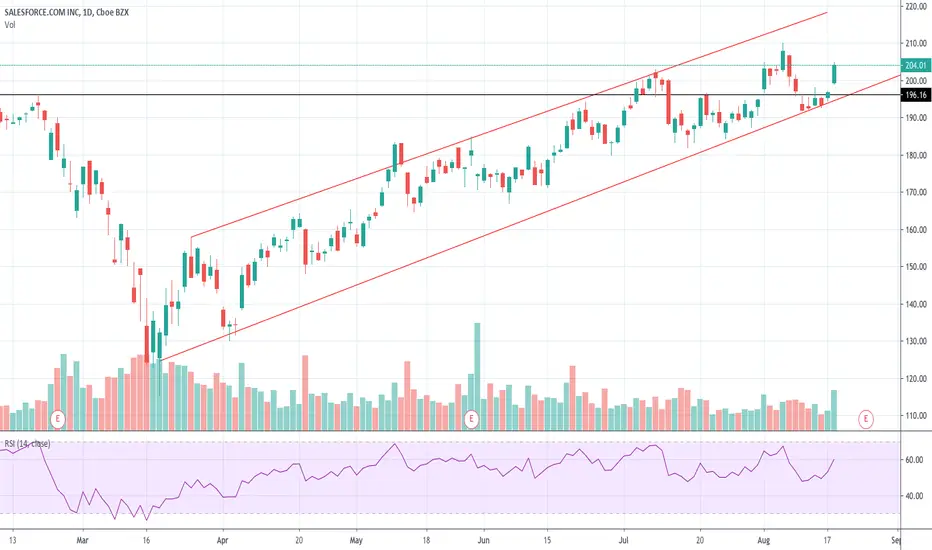
CRM - Clear channel has formedWaiting for breakout before opening a position, but we are looking bullish
Bullish target - $325
Bearish target - $246
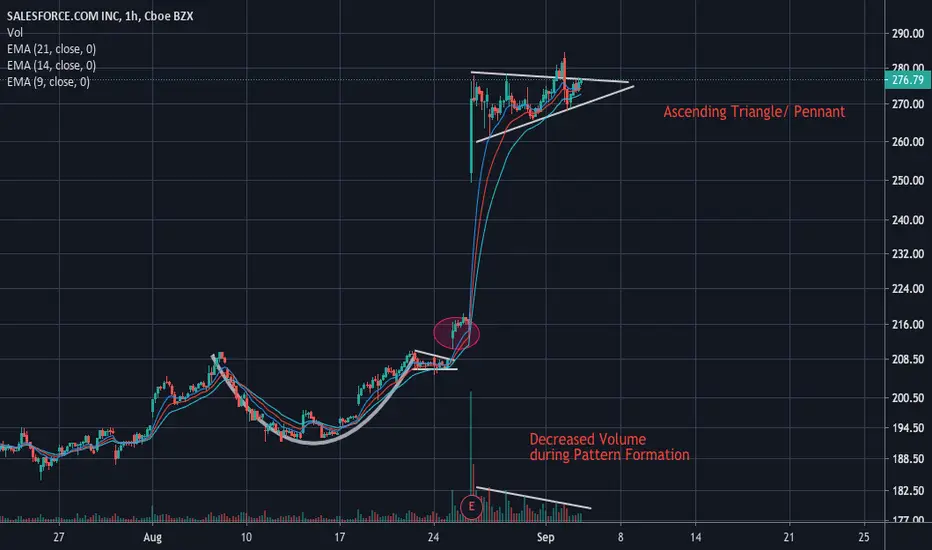
CRM Ascending Triangle Sentiment: Bullish
Reasons:
1. Ascending Triangle/ Pennant Formation
2. Holding 21 EMA as Support
3. Decreased Volume during Pattern Formation
Cup and handle formation for CRMKinda looks like a cup and handle has formed. Usually a bullish sign. We’ll see !
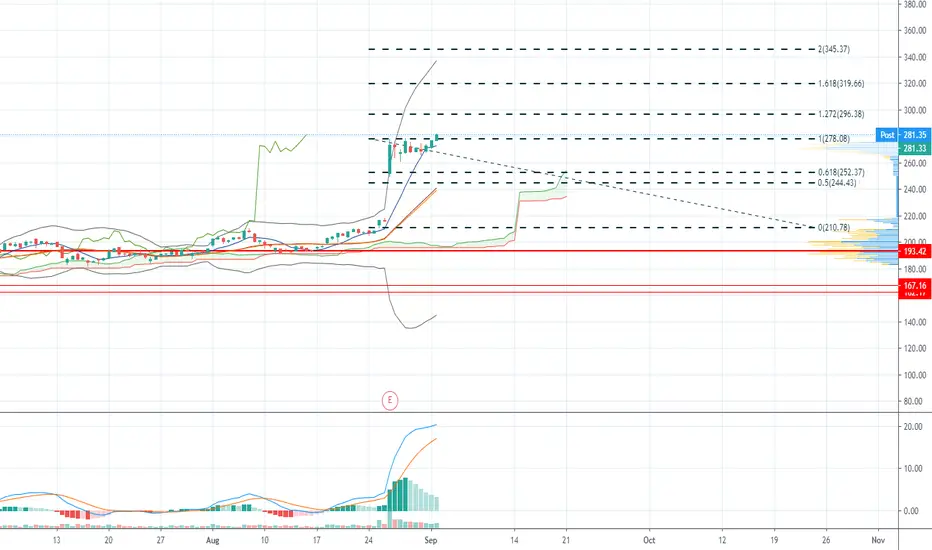
CRMClosed strong today after earning gap up. 278 should act as resistance here as see room to 285, 296
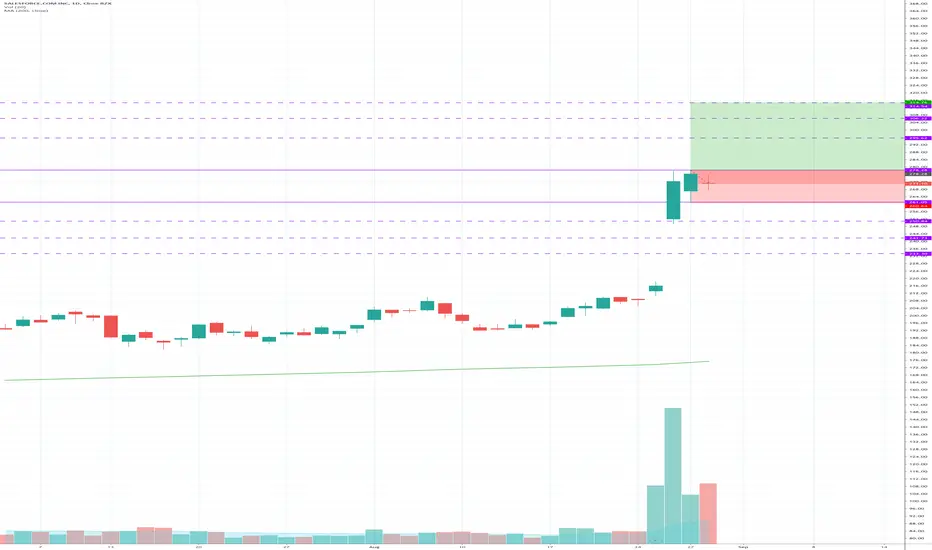
Learn options entry - beautiful RSI bounce and candle indicatorsI hope every options trader sees this chart. On the daily chart, August 31 closed as a bullish engulfing, though small body and after a completely indecisive doji. RSI over 50 supports calls if the high of Monday's candle is broken.
It seems overbought, so caution is warranted, meaning you want a good signal.
Here on 30 min chart, you see price has been consolidating since Aug. 26. As it neared the cloud there was also a RSI retest of the 50 line (red oval). The price took support on the moving averages and cloud, and this afternoon finally traded over Monday's high (white arrow).
When the high price broke, there was a quick pop up in price and soon the stock was moving higher. The 30min candle also closed higher than the previous high close (green arrow) so this is a great sign for more upside.

$CRM bullish set up post earnings$CRM has officially entered the DOW as of 8/31. After a strong earnings result, it is consolidating sideways and primed to break out to new ATHs

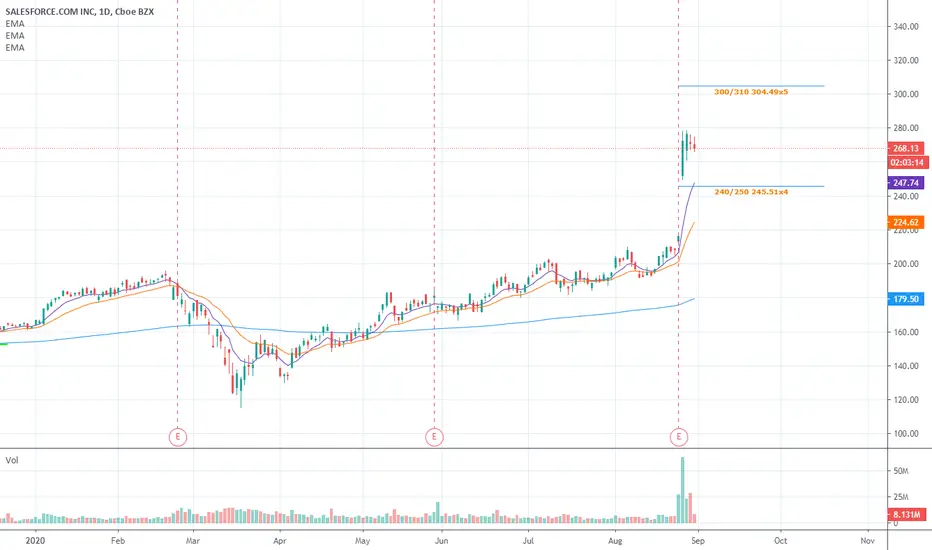
Salesforce - IC$CRM post earnings pop.
Volatility remains elevated
Iron Condor - Oct 16 exp - 240/250p 300/310 call collect $4.49x5
Delta - 11.97 Theta 19.513
no earnings in cycle
Manage 25% on 1 contract - 30% on another, 40% , 50% balance.
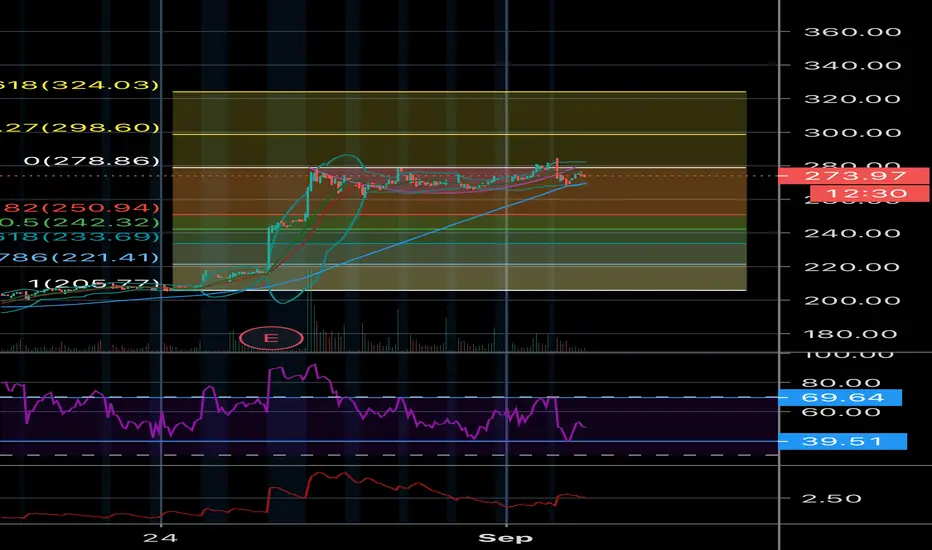
CRM PEG ContinuationPrefer to pick it up lower on the curve. Looking for a pullback into 261/250.60. If market continues to push then look for a momentum break over ATH into extension targets.

💻 CRM (8/31) - (9/11) ☁️ 💻 CRM ☁️
Current Price @270.49
Nice pump and pullback last week. Key support to watch is @268.20. Breaking and holding over @272.40 will start a nice reversal to retest @276 resistance. Above @276 we'll find @279 (ATH)
On the downside, CRM going under @268 will most likely pullback to 264.6 support. Failing to hold and we'll find @261.
Bearish if CRM somehow gets sold to the ground and we find under @260, expect a nice flush down to low @250's.

Buy CRMER play - CRM looks good to me to add now and until 197 for target of 210,215 ++ , Stoploss i will place near 192 on closing basis..
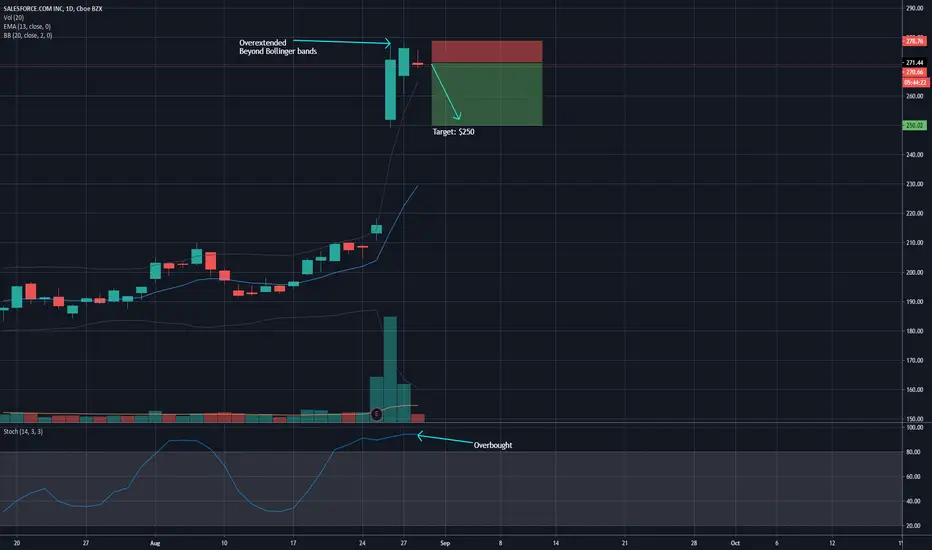
CRM SnapbackCRM has had a huge surge after earnings, it didn't quite follow thru the next day. It is overextended beyond normal levels and overbought on stochastics. I'm looking for a necessary pullback here to the $250 level, which is the level it gapped up to after earnings.
BUY 1 VERTICAL CRM 100 18 SEP 20 270/280 CALL @4.80 LMTStrength into close on Salesforce led to taking this bullish position. The original strategy was to sell a put spread but the credit ran away from me so I paid for exposure on the call side.


SALESFORCE : Swing, 100% Price ActionNYSE:CRM : Follow the uptrend . #UniversTrader
Feel free to like❤, comment📝, share👫 and follow me for other analyzes🌍
I predict with the best probability the future trends, my ideas are reserved for the experienced trader. #UniversTrader