$CRM SHORT TARGETING 138 IF BOUNCE 152 WILL BE GOOD ENTRYCRM fell hardly from resistances level at 165 now targeting 138 or at least the previous bottom at 142 . its possible to bounce to cover position up to 150-152 then fall again to break bottom 142 .. 138-130 considered as main support for long positions
CRM trade ideas
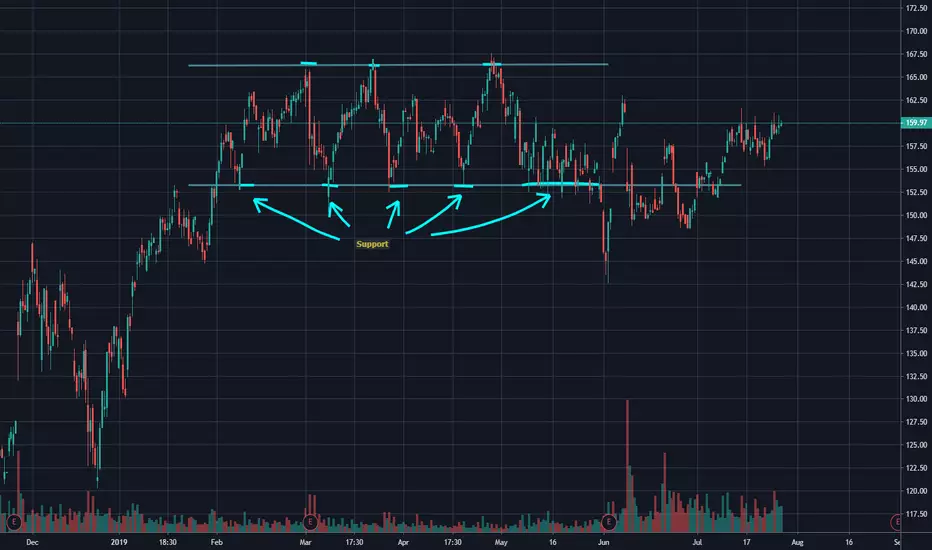
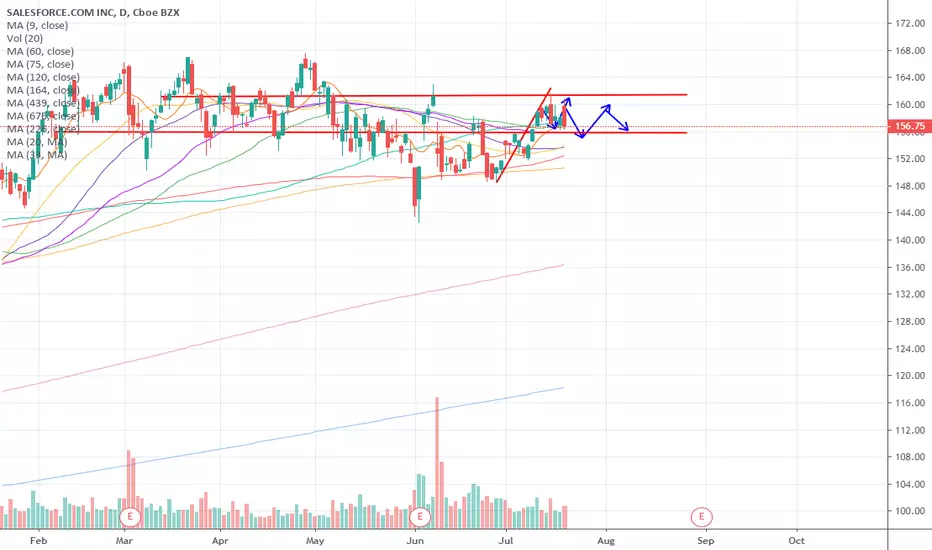
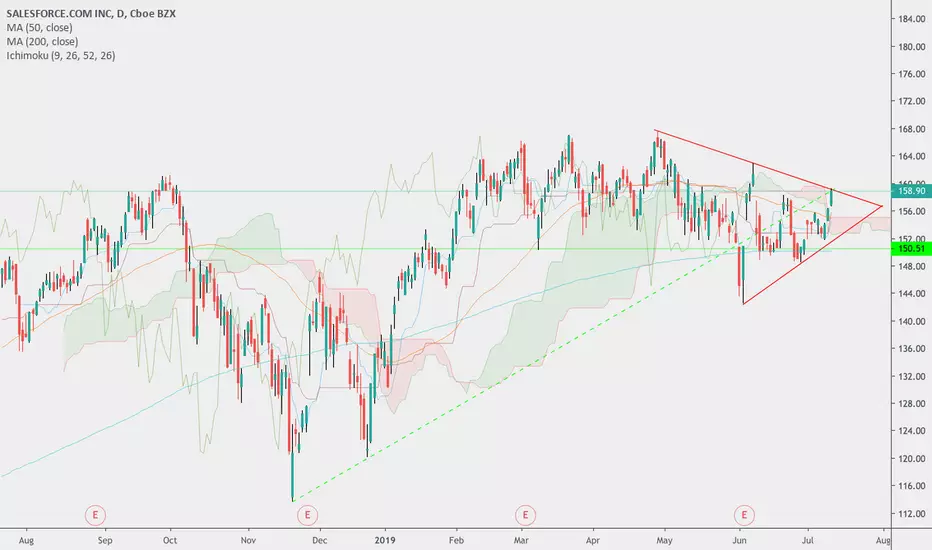
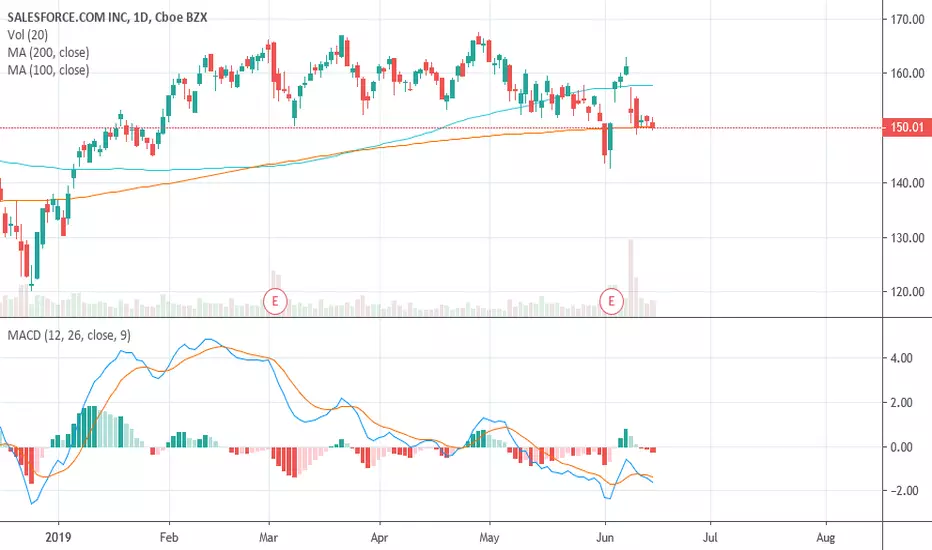
$CRM SHORT Targeting support above 152 MFI index showing overbought status and could turn down sharply as happened before many times .. in larger scale we are on the second shoulder and below resistance of 162
154 is good support if broken then 152-151 if break down recent bottom at 142 then 125 is the target . For uptrend 162 -168 is most strong resistance .. earning is in august
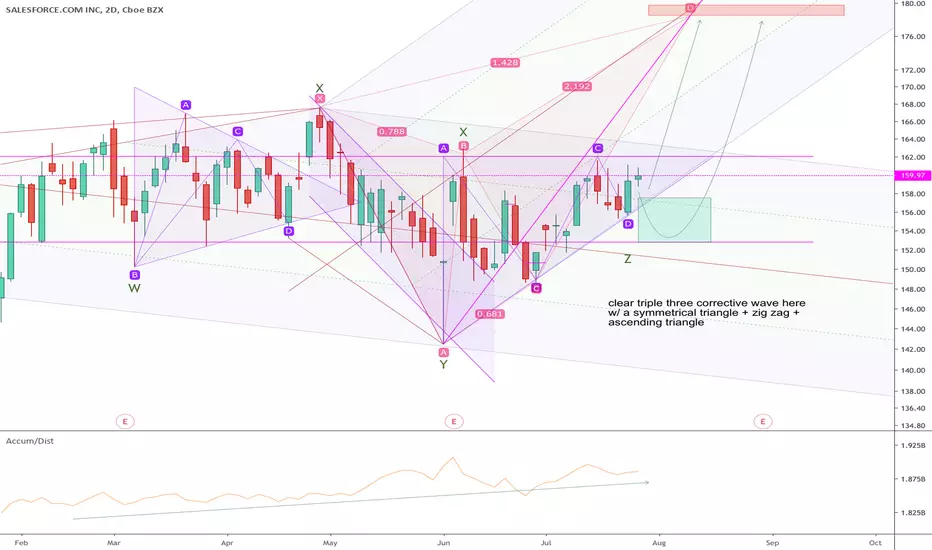
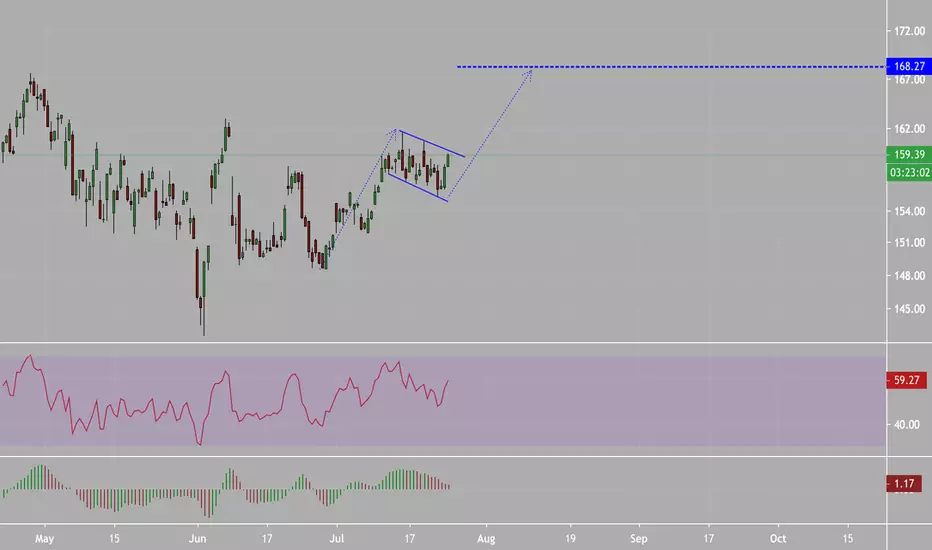
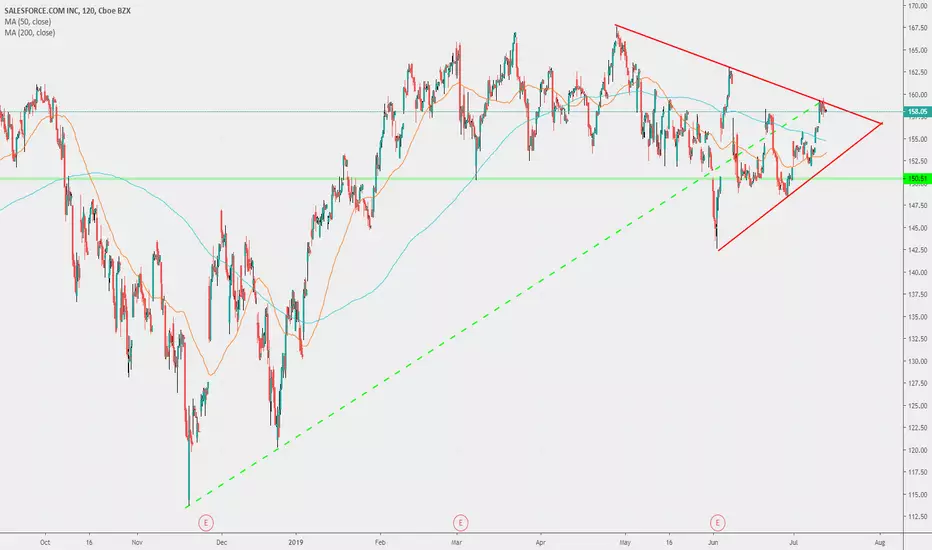
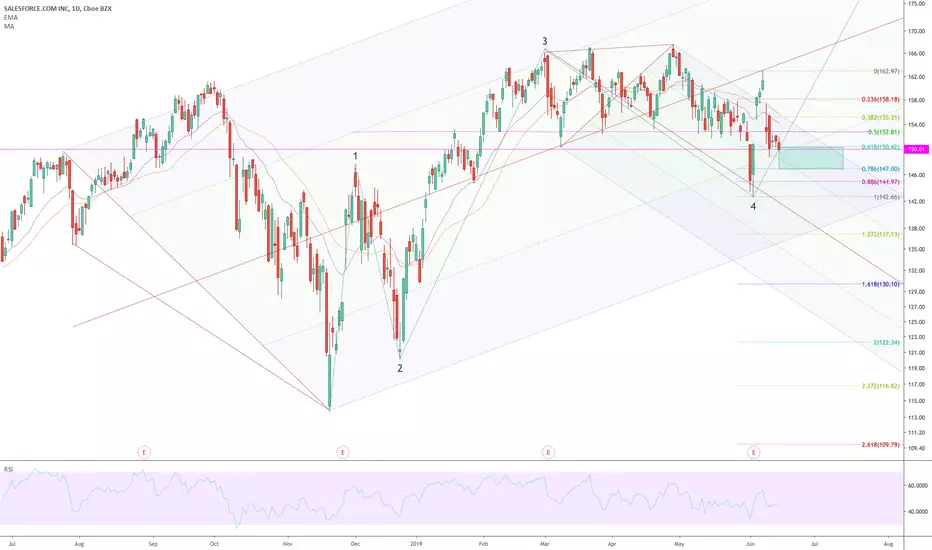
Longest wave 4 evar...Clear triple three here.... There's a chance wave C of the last triangle isn't done yet but this looks primed for a long overdue breakout assuming the Fed doesn't crap the bed this week.
PT is about 178 which is the length of wave 1 from Y and also the PRZ of the butterfly shown.
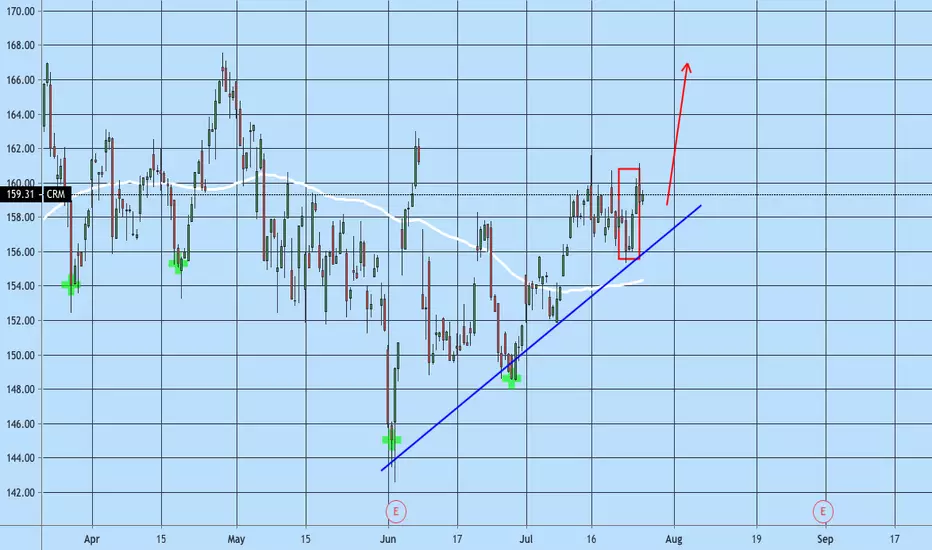
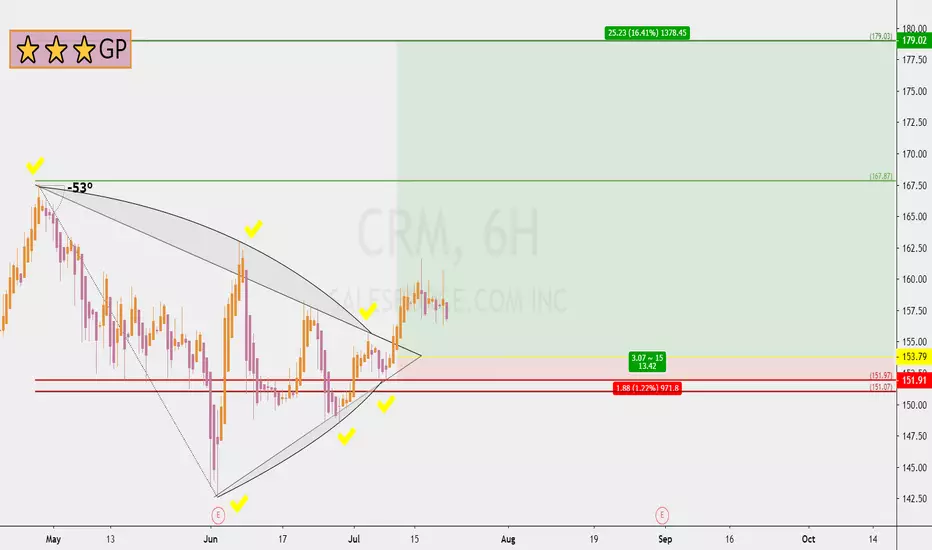
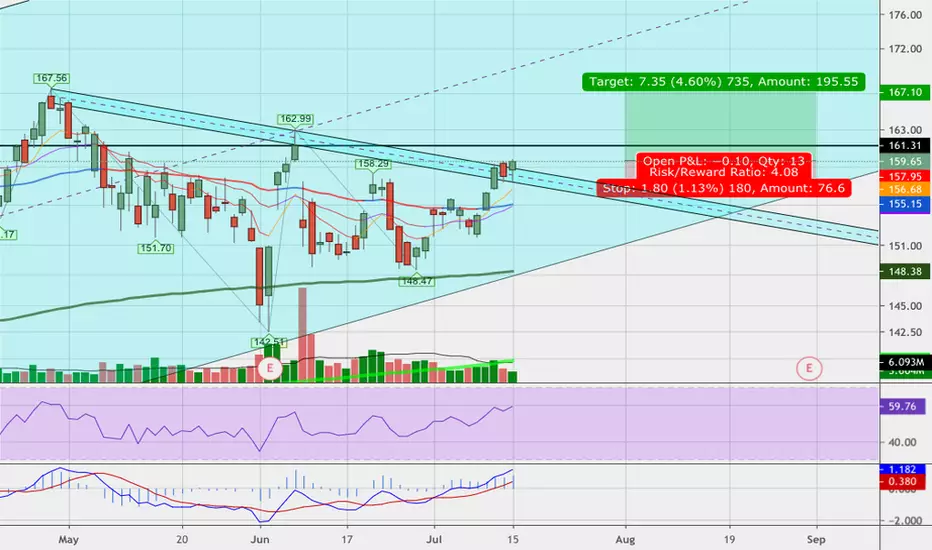
CRM 13 RRR longTrading Methodology:
1. An asymmetric bullish/bearish pennant is drawn using ascending and descending curved trend lines with a minimum of three price action touche points per line. The direction is determined by the previous trend.
2. The angle tool is applied from the earliest two trend touch points, beginning at the earliest touch point.
3. A trend-based Fibonacci retracement triangle is drawn starting from the earliest trend touch point and ending at the earliest touch point of the opposite trend line .
4. Based on the degree, of the earlier defined angle, the appropriate (and secret) levels are selected for the fibonacci retracement ; two levels for stop-loss and two levels for take-profit. The closest stop-loss level to the current price level is the top priority stop-loss. Though the secondary stop-loss level is often chosen for some markets such as FX and some equities in order to account for seldom unexpected resistance breaks. The greater target level is the top priority, and where majority of the shares are sold, though some may choose to close part of the position at the first target level or set it to be the stop-loss once price exceeds it. Entries should be laddered in around the levels closest of the yellow line.
This trading strategy can be applied to any market and time frame, and positions most often garner the greatest risk-to-reward ratio with the highest success rate. What more can you ask for? I will only be posting my unique trading strategy until EOY. I work solely with price action to identify pennants and apply unique trend-based fibonacci retracement levels for SL and TP levels. Reach out to me if you have any questions.
CRM stock trend would be in falling section tomorrow.19-JUL
www.pretiming.com
Investing position: In Rising section of high profit & low risk so far. But it would be in falling section tomorrow
S&D strength Trend: In the midst of an adjustment trend of downward direction box pattern price flow marked by limited rises and downward fluctuations.
Today's S&D strength Flow: Supply-Demand strength has changed from a weak selling flow to a strengthening selling flow again.
Forecast D+1 Candlestick Color : RED Candlestick
%D+1 Range forecast: 0.9% (HIGH) ~ -0.9% (LOW), -0.2% (CLOSE)
%AVG in case of rising: 1.6% (HIGH) ~ -0.7% (LOW), 1.2% (CLOSE)
%AVG in case of falling: 0.6% (HIGH) ~ -1.9% (LOW), -1.0% (CLOSE)
Daily CRM stock price trend forecasts analysis.12-JUL
Investing position: In Rising section of high profit & low risk
S&D strength Trend: About to begin an adjustment trend as a upward trend gradually gives way to a slowdown in rises and falling fluctuations
Today's S&D strength Flow: Supply-Demand strength has changed from a strong buying flow to a suddenly strengthening selling flow.
read more: www.pretiming.com
Forecast D+1 Candlestick Color : RED Candlestick
%D+1 Range forecast: -0.3% (HIGH) ~ -1.8% (LOW), -1.2% (CLOSE)
%AVG in case of rising: 1.6% (HIGH) ~ -0.7% (LOW), 1.2% (CLOSE)
%AVG in case of falling: 0.6% (HIGH) ~ -1.9% (LOW), -0.9% (CLOSE)
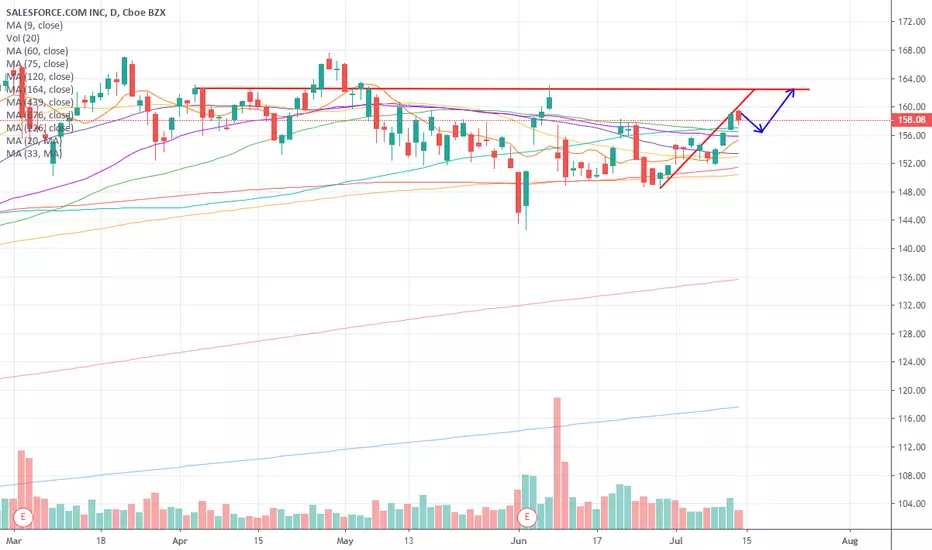
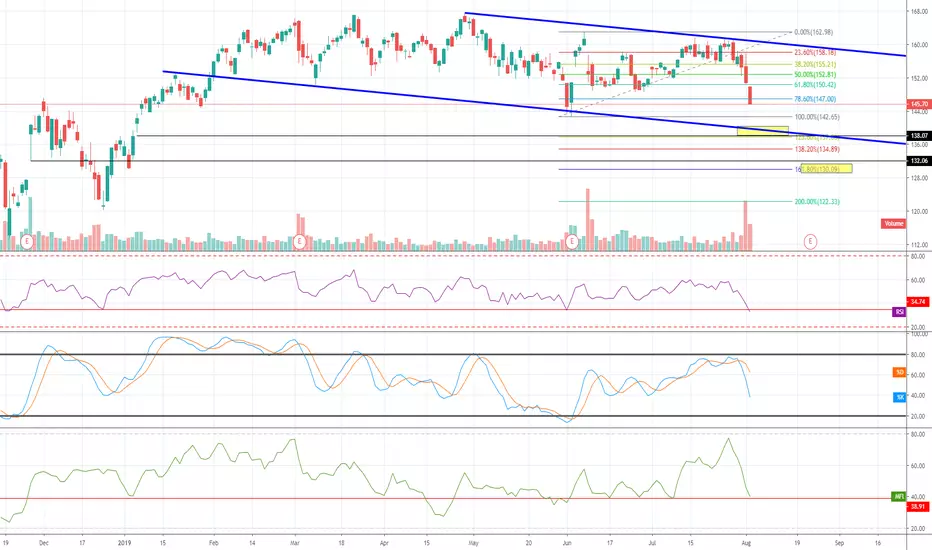
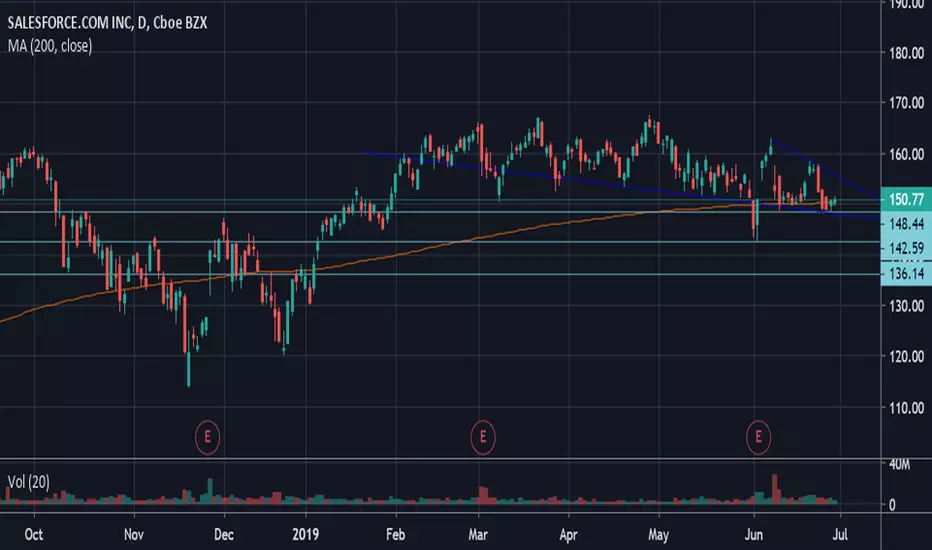
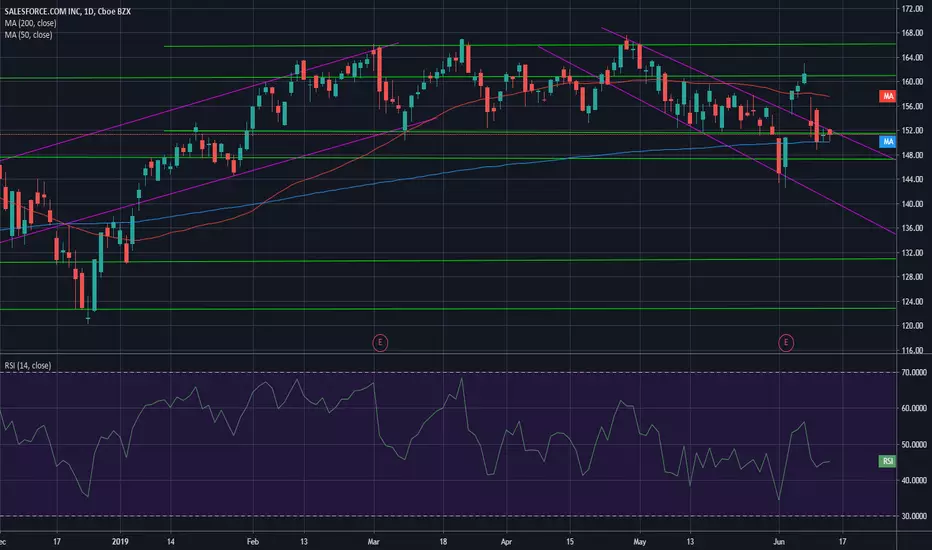
Weak...This things been underperforming the market waiting to break down for awhile now. It popped off earnings, failed to make new highs. Looked like it was ready to break down in mid June, but Adobe came in with hot earnings and popped the cloud stocks.
148 has been a respected pivot. The lower side of the wedge and 200 day are all sitting in the same vicinity, and no good bounce...Wait for a break of the trendline on some volume and get in. Should be good down to 142. Depending on the market, 136 could come shortly after.
Always gotta look at both sides though. We could break the upper trendline and bull on, but the 50 and 100 day ma are right there. Best to wait for those to hold along with a break of the wedge. Pretty clean shot to 162 from there.
*Not Trading Advice, Please do your own analysis!*
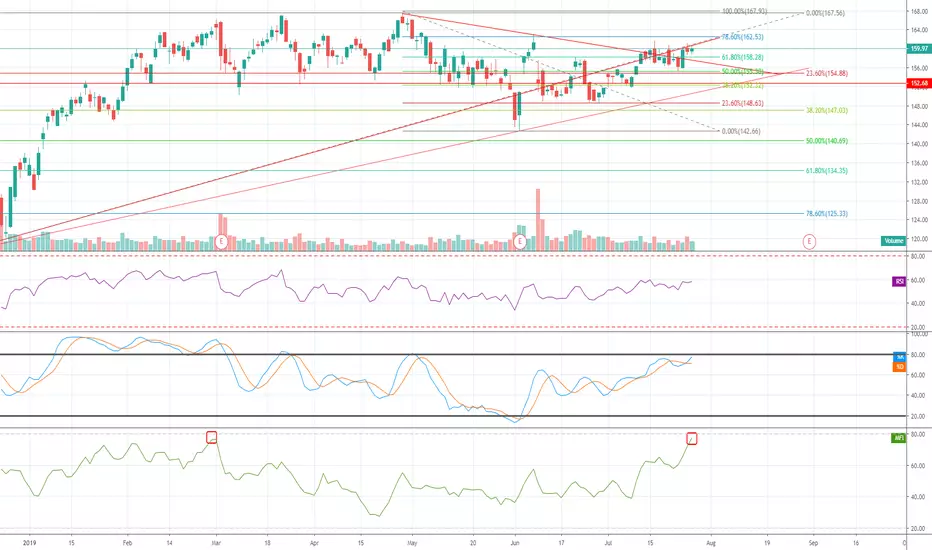
CRM Trailing downSlow but steady CRM price drop. July will prob. confirm it. Multiple short opportunities next month.
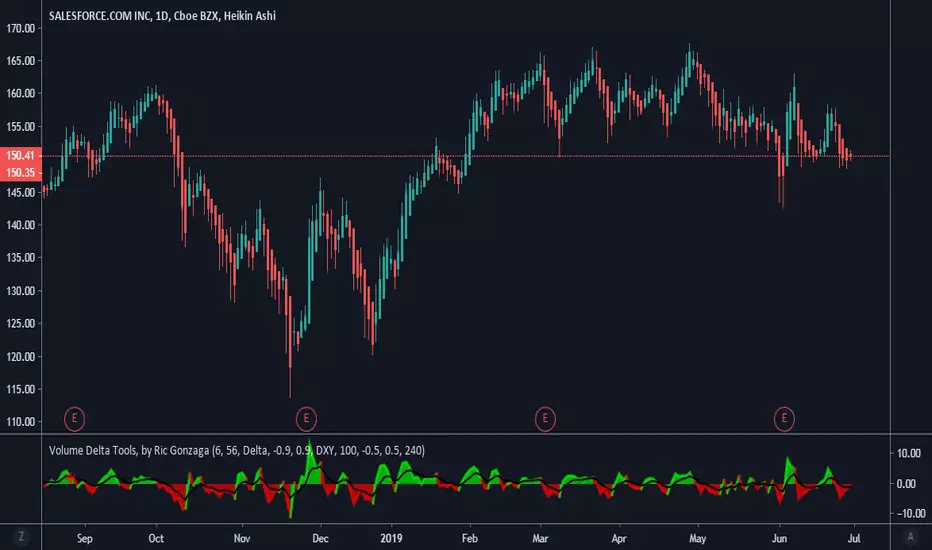
CRM ready to bounce back. Top notch company, been range bound for several months. At lowest end of range after DATA announcement despite great earnings. Lagging other tech leaders, is it finally ready to follow others up?
Swing Trade CRM on a fundamental basis!Salesforce has a long track record of strong growth and great management. After killing it on the earnings report they announced the acquisition of Tableau Software overcorrecting the stock to the downside. This is a buying opportunity! The trade thesis has 3 parts. First of all the stock has made several buyouts in the past and they have consistently been very successful because of it. Second of all is the fact that the stock rises in periods of trade conflict because they don't manufacture any hardware. Last time Trump raised tariffs the stock actually made good capital gains! Finally the technicals have shown consolidation and coiling ready to spring to the upside for a while now allowing the value to catch up with the price a bit.
Here is the deal. Buy Salesforce now with a stop loss in (downside 5%) and sell right before the next earnings report to be safe.
-$$$$$$
coiled for a move...bottompickers may wanna gamble on it at the .786 retrace, but the safer play is to wait for a breakout from the smaller schiff channel and a successful retest of 153.

CRM - 2 Bullish Trade IdeasCRM acquired Tableau today and price dropped -4%. Patiently waiting for price to drop to $148.5 to enter two long trade positions. A tight stop loss just below the recent low makes for risk rewards of 6:1 and 11:1. I like the business industry, the product, and the team. The acquisition today was all stock, and Tableau will add around 2.5% ($400M) to their total annual revenue.

CRM Bounces Off Moderate SupportSalesforce.com formed a Rounding Top that broke to the downside. However, it did not complete the Rounding Top Formation yet, as it bounced strongly off of previous monthly highs.

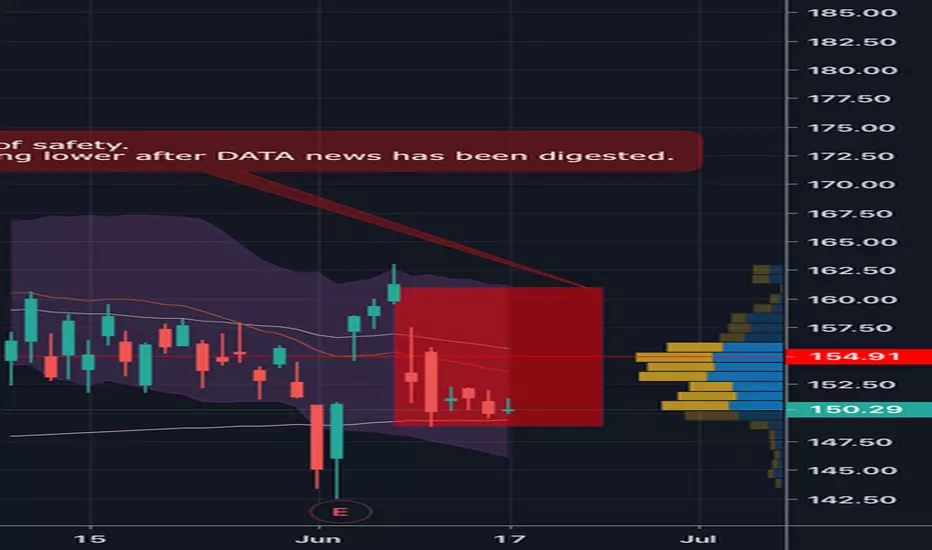
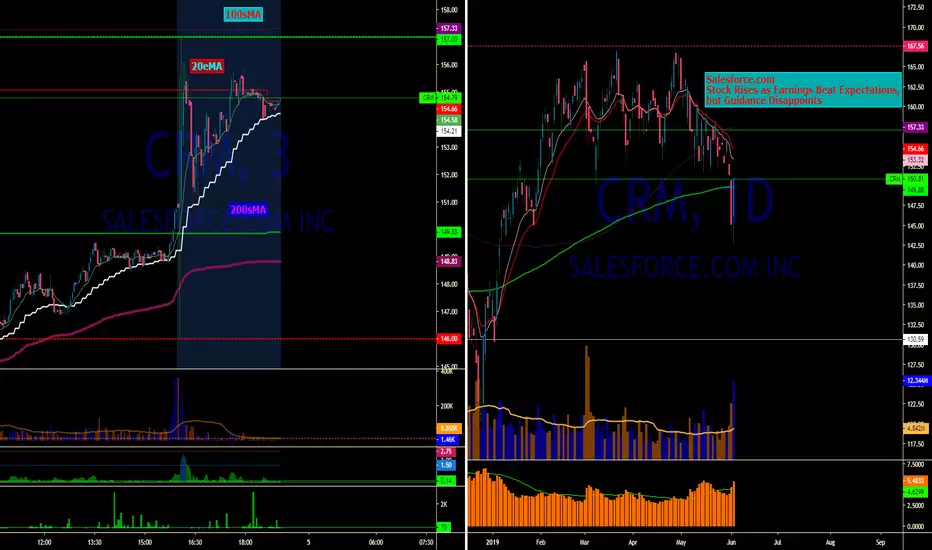
CRM with earnings on play for 06/05/2019 trading sessionHello everyone CRM releasing earnings beats expectations but disappointments regarding the guidance could lead to a fade. Price got to 157sh, 100sMA area and 154sh, 20eMA area in after-hours session.
There is a beautiful bullish wedge holding nicely on 13eMA 10min that is waiting to pop. Curious to see how today's after-hours session will close.
For tomorrow trading session if at the opening at least 50k volumes will be already traded and if the pattern will not change I will long:
1) above 157.33 if price will consolidate in pm above the 20eMA and will break the 100sMA at the open. Caution for the very first minutes, moment in which price still didn't really trace a clear trend.
2) In case of price consolidation above 100sMA level only after the first 15 minutes I will trade the breakout of new level of resistance.
3) In both type of scenario for me to enter the trade uprising volumes has to come in breaking the avg volume of the first 3 minutes. Thus RVOL (relative volume) has to be at least above 2.
Also if at the opening at least 50k volumes will be already traded and if the pattern will not change I will short:
1) the eventual pm main low level of support if price will fade below the 20eMA,
2) below 154.66 (20eMA) if price fill fade below 100sMA
3) below 157.33 (100sMA) if price will fail the breakout.
4) In any type of scenario for me to enter the trade uprising red volumes has to come in breaking the avg volume of the first 3 minutes. Thus RVOL (relative volume) has to be at least above 2.
Have a good trading session!
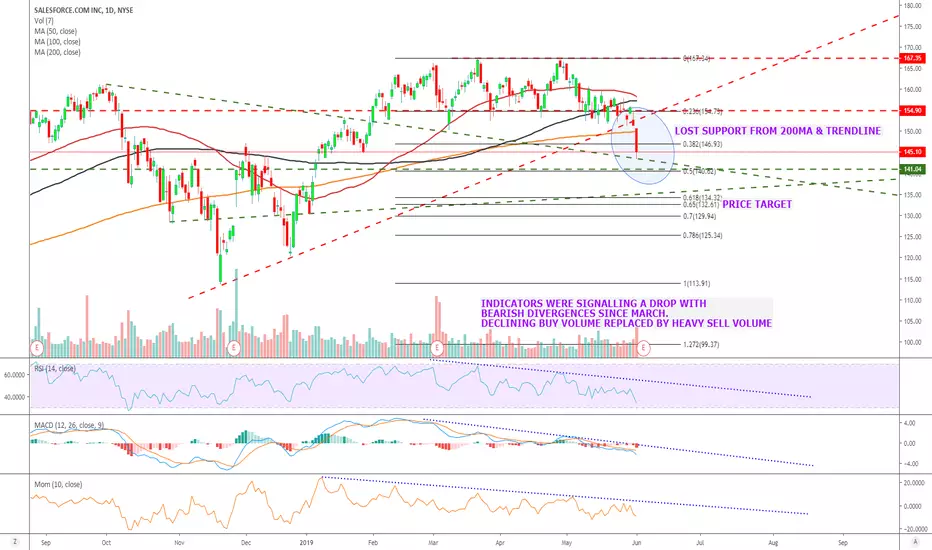
$CRM EARNINGS BETTER BE A BLOWOUT TO AVOID MORE DOWNSIDE. Once the piggy bank stock where you investment was safe has turned a little weaker in recent weeks. The tech massacre has affected the high valuation names in particular and NYSE:CRM certainly fits into that category with a high p/e ratio of 100. The chart is getting increasing weak with indicators all bearish, as is the volume, with high volume on down days which is extremely bearish. On the downside $134 seems like a possible target BUT 3 TREND LINES BELOW COULD GIVE SUPPORT.
AVERAGE ANALYSTS PRICE TARGET $182
AVERAGE ANALYSTS RECOMMENDATION BUY