Current Developments on CVS chart can make for opportunityHi guys! This is a Technical analysis on CVS Health Corporation (CVS) on the 3 day timeframe.
We discuss some Current developments on CVS, which maybe pointing to signs of potential opportunity to invest/ hold CVS.
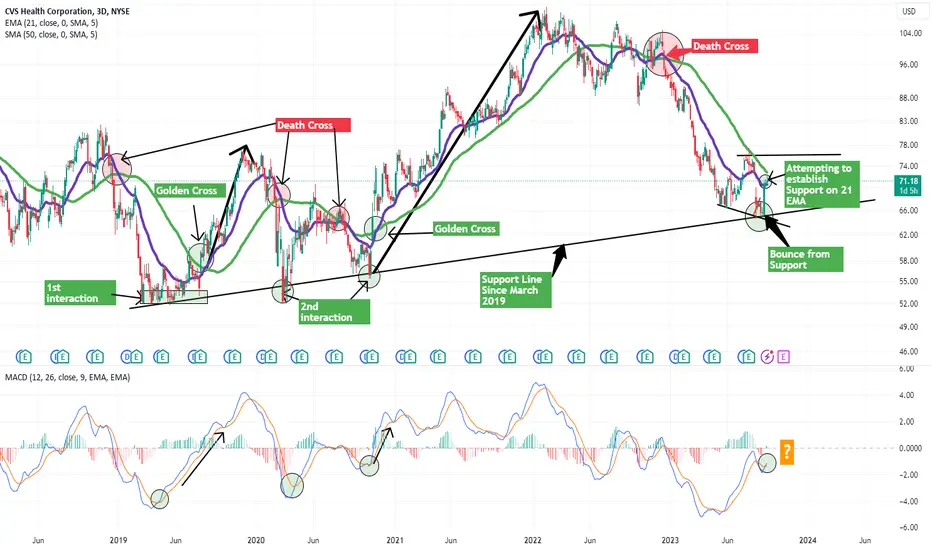
We've had a deathcross that has brought us down more than 38%.
Which has lead us to a critical support trendline that has acted as support since March 2019.
We recently bounced from this trendline with a BULLISH ENGULFING candle print
We have from this support line bounced up to reach the 21 EMA
Current price action is attempting to establish support on 21 EMA.
MACD has crossed Bullish with Green bars printing.
BUT also remember that we have resistance above us from the 50 SMA.
We are also in an established DOWNTREND from the Deathcross. Until proven otherwise so we have to pay attention for signs of trend change.
Key area is around the 2 moving averages. We need to establish support on 21 EMA. We have to also see how we react with the 50 SMA. If we get ABOVE 50 SMA and maintain support, it is likely we print a GOLDEN CROSS, leading to BUY pressure to come in.
This could be the necessary catalyst for trend change.
Another hint in an attempt to trend change is the 21 EMA flattening out, beginning to show signs of a curvature to upside.
Now lets Look left to find evidence of previous patterns in the Moving average interactions, Support line interaction and MACD.
Our first time interacting with the SUpport line, we had many touches, before printing a GOLDEN CROSS. ALong with MACD CROSS ABOVE 0 level, we had a 48% Uptrend.
Our 2nd interaction with SUpport line, we experienced a fakeout on the 1st touch. MACD could NOT move ABOVE 0 level.
The 2nd touch of support line, had the GOLDEN CROSS and the MACD cross ABOVE 0 level. This lead to an extended Bull run for CVS with gains of 100%.
Keep this in mind. Look for similar pattern in our current price action. If we see a Golden Cross with MACD crossing ABOVE 0 level. This would mean an UPTREND is probable. But dont discount the possibility of a fakeout. We can always have another attempt to test support on support line.
Watch closely for these to develop in our current price action. Best opportunity to invest would be after Golden cross has been established with confirmed MACD cross Above 0 level in my opinion.
__________________________________________________________________________________
Thank you for taking the time to read my analysis. Hope it helped keep you informed. Please do support my ideas by boosting, following me and commenting. Thanks again.
Stay tuned for more updates on CVS in the near future.
If you have any questions, do reach out. Thank you again.
DISCLAIMER: This is not financial advice, i am not a financial advisor. The thoughts expressed in the posts are my opinion and for educational purposes. Do not use my ideas for the basis of your trading strategy, make sure to work out your own strategy and when trading always spend majority of your time on risk management strategy.
CVS trade ideas
CVS showing bullish reversal signalCVS Health Corporation consistently going up with convergence on rsi scale and with good volumes .
the price can break 1st resistance after a small drop and can reach 0.6 fib levels where a sell must be initiated

$CVS Setting Up as Undercut & Reverse (U&R)?NYSE:CVS released news today that Blue Cross of CA will no longer use them for prescription management. As a result, we have a big sell-off which may be overdone. TBD. I am looking at this as a potential U&R. I have it measured against the most recent lowest low of $66.34. I have an alert set crossing over $66.40. If that triggers and on a 5-minute chart and it looks bullish I’ll enter with a stop just below $66.34. This is a higher risk trade; however, risk can be minimized by using a stop just under that lowest low. Let’s see what happens. It may just continue to fall. I do not know.
Ideas, not investing / trading advice. Comments welcome. Thanks for looking.
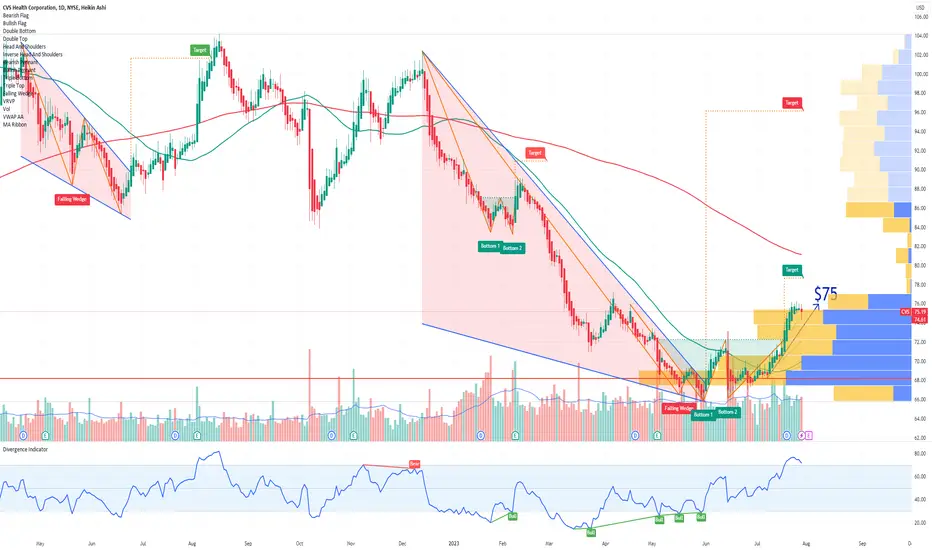
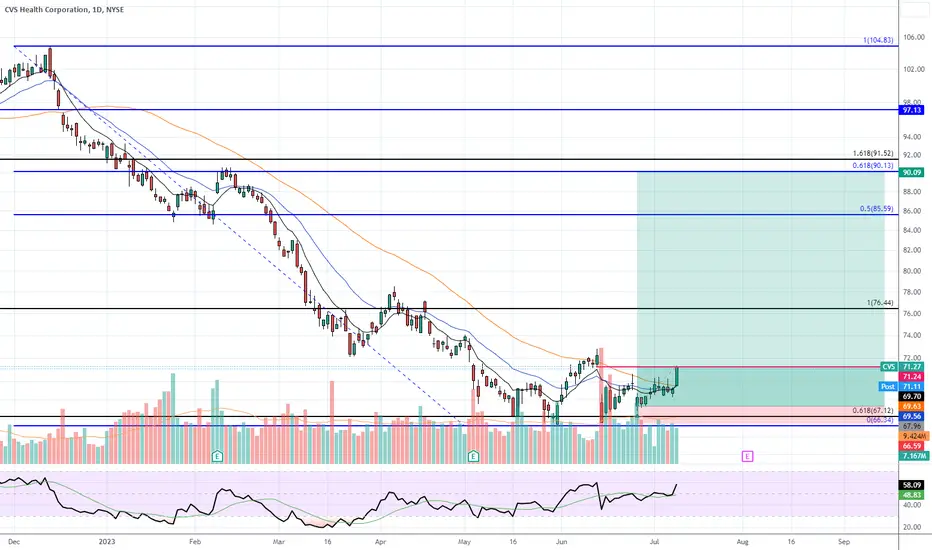
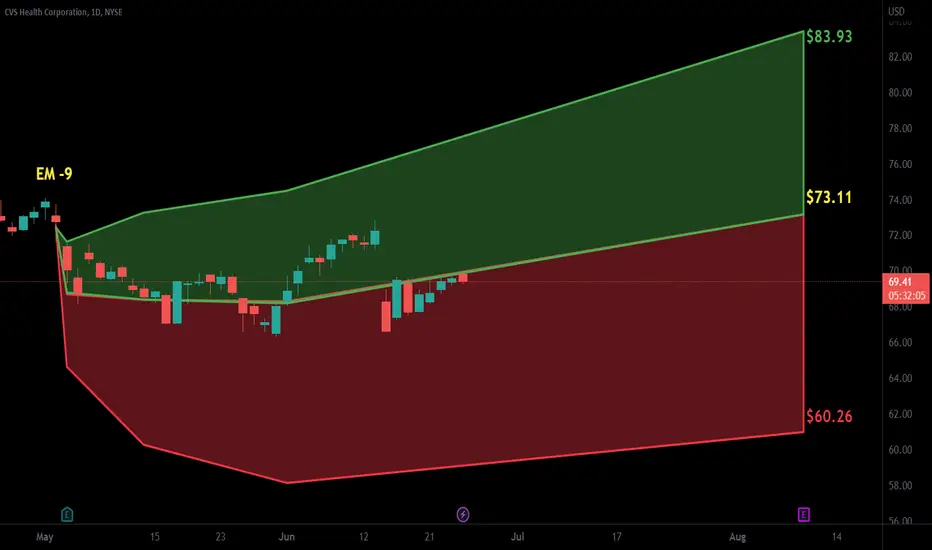
Look at this beautyCVS is at buying level.
Your chance to get in.
Don’t stay in below $72.
Get out when you want to collect some $$$.
Price target $85.
Will see how market perform.
I would trim some $ at $80 and check on SPY performance at that level.
If uptrend stays strong, run it up to $90 - $100
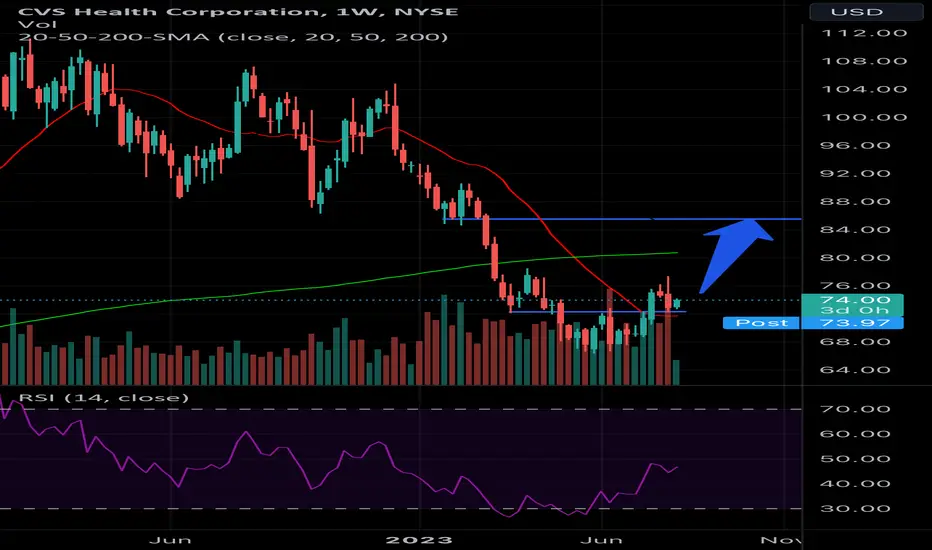
CVS testing breakout resistanceCVS Health Corp (CVS) presently testing breakout resistance, able to contain weekly buying pressures. From here (CVS) can fall back to recent lows, eliciting losses of 15% over the following 1-2 months. A settlement below a near-term channel bottom would accelerate this potential selloff. Inversely, if a settlement above breakout resistance occurs, this would place (CVS) in a a buy signal where gains of 15% would be expected within 2-3 months, and 20% over the following 3-5 months.

CVS Health Corporation Options Ahead of EarningsAnalyzing the options chain and the chart patterns of CVS Health Corporation prior to the earnings report this week,
I would consider purchasing the 75usd strike price Calls with
an expiration date of 2023-9-15,
for a premium of approximately $2.55.
If these options prove to be profitable prior to the earnings release, I would sell at least half of them.
Looking forward to read your opinion about it.
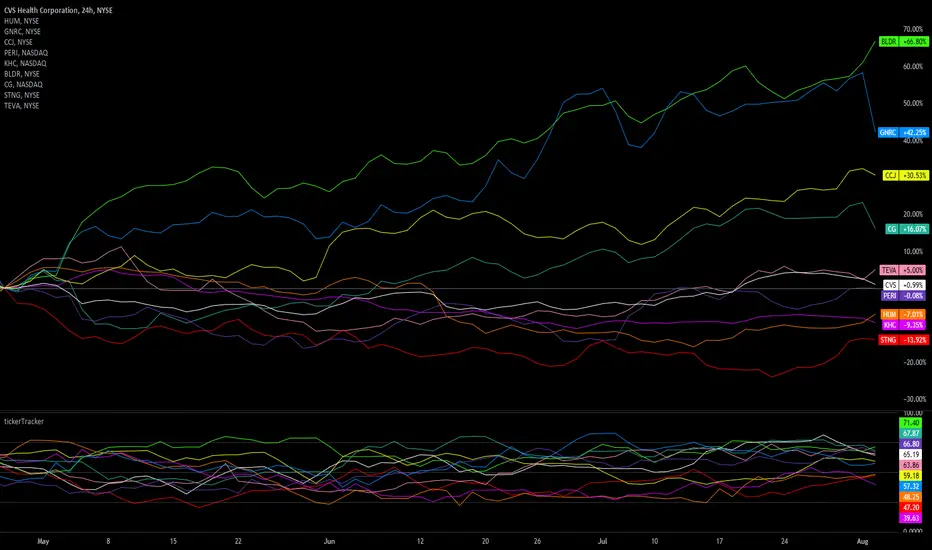
Earnings watch 8/2/23 pre-marketEarnings watch 8/2/23 pre-market:
Here's a quarterly view 24hr ext comparison chart with the tickerTracker MFI Oscillator.
CVS
HUM
GNRC
CCJ
PERI
KHC
BLDR
CG
STNG
TEVA
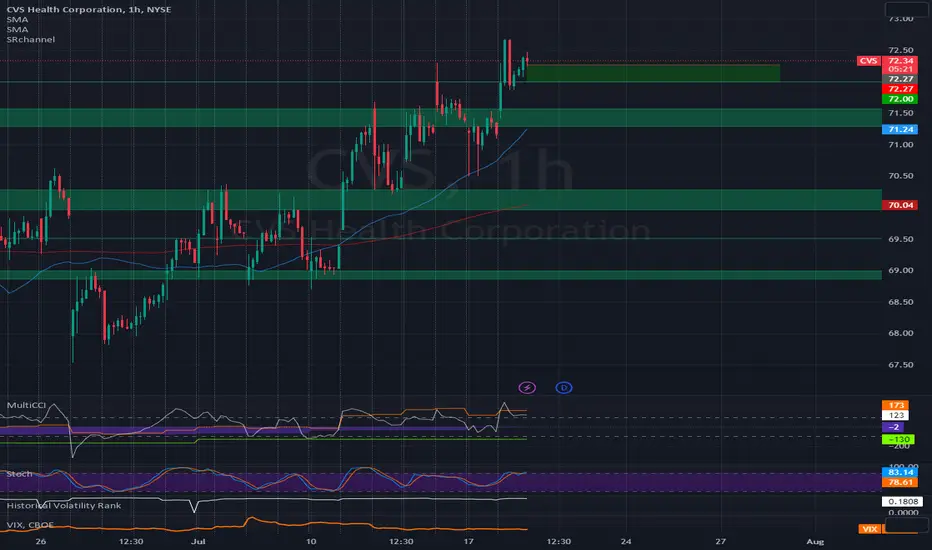
CVS PutBuy NYSE:CVS Jul-28-23 72 Put @ 1.14 Limit to Open
At resistance on daily and hourly zones. Overbought on the CCI.
CVS seems to have found solid supportTempted to sell a 69 put for Aug timeframe and hoping this goes up from here
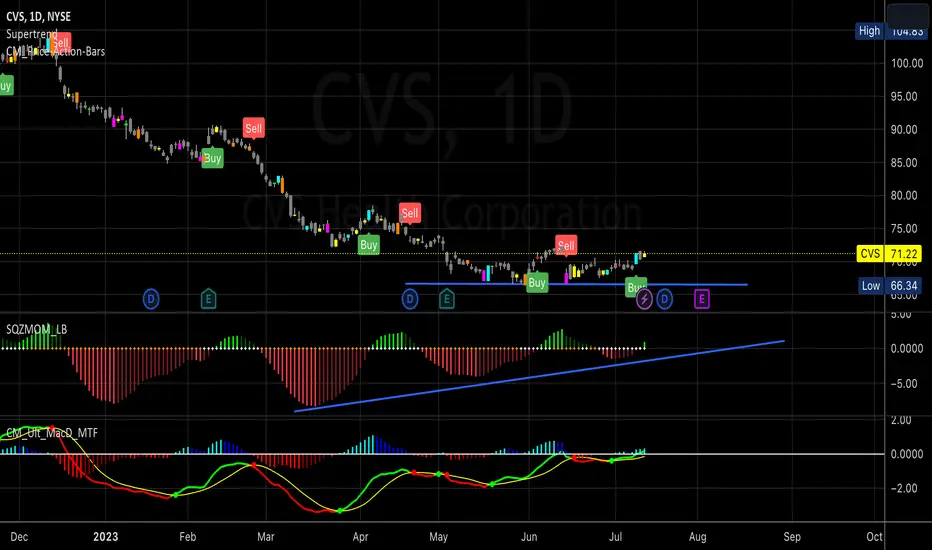
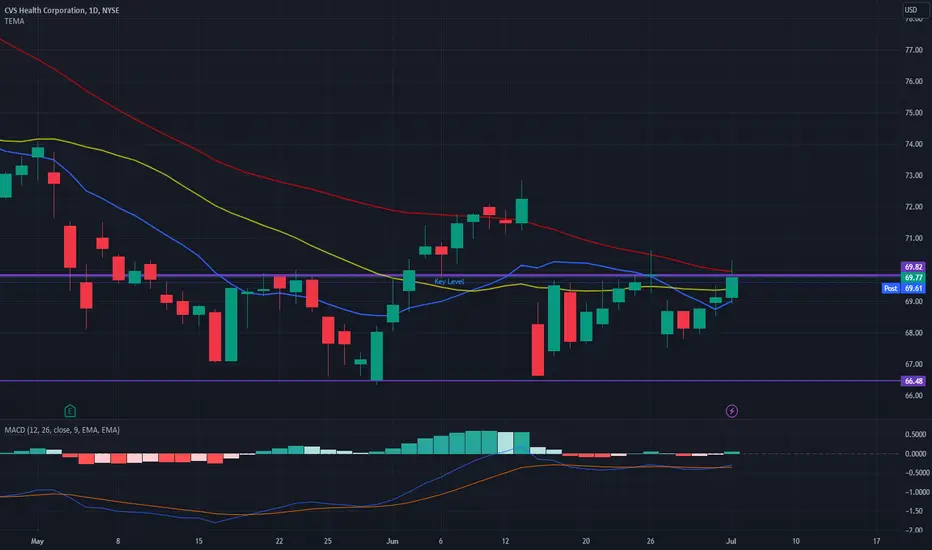
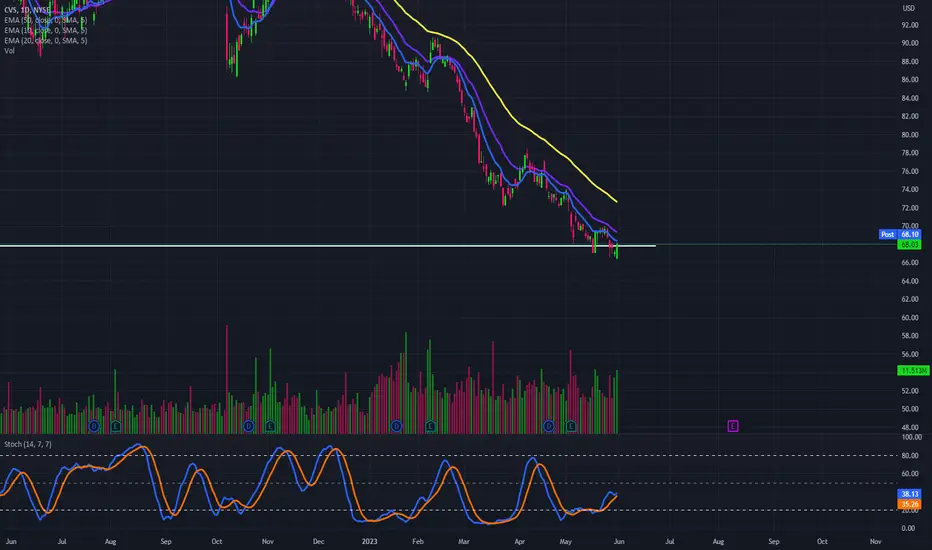
CVSAside from the scam close in June, today was the first close above the 50 sma since December of last year. Filled the gap from that day today as well so I lightened my position into the close & bought some lotto puts in case the resistance wants to hold. Looking to add on any pullback if we get one. $90 by September opex would be sweet.
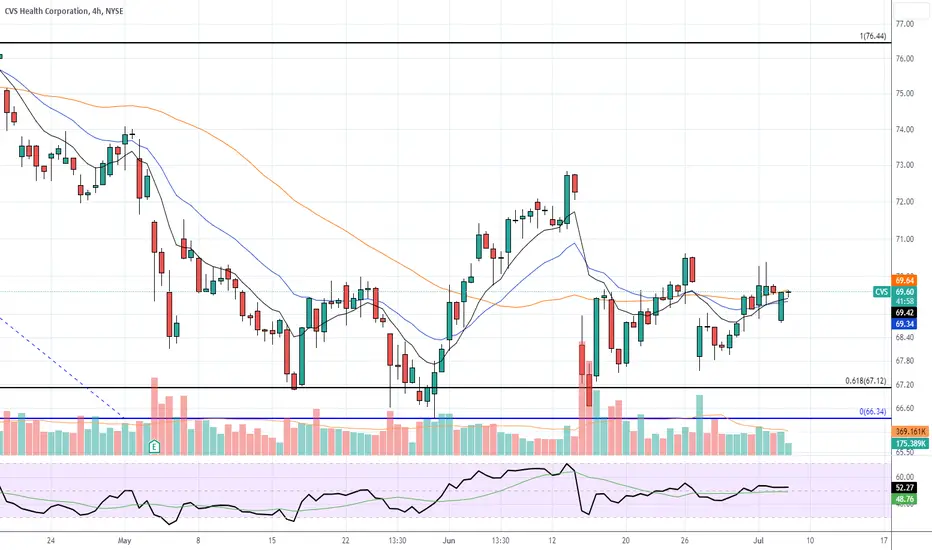
CVSGetting down to the lower timeframes, CVS is looking ready to go soon. Price has been trading in this range for a couple months now. 9 ema crossed the 20 ema yesterday. I added on the dip today. Still looking for a multiple month run up on this name as long as $66 holds.
CVS Long Term Reversal Forming?CVS has been beatdown over the last few months but seems to have found a strong support around the 66-67 area and has been trying to stay above the 70 range. It recently gapped back down under 70 because of NASDAQ:WBA (Walgreens) poor guidance. If it can beat this key level and bounce of this support and its moving averages then we can expect CVS to reverse the trend.
Confirmation is still needed so we will watch what happens over the next month.
CVS16:1 R:R here. Doesn't get much better than that imo. Just need to be patient & wait for the monthly to close doji then it's off to the races imo.
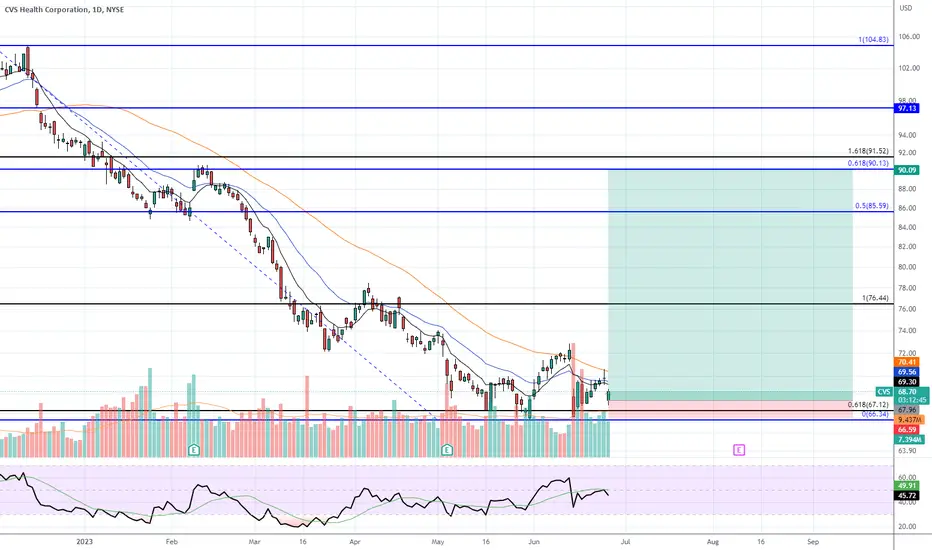
CVSLike the setup here. Added a starter position on some calls today with multiple expirations. Looking for this month to finish right around where it is now to form a doji candle. If this happens, I'll add to my position looking for a move back towards the 0.618 fib of the decline (~$90) in the coming months. Will ditch the position if we get a daily close below this month's low.
$CVS with a neutral outlook following its earnings #StocksThe PEAD projected a neutral outlook for NYSE:CVS after a negative under reaction following its earnings release placing the stock in drift D with an expected accuracy of 50%.
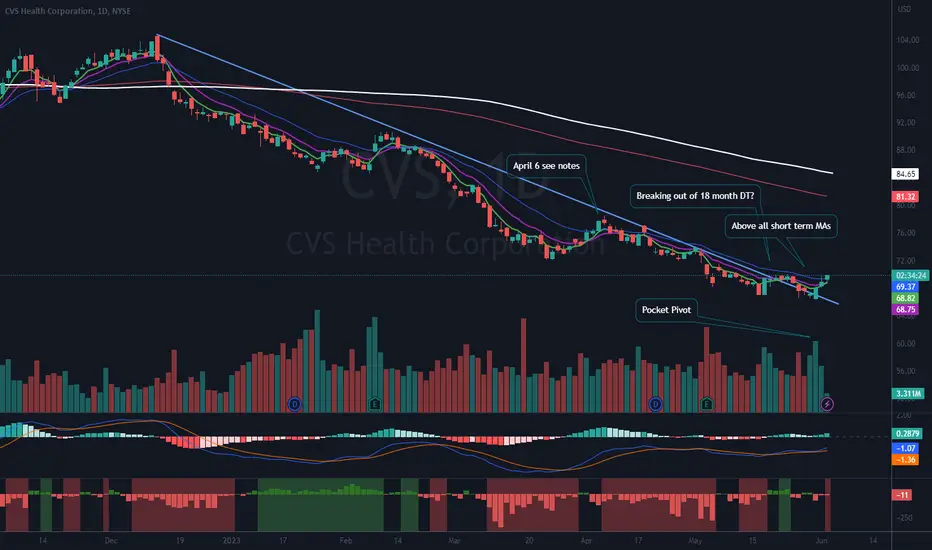
$CVS Finally Breaking Out?Back on April 6, 2023, I posted a NYSE:CVS chart as it was looking like a breakout then and I started a small position. It quickly failed the that day, and I was out. Fast forward to yesterday June 1 and I determined it was breaking out of the long term down trend again, so I added a starter position. It’s following through today, so I’ve added more and brought it up to a half-sized position. See my notes on the chart. This may be an actionable name “if” it fits with your trading style. My stop is tight. I will close out if it closes below yesterday’s low ($68.05). This is about a good as risk reward as I have found for awhile now.
(As a side note, the downtrend is a stage 4 it is unlikely that it will flip to a stage 2 right away. I’m simply looking for a trade and will close out if it starts to stumble, hopefully with a nice 10% to 15% gain or more.)
Ideas, not investing / trading advice.
April 6 chart link below
Thanks for looking. Constructive comments welcome.
$CVS now a buy opportunity?Seems like it has found bottom & picking up some buying interest/volume around ~$67
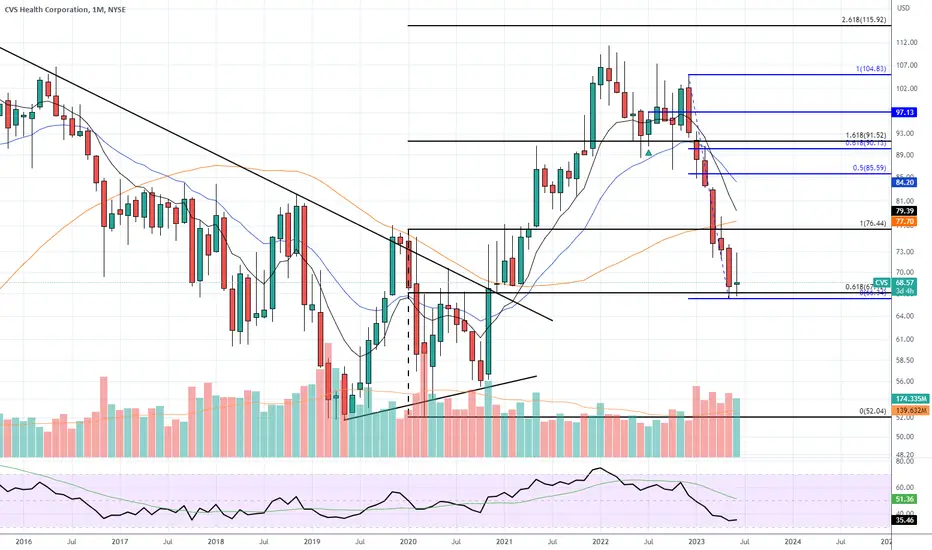
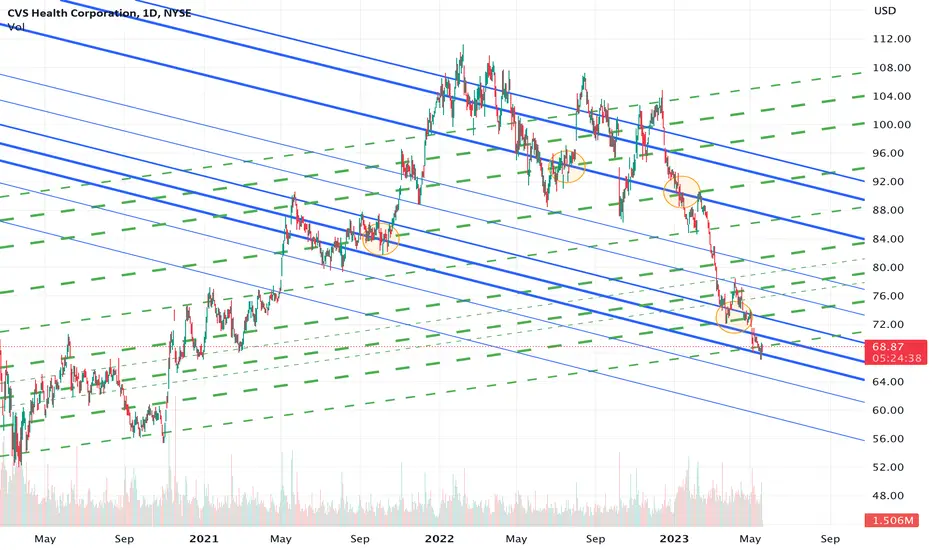
Roadmap for CVSBlue solid lines are established downtrends, green dotted lines are established uptrends. Both the uptrend and downtrend lines are established from equilibrium points, (not highs and lows). Thickness of lines illustrates strength of previous price action. Circles are the crossing of uptrend and downtrend (Crossfire Points), usually resulting in reactions.
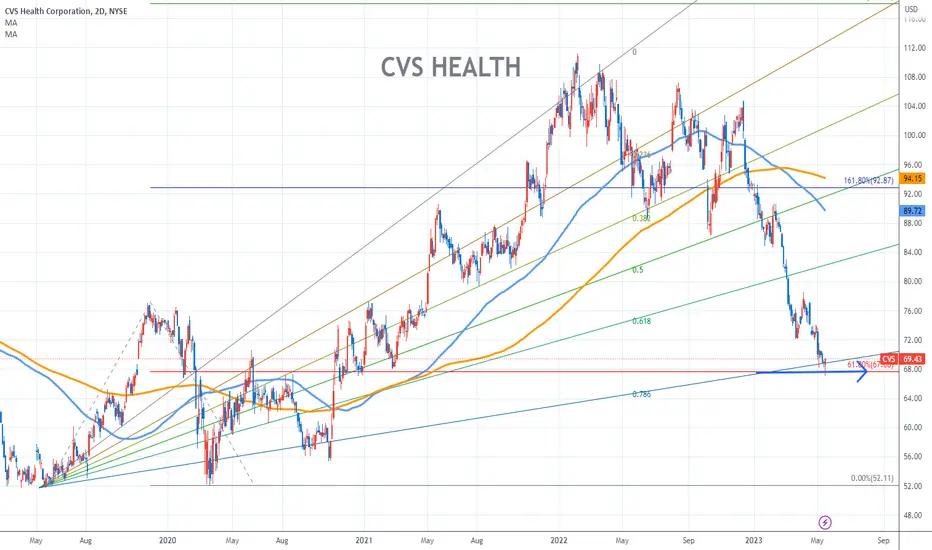
CVS HEALTH Stock Chart Fibonacci Analysis 051723Trading Idea
1) Find a FIBO slingshot
2) Check FIBO 61.80% level
3) Entry Point > 68/61.80%
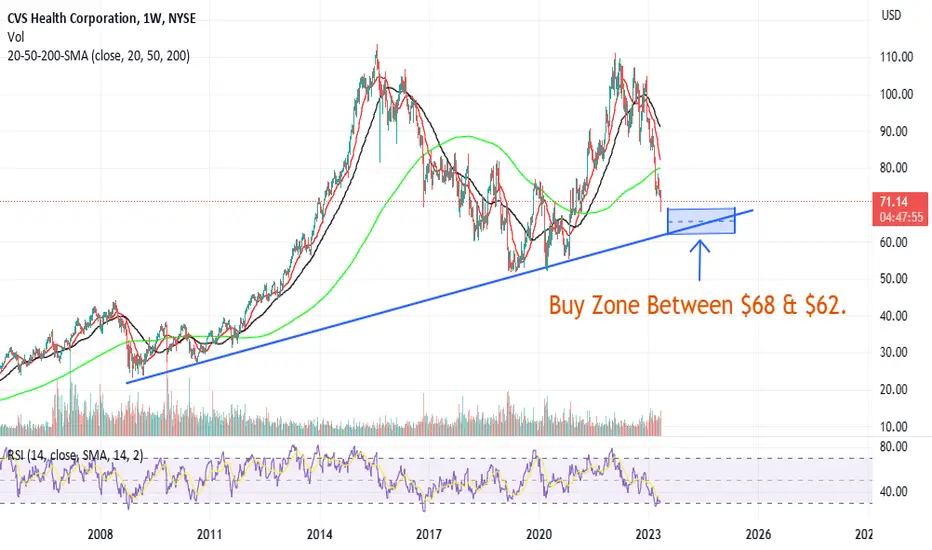
CVS looking interesting CVS Might be a good trade for a longer-term outlook.
Thinking about starting a position between $62 & $68.
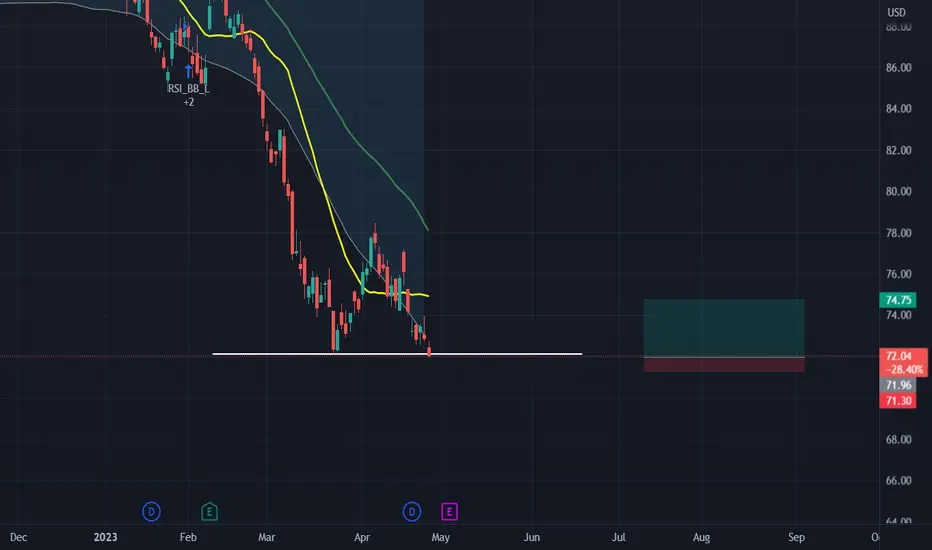
CVS - Long @ 71.96Long @ 71.96 for a speculative bounce to the 20DMA (yellow line)
1/2 position.
It is speculative because of how oversold this name is and it looks like a double bottom. Could also be a complete breakdown in price, thus the tight stop.
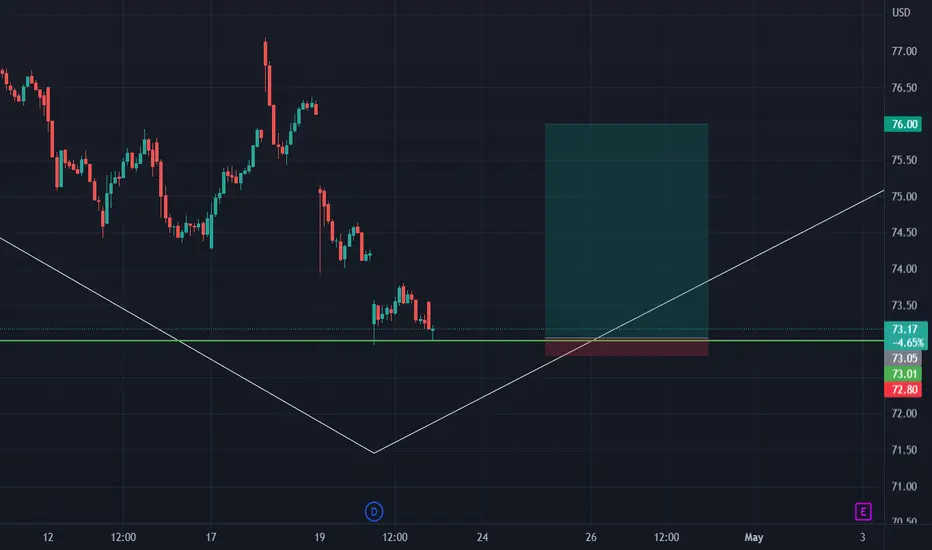
CVS Call Options to Upside Gap Fill (76)Long Call Options
Reversal candle on the 30 minute.
Entry: 73.05
Target: 76USD gap fill
Stop Loss: 72.80 (tight stop)
Risk/Reward: 1 / 11.8 on a share basis (much higher positive return R/R with options leverage)
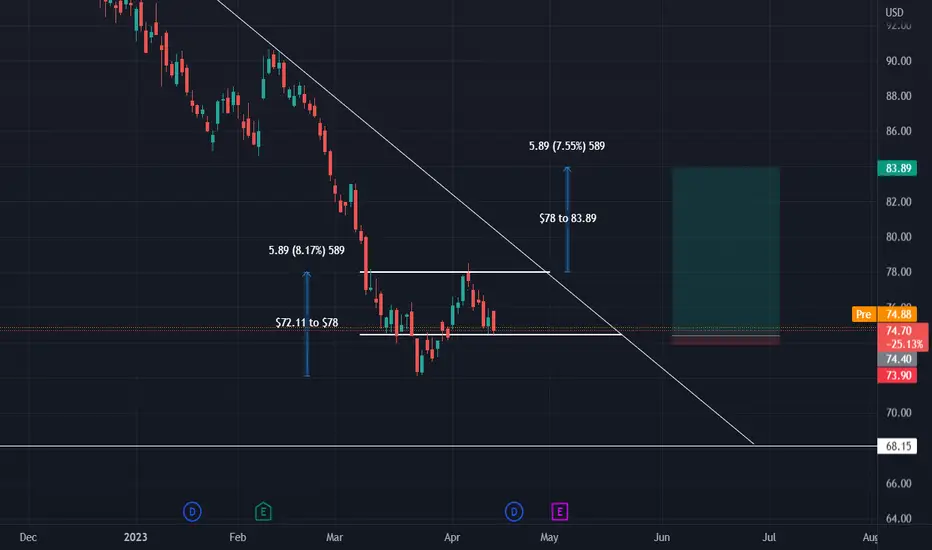
Long CVS Part 2 - 18.98 R/R!Multi-Week swing trade. CVS is forming a potential Cup & Handle on the daily time frame.
Because of the upcoming ex-dividend date, it will be dividend adjusted.
Entry: 74.40 (White line support)
Stop: 73.90
PT: 83.89
Risk to Reward (R/R): 1:18.98
Trade Duration: several week hold
-Daily timeframe Cup & Handle Set-Up for a multi-week swing trade in to earnings.
-Note: Ex-dividend is this Thursday, April 20th and earnings are on Wednesday, May 3rd