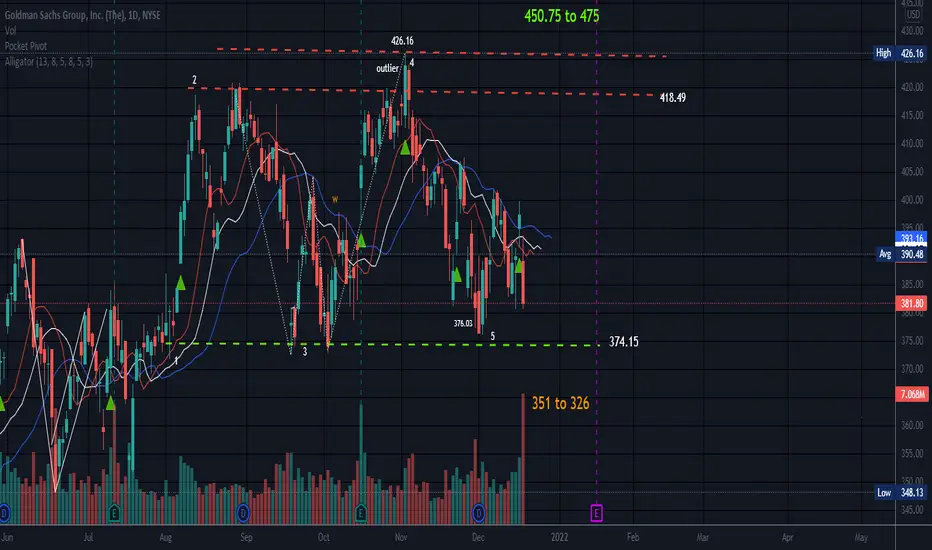
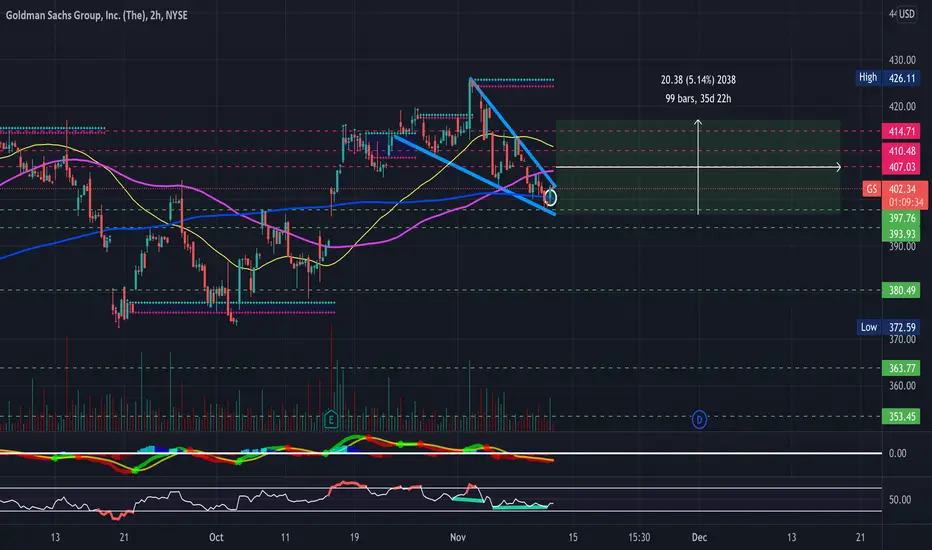
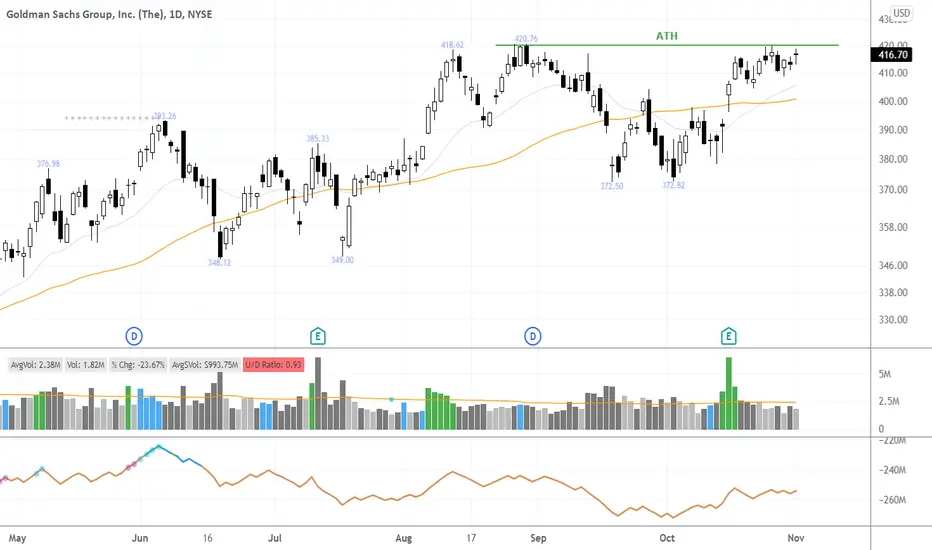
RectangleRectangle top and the pattern is neutral until a trendline is broken with a trend in that direction. This is a horizontal trading channel and the top line is resistance. There are 2 upper trendlines, but in my min the high of 42.16 was an outlier, and not part of the actual rectangle as price did not stay there long. You may want to extend the rectangle to that level, but in any case price would need to break the former high of 426.16 to consider a long entry.
The bottom trendline is support and would constitute a short entry for someone who wanted to short this.
Targets for a break to the upside of the rectangle in green and for a break to the downside are in orange.
No recommendation.
Sometimes it is only ourselves that stand in the way of reaching our goals.
I know we can be guilty of searching for what we want to see instead of seeing what is actually there. To me, this particular security, would seem a bit tired for now as it has had a great run, which may continue as a rectangle is neutral and this could hit the bottom trendline and go back to the races again for all I know (o: This one has surprised me before so there is just no telling! Fact is we can only make an educated guess, then wait for that guess to be confirmed. And then it is still just a guess (o:
GS trade ideas
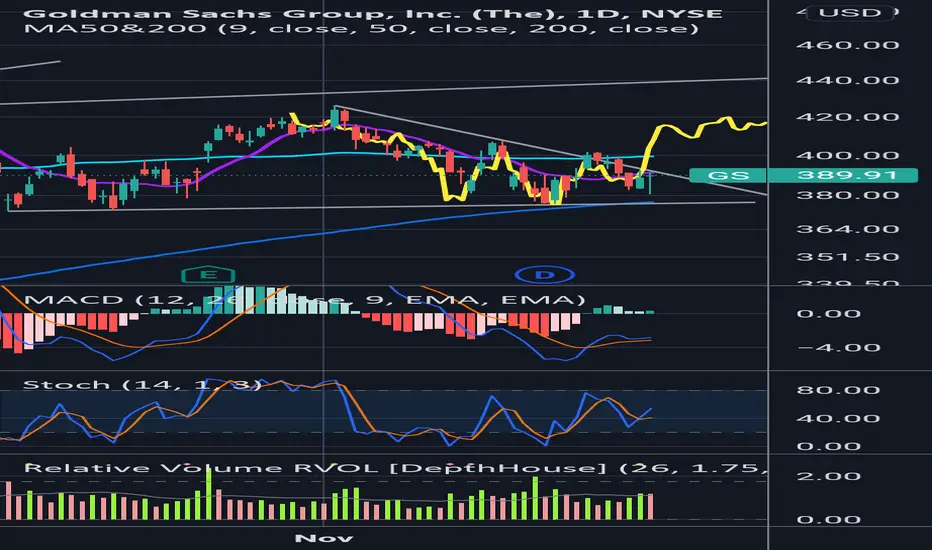
W shaped recoveryI overlaid the price movement from Sept to October and it's exactly the same. Needs to break the 200sma to be sure.
Meanwhile $GS not doing well today...Big down candle so far on the big bank... $XLF with some relative weakness this morning...

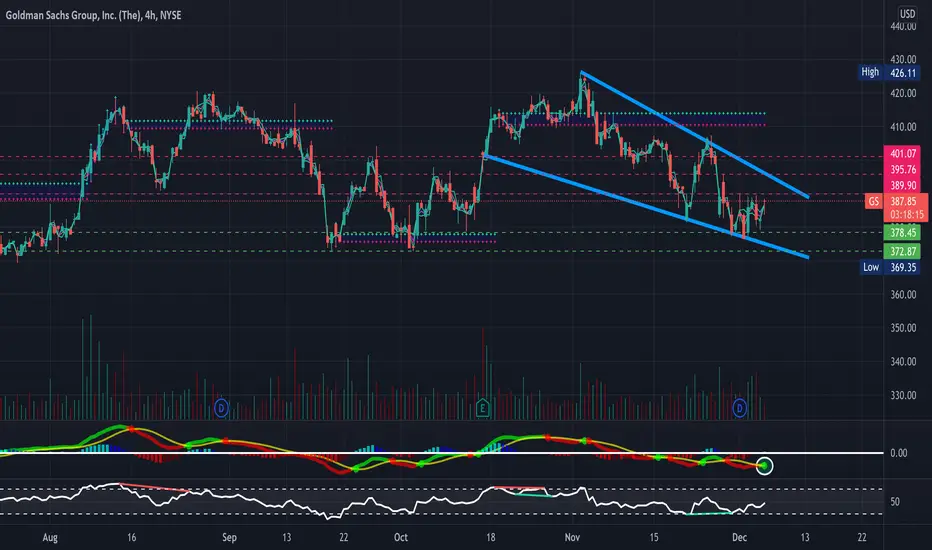
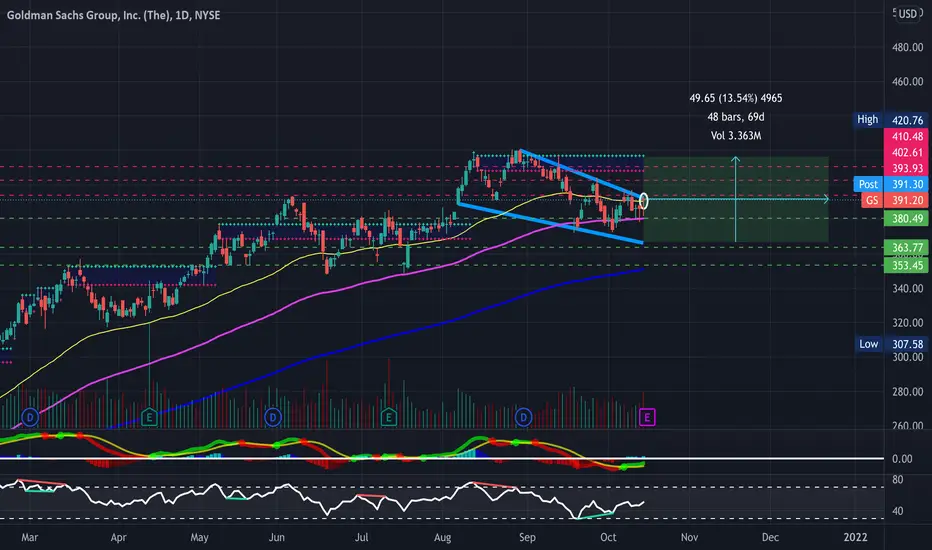
Falling Wedge- Bullish - UpdateJust posting a quick update here as GS has pulled back with the broader markets- Still bullish as GS respected support nicely and is holding within a nice falling wedge. Buyer volume starting to pick back up along with some bullish hidden divergence on the RSI & a golden cross on the MACD. Bullish and will be looking for a breakout from this wedge (Broader Market Conditions Permitting). Just some support and resistance levels to watch along with some RSI-based supply and demand zones to keep an eye on in the meantime- Bullish and looking for a breakout, see previous charts attached below for previous price targets.
- Falling Wedge
- MACD Cross on the 4-Hour Timeframe
- 8-Day EMA & RSI are About to Cross on the 4-Hour Timeframe (Not Pictured)
- Bullish Hidden Divergence on the RSI on Shorter Timeframes as well
- Gap Fill on the upside circa $395.90-398.90
- Double Bottom off Support and Bullish Hammer off the VWAP on the Hourly Timeframe (Not Pictured)
-Previously Charted-
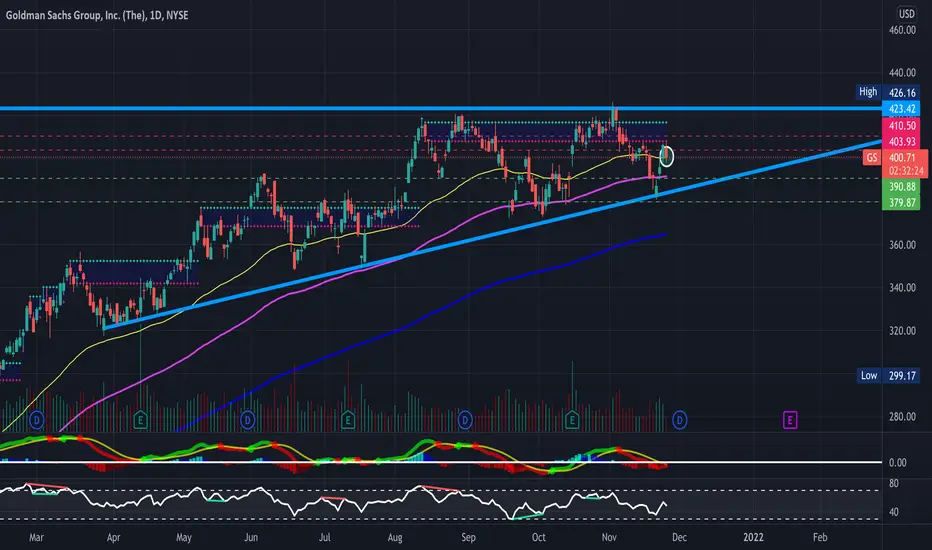
Ascending Triangle Forming- UpdateJust posting a quick update on GS as it would appear to be a nice bullish ascending triangle forming on the GS daily timeframe. Solid close yesterday after reclaiming the 50-day SMA as well sitting right on the 50-day EMA. GS is also holding a bullish falling wedge on the 4-hour and shorter timeframes. Just some support and resistance levels to watch along with some RSI-based supply and demand zones to keep an eye on in the meantime- Bullish and looking for a breakout, previous charts are attached below.
- Ascending Triangle Forming on the Daily Timeframe
- MACD Cross on the 4-Hour Timeframe (See Attached Chart Below)
- Falling Wedge on the 4-Hour Timeframe (See Attached Chart Below)
- 8-Day EMA & RSI are About to Cross on the 4-Hour Timeframe (See Attached Chart Below)
- Slight Bullish Hidden Divergence on the RSI on Shorter Timeframes
- Reclaimed the 20-day & 50-day EMA's, SMA's starting to converge as well
- Buyer Volume Starting to Pick Back Up Relative to Seller Volume
PT1- $402.62
PT2- $403.93
PT3- $405.73
PT4- $408.35+
4-Hour Timeframe
-Previously Charted-
Falling Wedge- Bullish - UpdateWill be watching GS closely for a breakout here (broader market conditions permitting). Solid close yesterday after reclaiming the 200-day SMA as well as forming a falling wedge on the 1-hour, 2-hour, and 4-hour timeframes. Just some support and resistance levels to watch along with some RSI based supply and demand zones to keep an eye on in the meantime- Bullish and looking for a breakout from this wedge
- MACD Cross on the Hourly Timeframe (Not Pictured)
- Bollinger Bands Squeezing on the Hourly Timeframe (Not Pictured)
- Bullish Hidden Divergence on the RSI
- Reclaimed the 200-day SMA
- Buyer Volume Starting to Pick Back Up Relative to Seller Volume
PT1- $403.71
PT2- $404.93
PT3- $405.73
PT4- $408.35+
Previously Charted-
Gs trade opportunity Gs has a very nice ascending triangle on the 1 year, the market is a little bit choppy right now so i would go light but untimely the set up is very nice

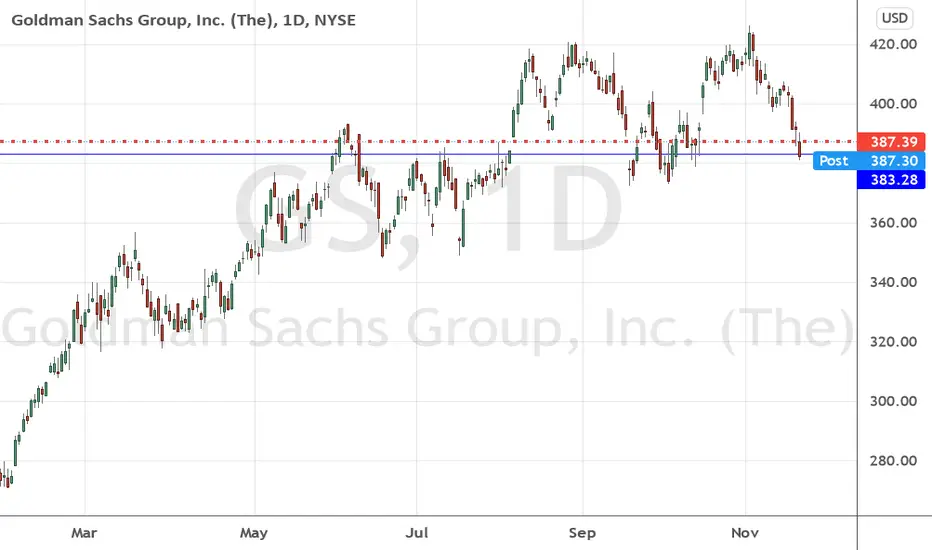
LONG GS: INFLATION/ FED HIKE CYCLE/ 6X PE/ -10% CORRECTION ZONELong GS @383
TP: 600+
SL: N/A
GS at -10% correction lvl. Only trading 6x 12ttm and forward earnings. fed hikes/ inflation/ increasing rates good for banks especially as GS ramps up retail exposure/ loans.
Also if u look at last 2 years GS has bounced off of the -10% lvl every time.
LAST BLOWOFF top wave structure GOLDMAN SACHS TOP NEAR427 My view of what is just ahead is a 5th and finally wave up before the market as a whole is setup to break
WILL HISTORY REPEAT ITSELF WITH GOLDMAN SACHS ? Here on the $GS chart we see the beginning of a pattern we first saw in august and September last year. Will history repeat itself ?
$GS Staging a Breakout to ATHs$GS looks to be ready to break into ATHs
Not the best volume pattern but 2 things I like:
* Tight daily candles below supply line
* Earnings out of the way and decent good reaction to them with 66% growth reported
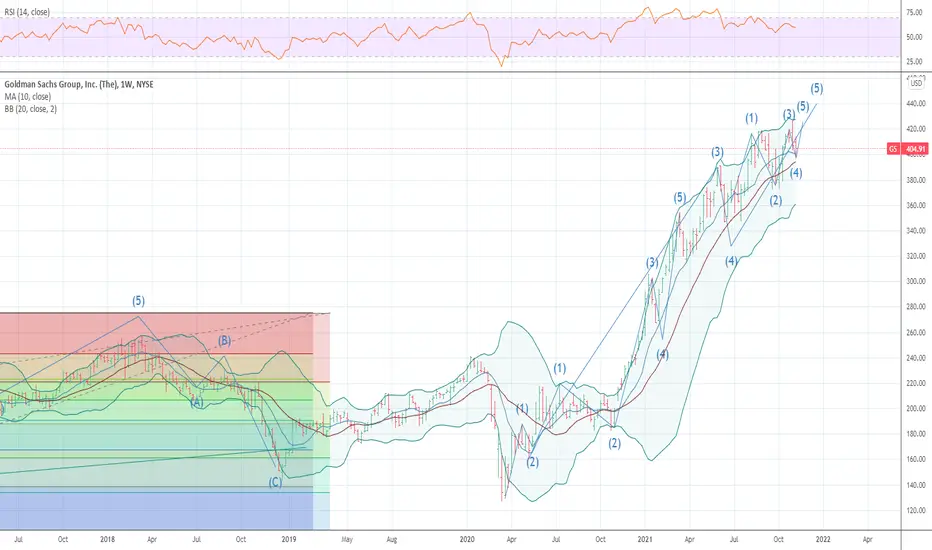
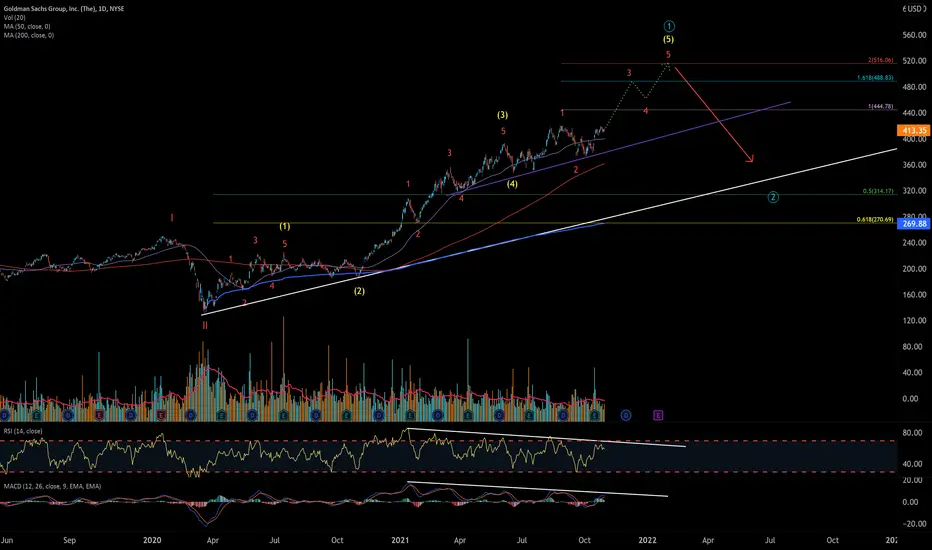
$GS - high level overviewGS appears to be in the minor wave 3 of intermediate 5 of primary 1. After this last extension we will be topping for a primary 1, and a large drop is likely to occur. This lines up with the overall view that soon the indexes will also be coming to a wave 5 top.
This could still extend for quite some time, possibly even tag 500, but the divergence here shouldn't be ignored. On a break of the lower TL(w/ volume confirmation), the backtest is a short with a PT being the covid TL which has confluence with covid low AVWAP (well above the 61.8 which will be the ideal bottom scenario for longs)
Trading this: scalp longs and wait for signal to go short
Falling Wedge- BullishWill be watching GS closely for a breakout here (broader market conditions permitting). Solid close today after reclaiming the 50day MA as well as forming a falling wedge on the 4-hour and daily timeframes. Definitely important to note also GS does have earnings coming up on 10/15' - Just some support and resistance levels to watch along with some RSI based supply and demand zones to keep an eye on- Bullish
- Falling wedge ( bullish )
- Bullish divergence on the RSI
- MACD cross
- Reclaimed the 50-day EMA
- Earnings on 10/15'
PT1- $395.57
PT2- $396.11
PT3- $399.90 + Breakout

GS - Coiled Spring Between 8 and 20day MA(Opinion Only)
Rates would favor the bullish long setup here.
Held the 8day MA and so far 20day is resistance.
Bullish above the 8day.
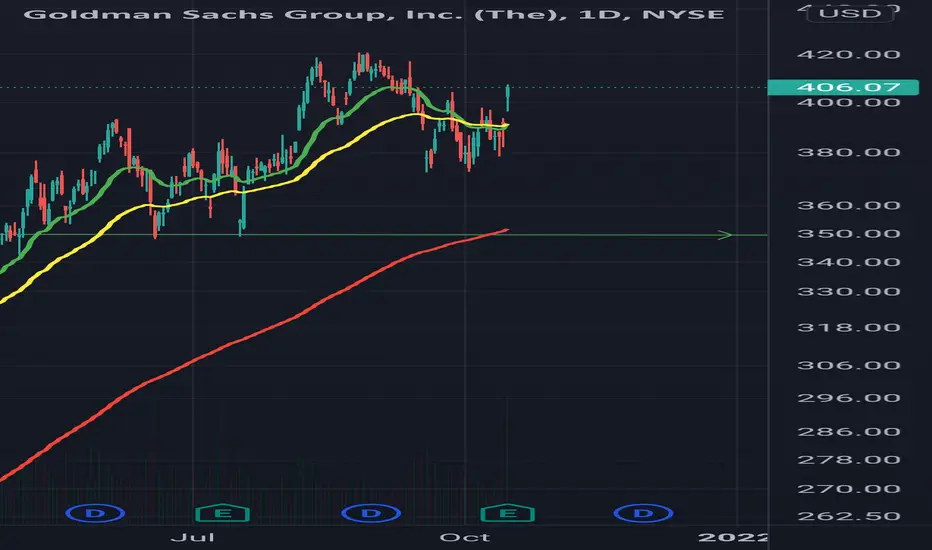
10/17/21 GSGoldman Sachs Group, Inc. ( NYSE:GS )
Sector: Finance (Investment Banks/Brokers)
Current Price: $406.07
Breakout price trigger: $405.00(hold above)
Buy Zone (Top/Bottom Range): $396.75-$379.00
Price Target: $419.30-$421.60 (1st), $465.00-$467.40 (2nd)
Estimated Duration to Target: 19-21d (1st), 123-130d (2nd)
Contract of Interest: $GS 11/19/21 410c, $GS 1/21/22 430c
Trade price as of publish date: $9.70/cnt, $10.27/cnt

Goldman Sachs (GS) LONG OpportunityNice double bottom at $372 and bouncing off the 120 EMA.
Gapped above the daily down trend line for past month.
A 127.2 Fib extension from last major high to low gives
possible target of $433
Financials usually like higher inflation and interest rates,
up to a point. BOA and others breaking upwards.
They may want to fill the gap down to $393ish before
taking it up

GOLDMAN SACH : CMP 406Stock breakout from weekly time correction when it breaks the levels of 250...and already give 60 percent return....can sit and ride the journey at current levels with SL 355 on closing basis and trail it....stock can be in range bound for more one month and then start more upside
GSGS looks good for highs once again iMO..
Over 399 get ready for 403 - 411 - 420 R LVLS
Can scalp 399 to 403 on a quick play. .
If buying commons
LIS 390

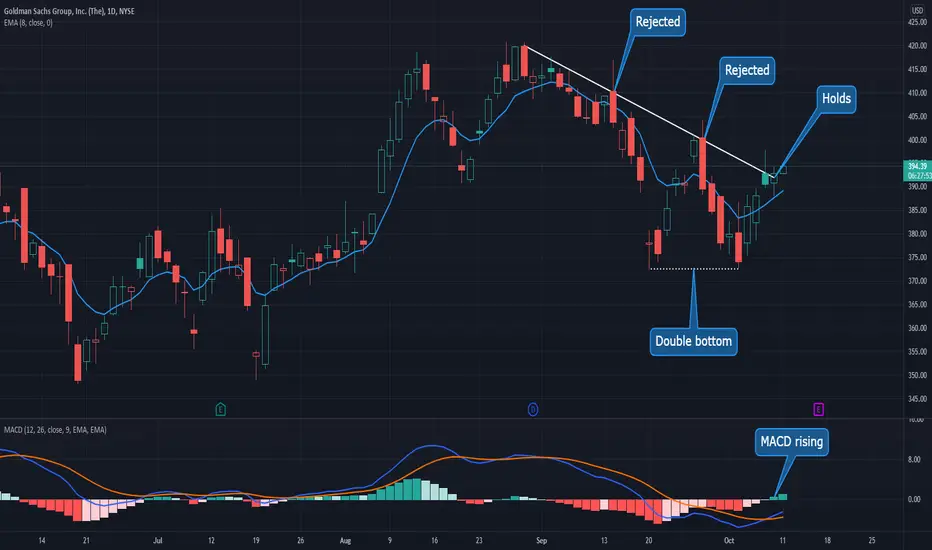
Goldman Fights the DowntrendGoldman Sachs hit a new high late in the summer. Now after a healthy pullback, it may be ready to keep moving.
The first pattern on today’s chart is the falling trendline that began on August 30. GS tried to break that resistance twice last month. It was rejected both times with large bearish engulfing candles. But on Thursday it touched the line and managed to close above it the next session.
Second, notice the double-bottom around $372.50 on September 20 and October 4. Such a bullish reversal pattern could mark the end of its shorter-term downtrend.
Third, GS closed above its 8-day exponential moving average (EMA) for the last four sessions. That hasn’t happened since the pullback began.
Finally, the situation off the chart is potentially positive as interest rates rise, financials advance and GS prepares to report earnings on Friday.
TradeStation is a pioneer in the trading industry, providing access to stocks, options, futures and cryptocurrencies. See our Overview for more.
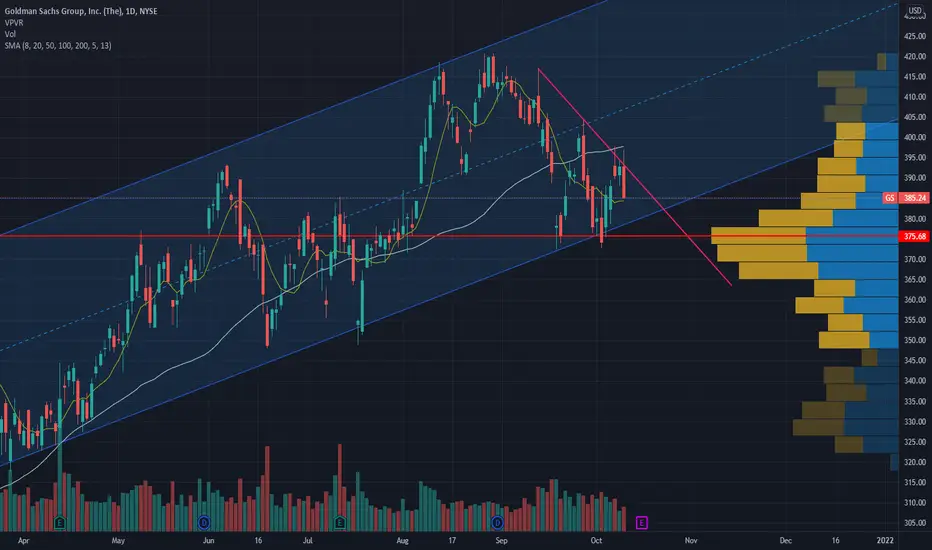
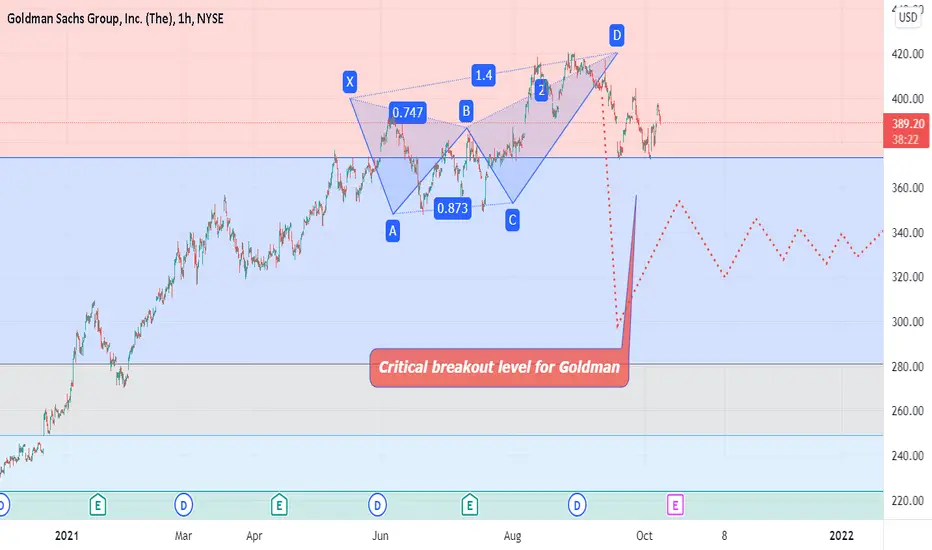
GS swing short updateGS down about 10% from entry, but for the first time in this trade we're getting into the area I am really interested in. The major inflection point. Shallow rally off it, I'd expect to see that in a break - but will the break come next?
Big decision level for Goldman. See linked for previous.
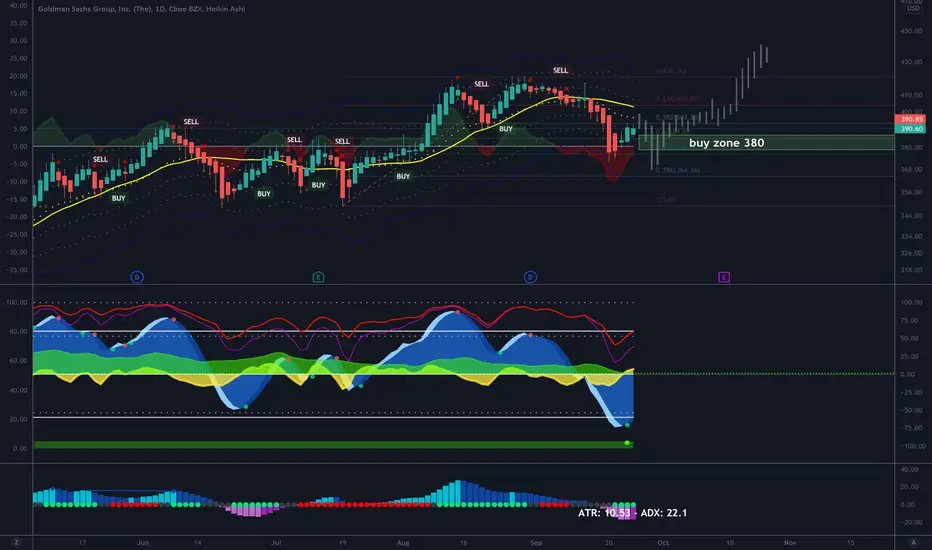
GS could pull back to 380 and hit my buy zoneGS could pull back to my buy zone of $380 and consolidate here. We may get a run into earnings type price action and hit my target of $400
GS to the long side as long above the 8day MA Rates spiking higher to 1.45% good for the banks and Goldman is no different.
(Opinion only)
Goodluck
