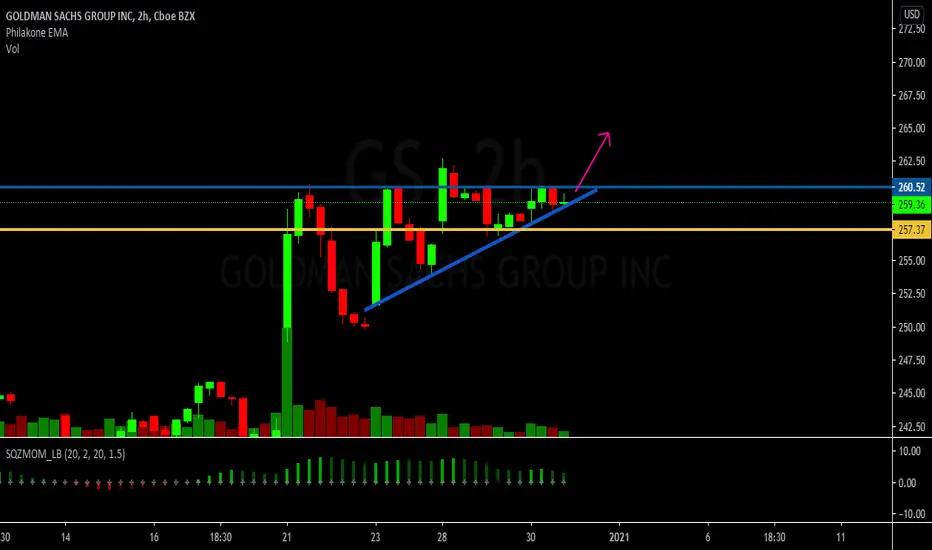
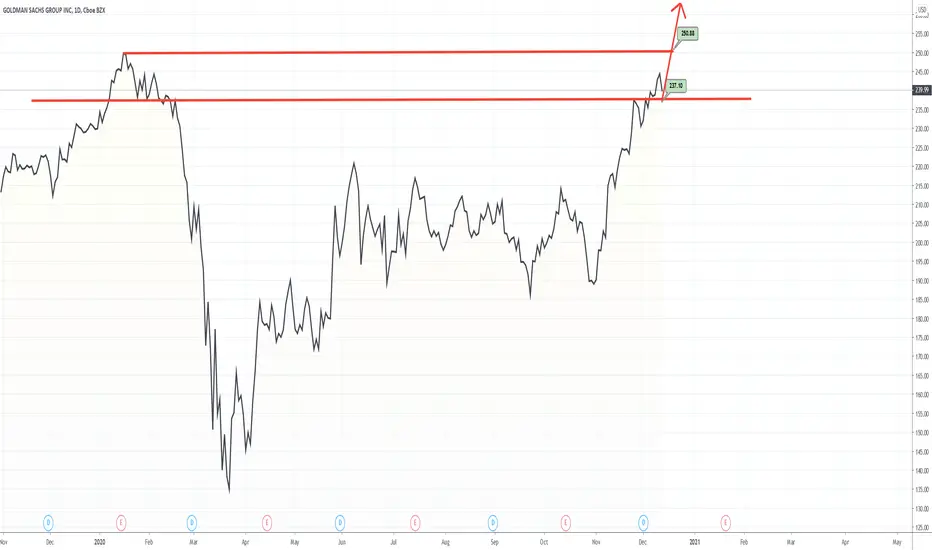
GS ascending triangle breakoutAnother great R/R setup here with NYSE:GS . Although there are two candles that broke above the resistance line, they quickly corrected back to the trendline. Today's doji candle is a good sign of the strength of the trendline. The stop will be on the break of this trendline and the first major target is 262 followed by 267. Due to the shortened day as well as New Years low volume, it is possible for this setup to be invalidated rather quickly, so play accordingly.
GS trade ideas
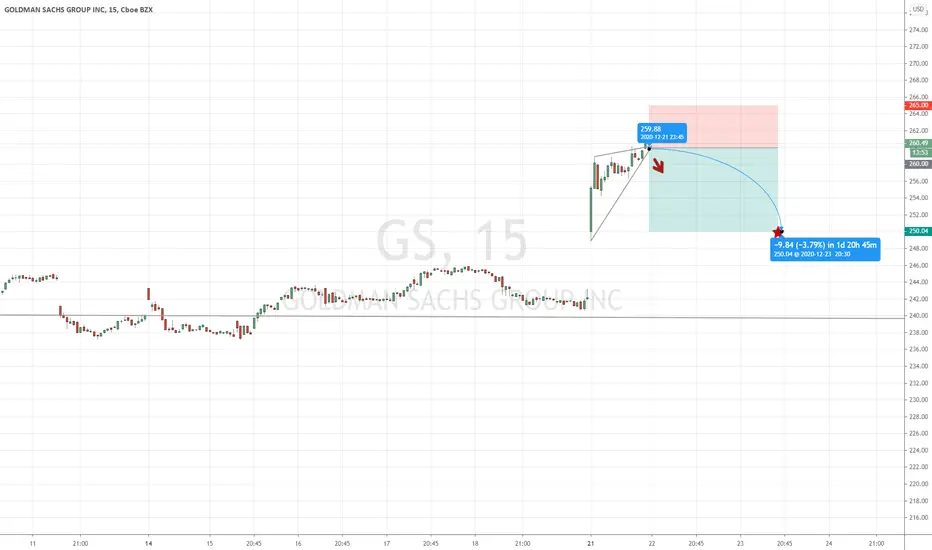
Open short GS [260$] to 250$ price targetAfter +7.5% gain on news about shares repurchases programm, all banks stocks has rocked.
Many funds has been started buying stock at first trading hourse, beated long time hights of volume.
Past 3 hours the volume is decreasing each hour, I prefer to think, that big money will form thier possitions at 250$-255$ range. My goal is take 10$ or 3.5% of short positions. I convince that nobody can take price at 260$ for long time and after little down S&P500 movements stock will too decrease to level of support 250$ where fund creating thier positions.

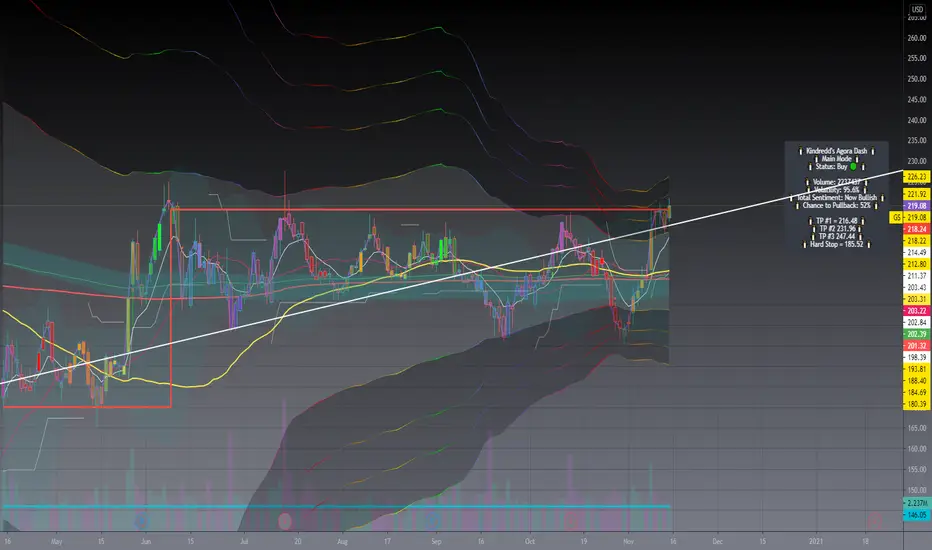
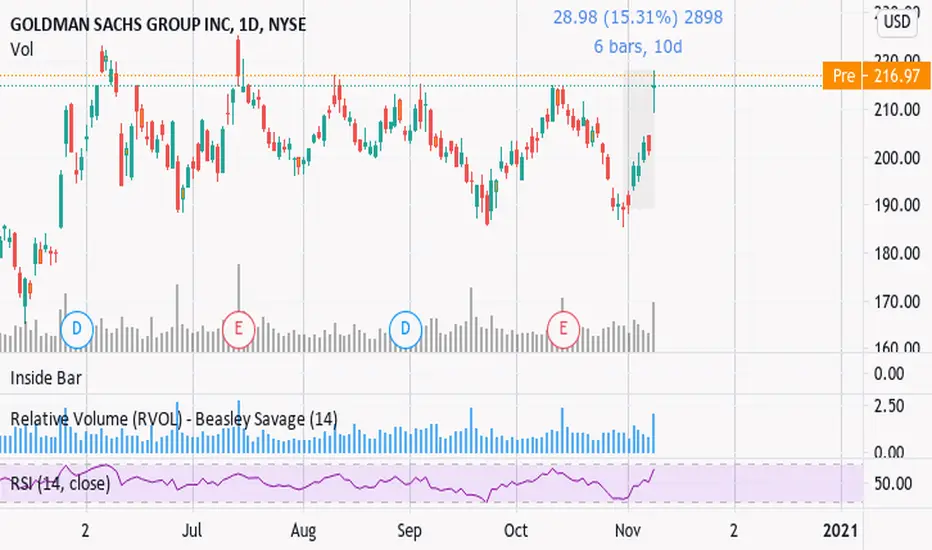
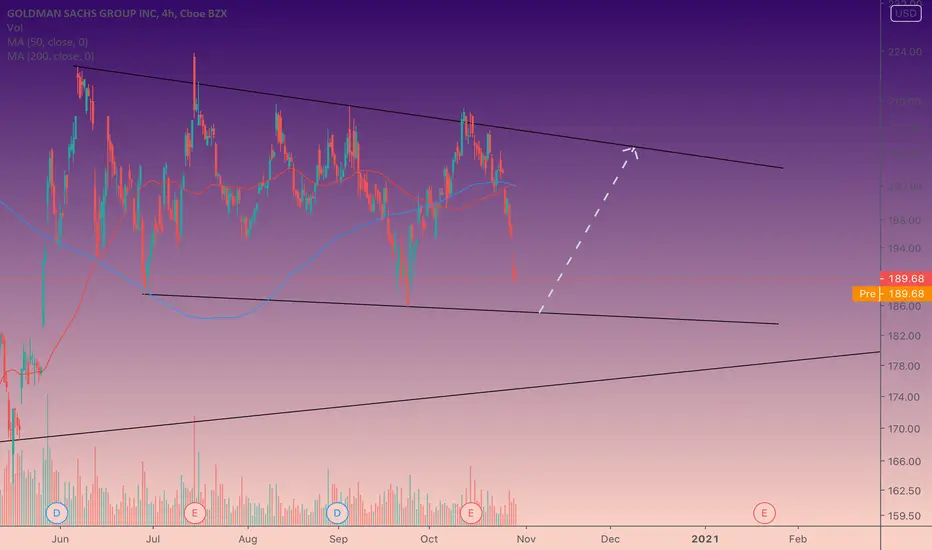
Goldman sachs path and directionHello everyone
This is my Goldman sachs idea for daily time frame
watch key notes for more detail on chart
for any question feel free to ask :) good luck

Goldman Sachs Group: Buy & Hold: USAGoldman Sachs Group: Buy & Hold: USA
A Profit & Solutions Strategy
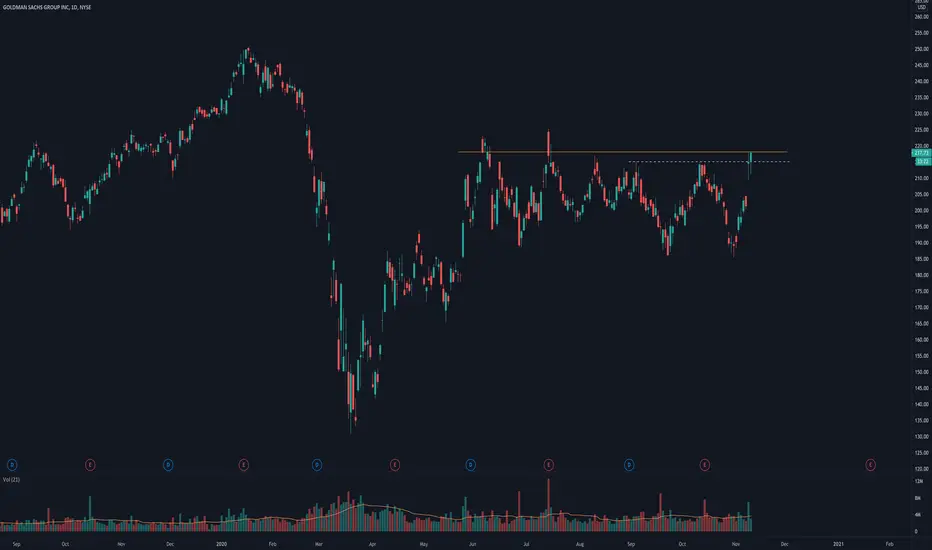
GSBig move today filled the last gap & closed under. Wouldn't be surprised for a quick retrace to $218-220.
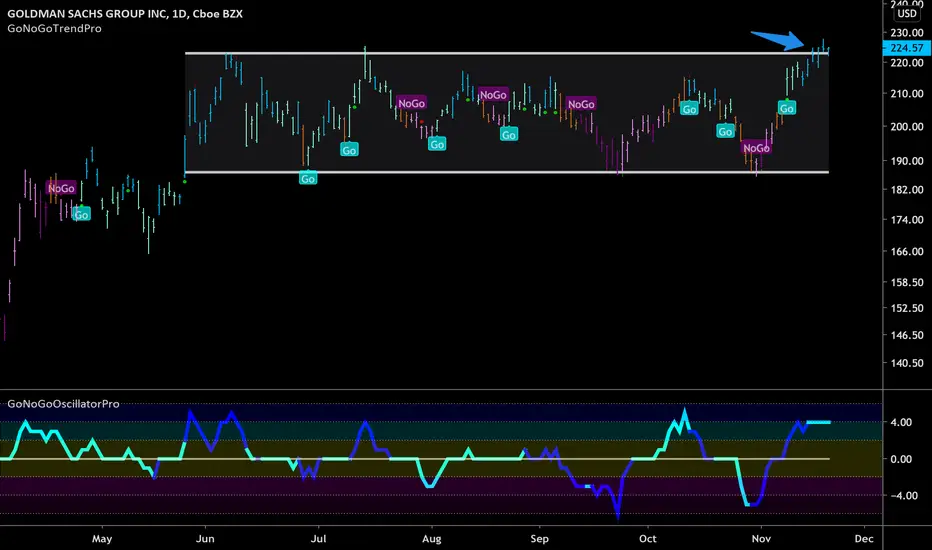
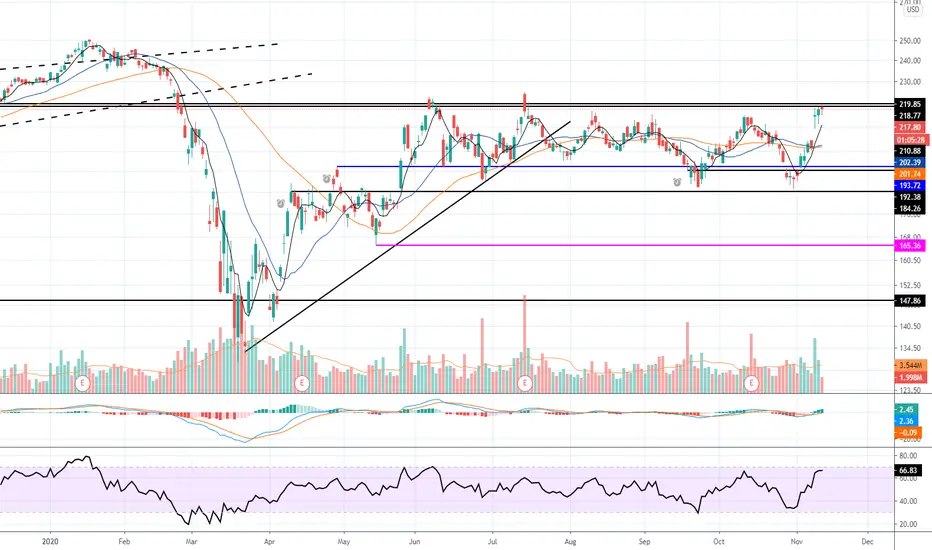
Goldman Sachs attempting to breakoutOn Monday in our Flight Path newsletter we highlighted Goldman Sachs. We see outperformance in the financial sector as the market rotates into new leadership.
We mentioned that price has consolidated sideways in a range since the crash from the pandemic.
While a new “Go” flag had been displayed on November 9th we discussed that there was strong overhead resistance from the range and that price would need to take out those prior highs in order to see a sustained up trend.
We did think it was possible though as this rally was accompanied by strong volume as shown by the GoNoGo Oscillator.
Now, this week price has indeed rallied and we see it is making a serious attack on the resistance levels. If it can solidify its place at and above 225 then that bodes well for this Go trend to finally take hold.
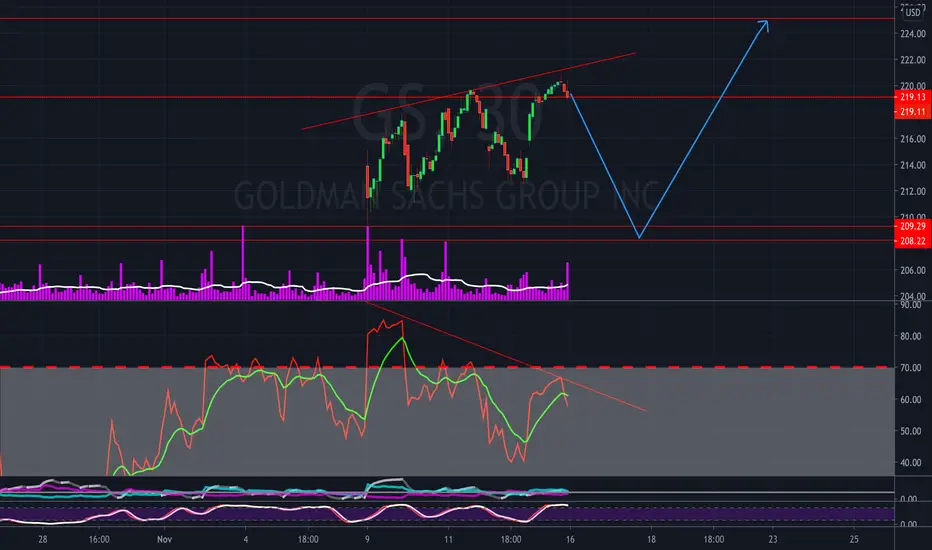
🟡 GS LONG 🟡GA Long Above 218.30
Price Target 220.30
Price Target 222.00
Ideal Target @224-225
Conservative SL @217.40
Max SL @216.00
BULLISH LONGTERM AFTER A CHEEKY DIPLong term chart Bullish... coiling in a tight range... divergence building and the gap is left to fill.. so that could be an area to look for a bounce
+15% profit, the (current) party is over .Why you find it hard to make money . Because you don't know AND more sadly, you don't know that you don't know.
When you were laying down on your coach thinking the market is going to continue the dropping , i was here watching the red knifes on the stock market having the bitter taste of watching a live down trend .
That's why i sell you guys at top , when the market is green and good , it's me who's dumping his shares " Market order " over late party joiner head's .
I don't want to be mean , and you should not take it this way . I want to remind you that you don't know and you don't know that you don't know.
Complete your 15 years required degree for the stock-market or take a short cut and get a mentor.
#Trade_safe
Trader K
+7% profit on GS , Market fooled you but not me! Admit it .Honestly i see a lot of baboons gurus and traders . I expected a strong bounce for the market and SPECIFIED which sector and it happened .
#financials is bumping the market up .
I proudly record my Correct sentiment AGAINST all the odds out there , everyone is bearish except me . And i made a good amount of $ . If you one the bears got burnt .I'm sorry that's me i'm one of those bulls teared you down ..
keep learning , trade safe.
Good luck ,
Financials will drive the market up . $GS Financials will drive the market up . This chart looks nice to me .

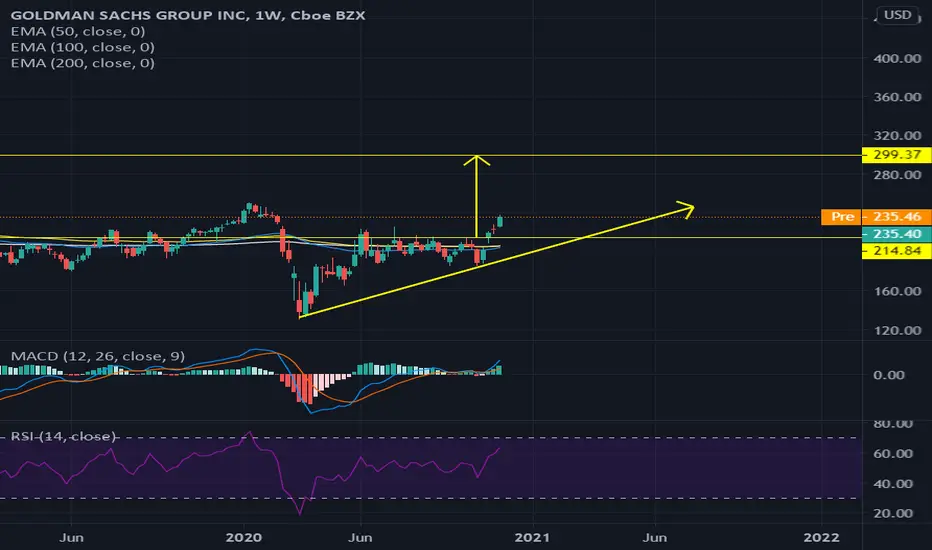
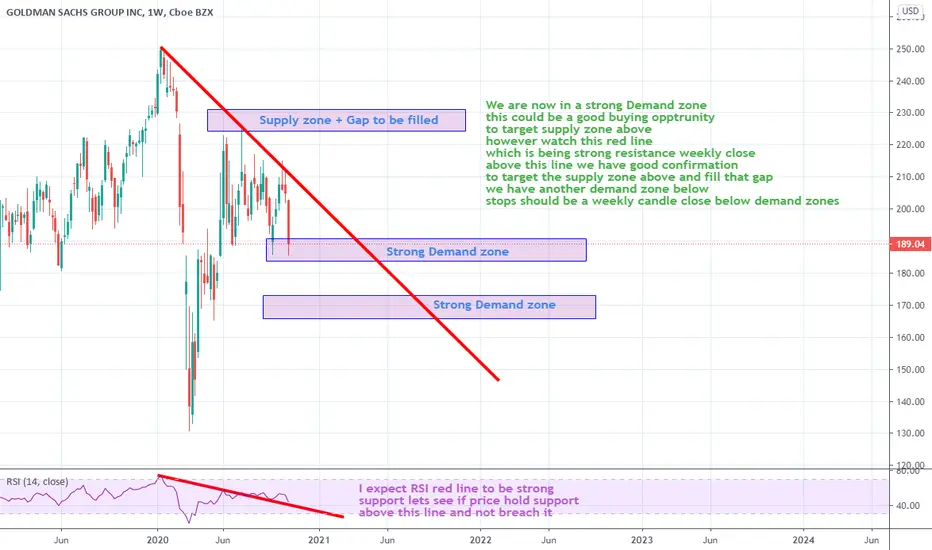
Goldman sachs path and directionHello everyone
This is my Goldman sachs idea for Weekly time frame
watch key notes for more detail on chart
for any question feel free to ask :) good luck
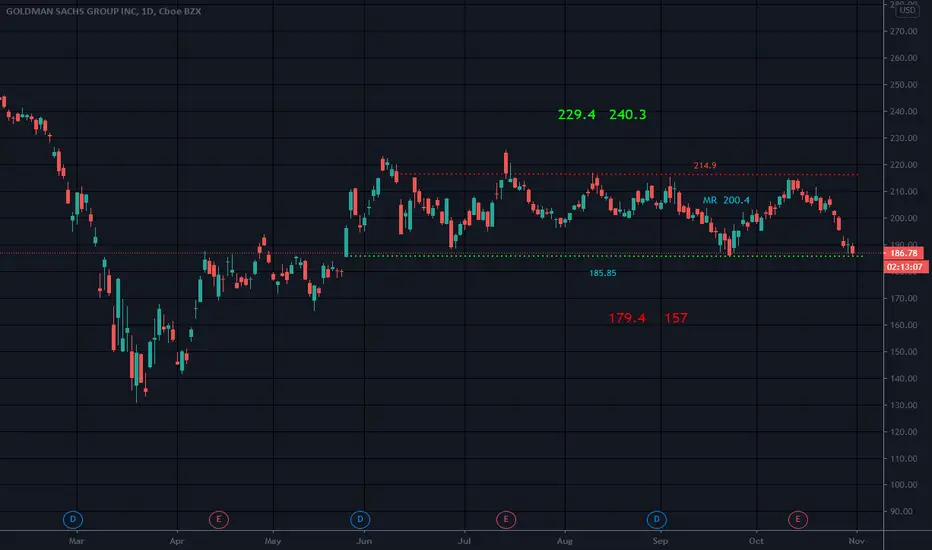
RectangleStop would be mid rectangle whichever way rectangle breaks/above or below MR
Targets listed for up and for down
A rectangle pattern is not completed until a break out has occurred
A Rectangle is a continuation pattern that forms as a trading range during a pause in the trend. The pattern is easily identifiable by two comparable highs and two comparable lows. The highs and lows can be connected to form two parallel lines that make up the top and bottom of a rectangle . Rectangles are sometimes referred to as trading ranges, consolidation zones or congestion areas.
I have noticed sometimes a stock breaks out of rectangle only to return to it..IE Visa
Not a recommendation
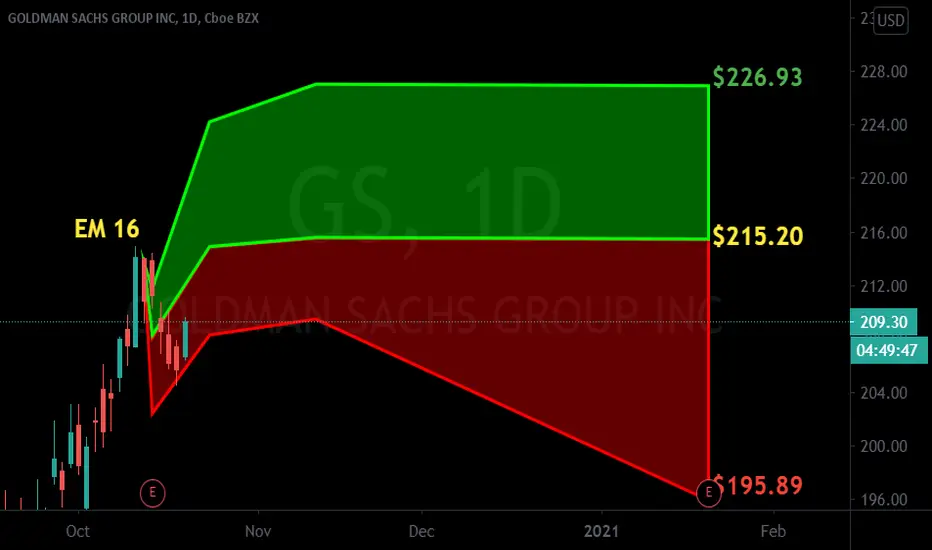
GS posting good earnings with a mild positive outlook$GS is looking for a mild bullish move after a positive earning results, price is currently trading on the lower end of the projected PEAD cone with good amount of room for an up move towards the median line.

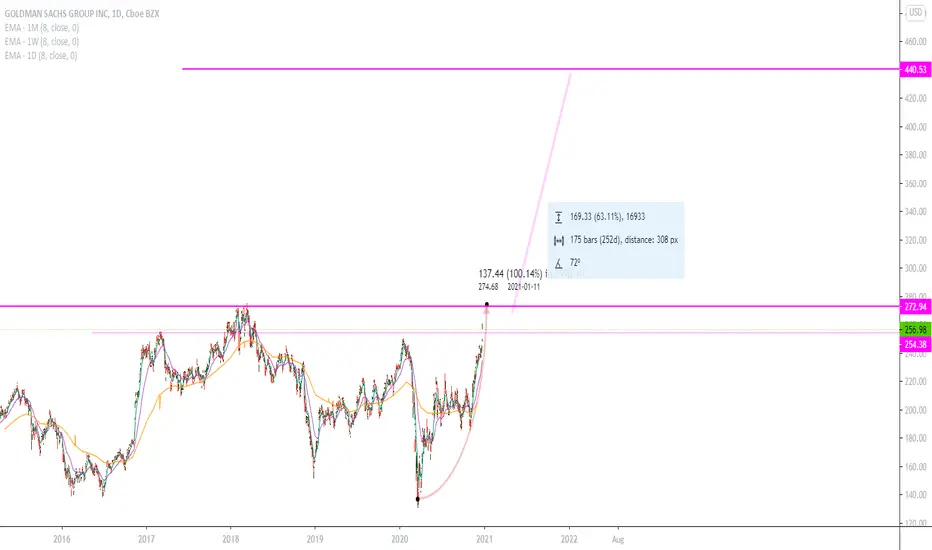
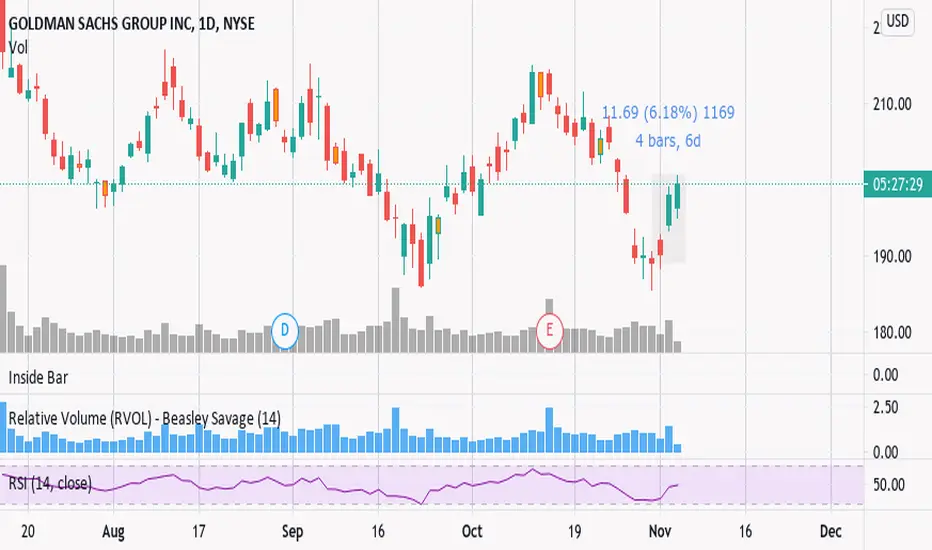
Goldman Sachs path and directionHello everyone
This is my Goldman sachs idea for Daily time frame
watch key notes for more detail on chart
for any question feel free to ask :) good luck
