Bank vs. Cryptocurrency #19 (GS)Continuing with my series of publications dedicated to the Financial Industry and creating variety in my publications (Variety of Industries)
If you look at my 10 past publications you can see the diversity of industries that I shared from Basic Materials to Technology Companies
from Consumer Services to Transportation this is a mix of different stock symbols in different sectors.
This is what I can do for you, put ideas in your desk and you decide.
About Goldman_Sachs_Group Inc. and the post,
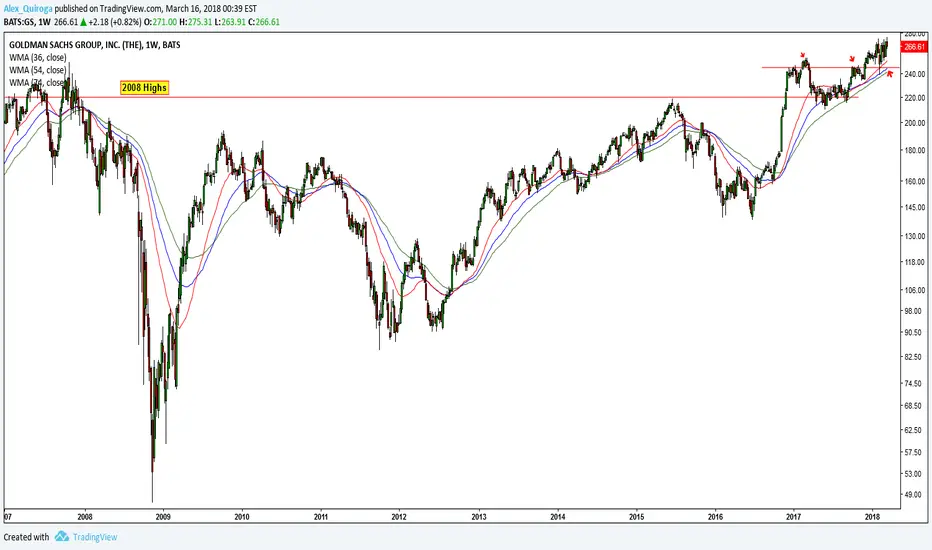
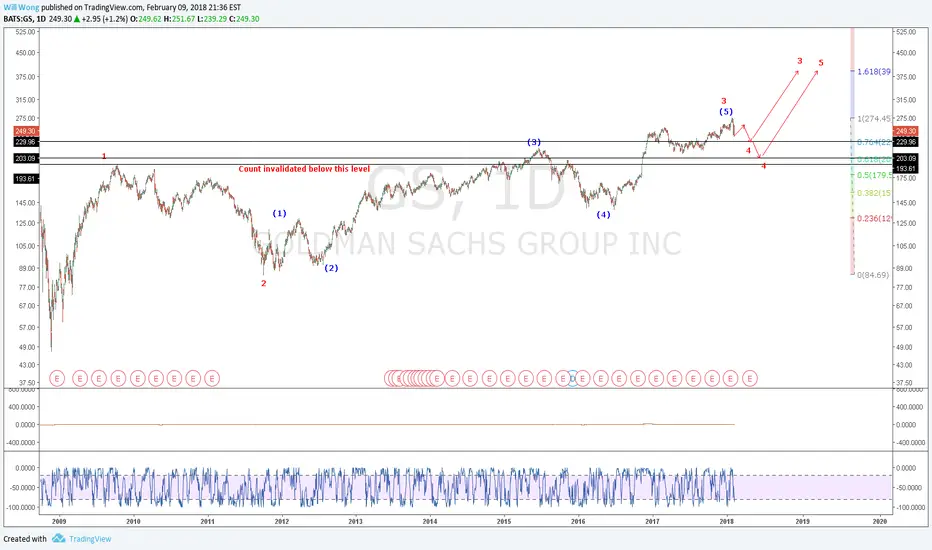
The stock is trading above 2008 Highs, and this until now begins
look why
How do interest rates affect banks?
www.investopedia.com
www.investopedia.com
GS trade ideas

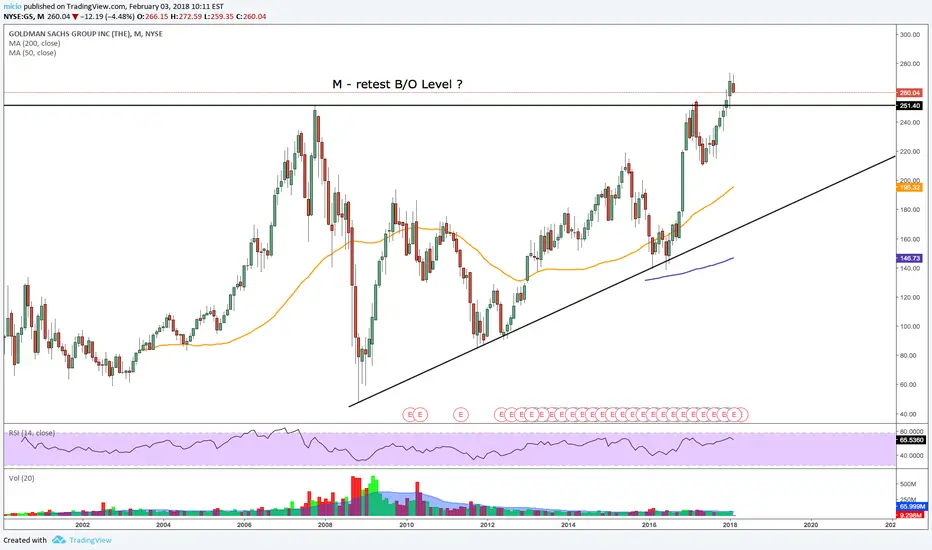
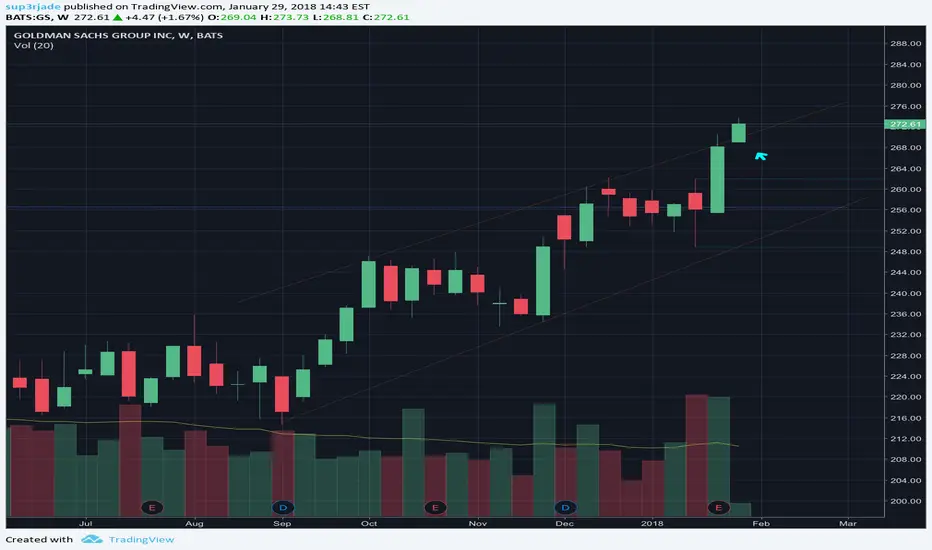
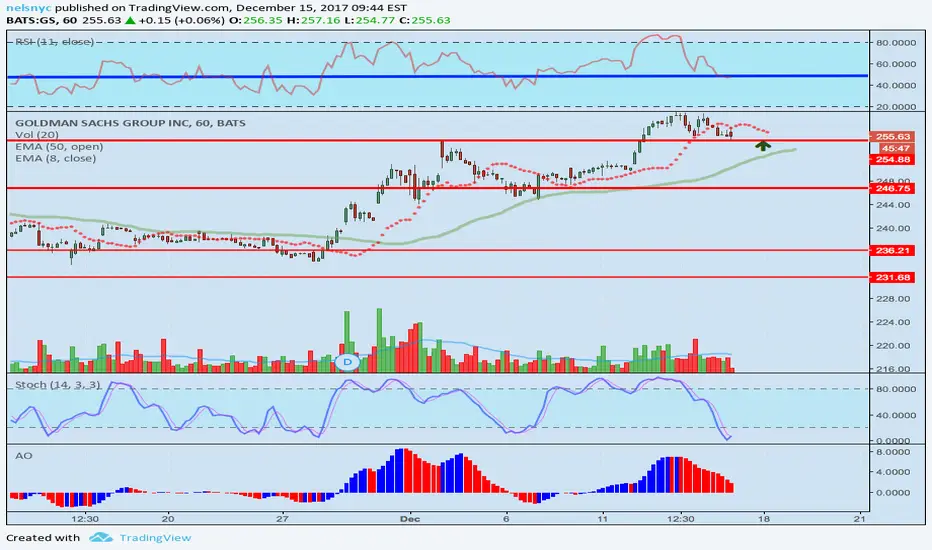
GSMonthly break out, now to retest ? Should move with the trend after retest. 250.- Level now support.
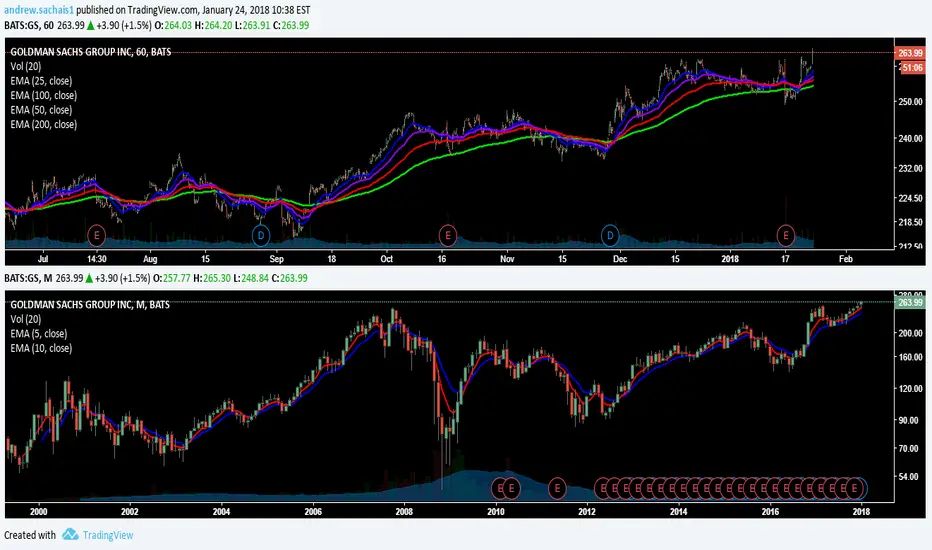
GS Looking Like a Daily and Weekly topping pattern???Sure looking like we will fall back into primary trend next week. Setting up for weekly HAMMER.
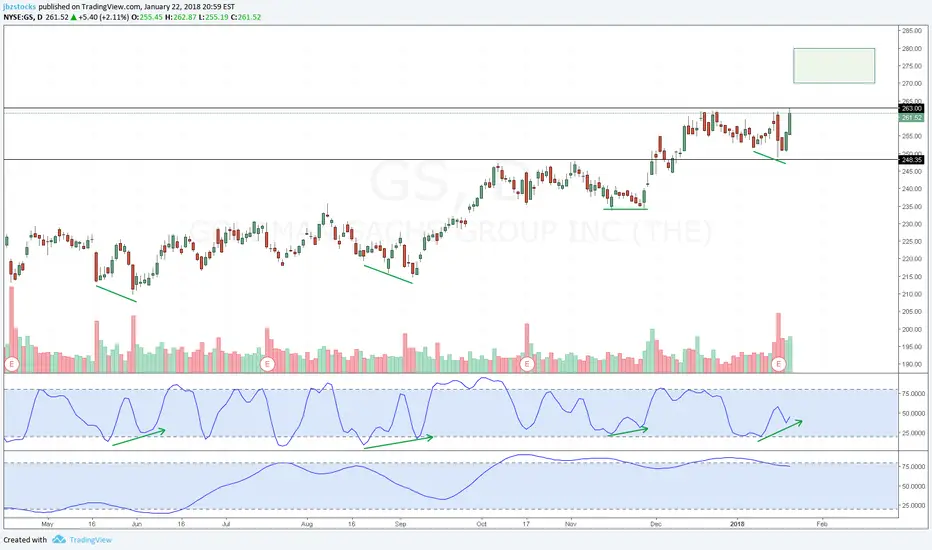

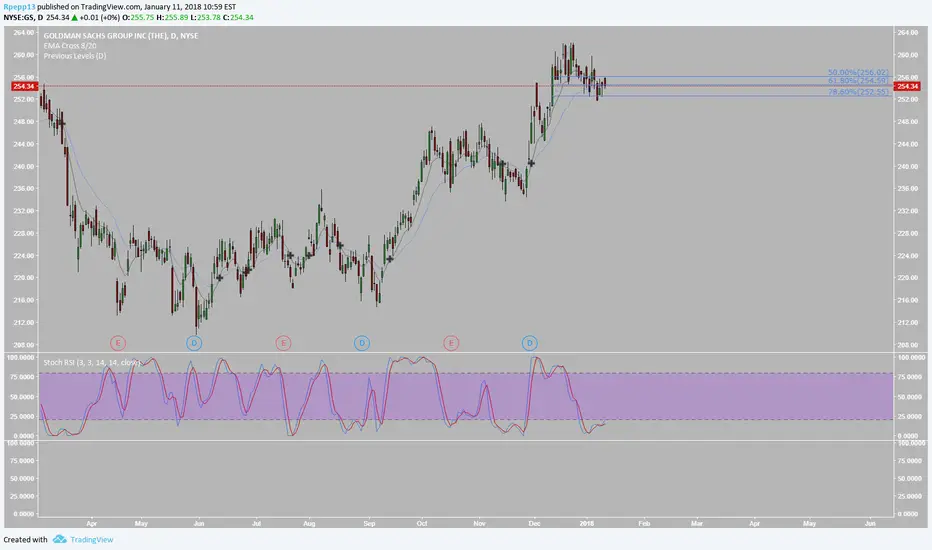
GS11 Jan 2018 - B'day today...another year older!..anyway. Trying to pick up GS following decent pullback. Stochastic is oversold, now moving up and Price at key levels and crossing. Picked up Jan exp 252.50 Calls
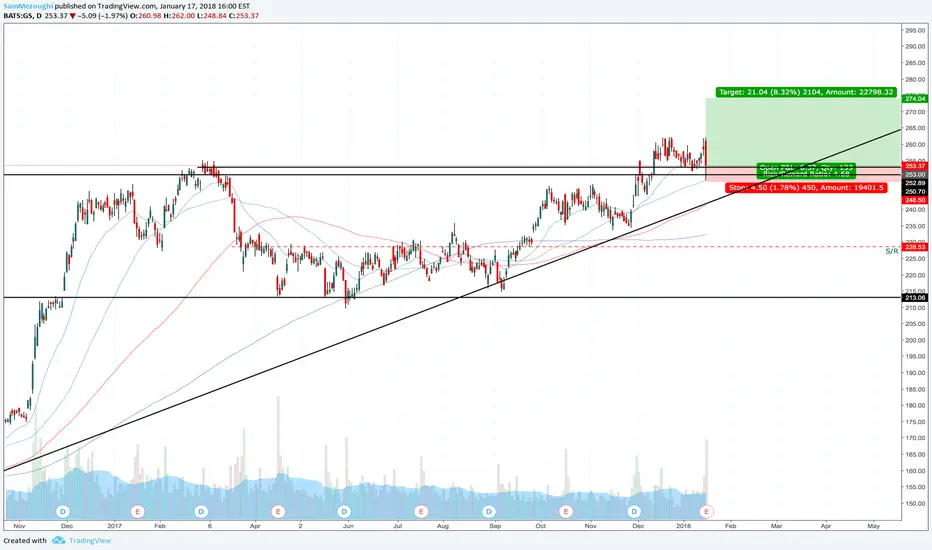
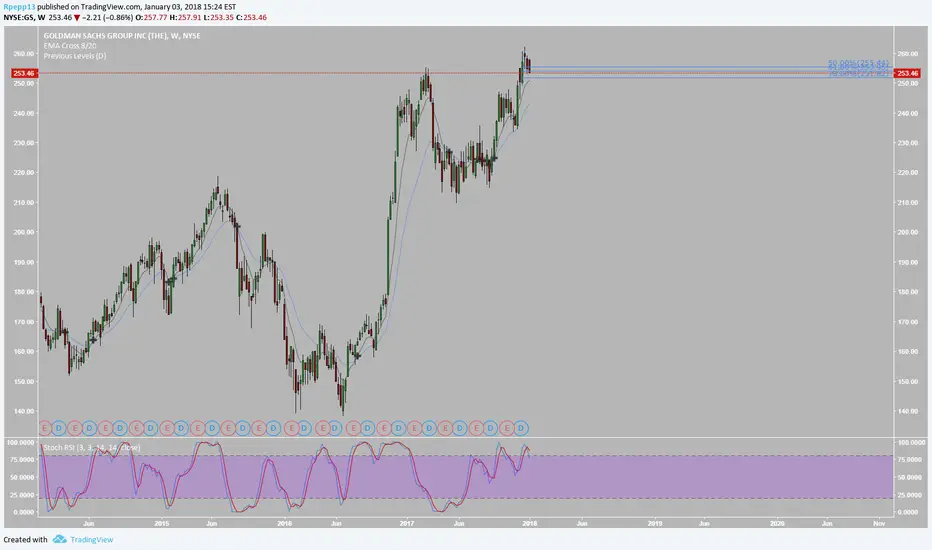
GS3rd Jan. Decent Pullback not finished yet. RSI Oversold on Daily. Weekly chart running into S/R level from late last yr. On Watch.

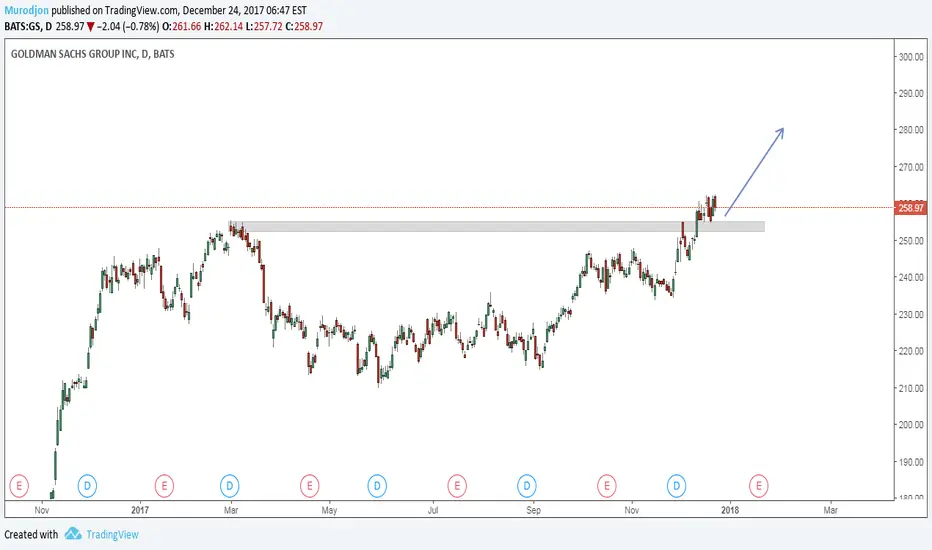
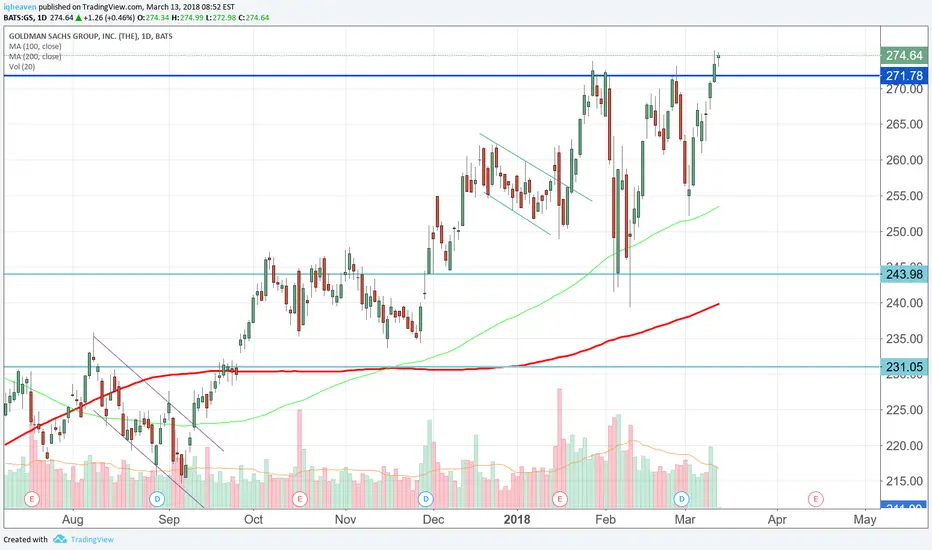
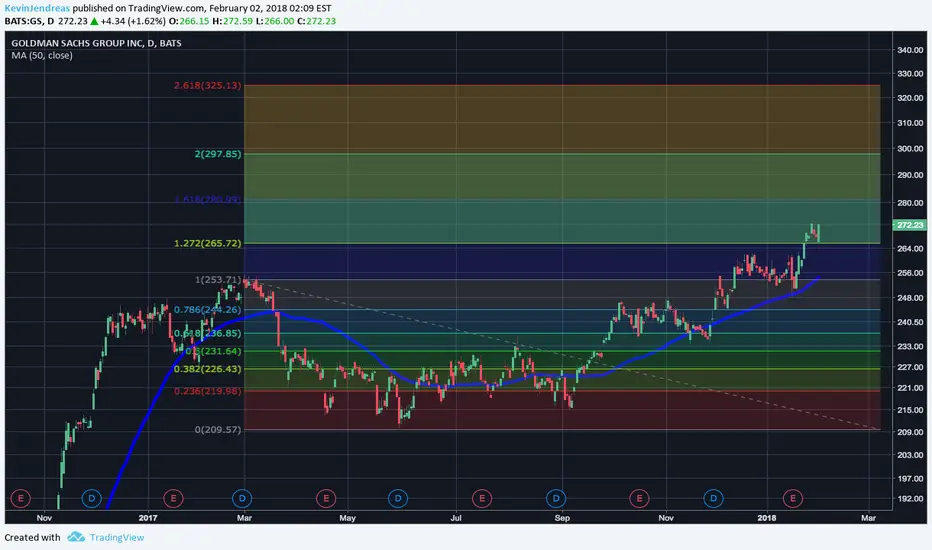
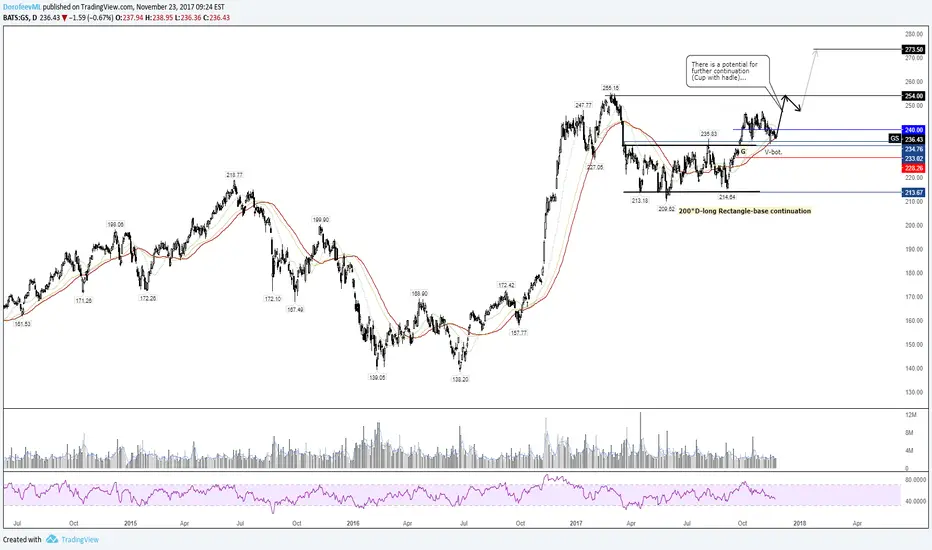
12.5.17 | GS | Day | Andrew AponasJournal Entry: It looks like price is making it's second attempt to break through a historical price ceiling. However the last two tests of this price ceiling have happened within a short time period of each other relative to this stocks behavior (I will include the detail below). This is an indication that price is getting ready to break through this price ceiling and begin a new rally to set all time highs, meaning this stock will begin to trade for high's it has never seen before. Over the past 6 months price has been trading in a sideways moving channel directly below this price ceiling, and has just recently began it's breakout to test it again. Moving through the ceiling is another major price level to break, a monthly supply line. A close above the supply line and price ceiling is going to be a strong indication that this stock is going to rally without looking back. I have my first target set at $260.30 drawn as an orange line with a blue target. Price right now may be forming a potential/possible bullish flag, which is validated by the declining volume and anomalies over the past three trading sessions. So far there has been only a few odd balls in the group of financials; GS is one and JPM is another. I think once these stocks show clear indication of a rally, the rest will have less resistance to trade to a higher level. Thank You, God Bless.
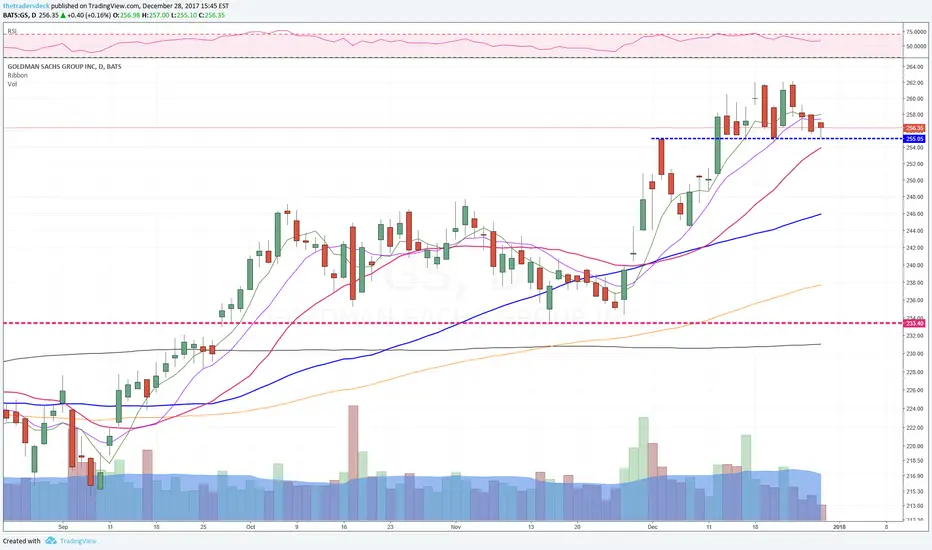
Indicators:
MACD has just made a major pivot below the 0 line and is still very bullish with wide spacing in the lines and bot still angled upwards. A bullish continuation in the histogram will be another strong indication of a bullish continuation.
OBV I will display the detail in an updated image below please see the detail for the narrative.

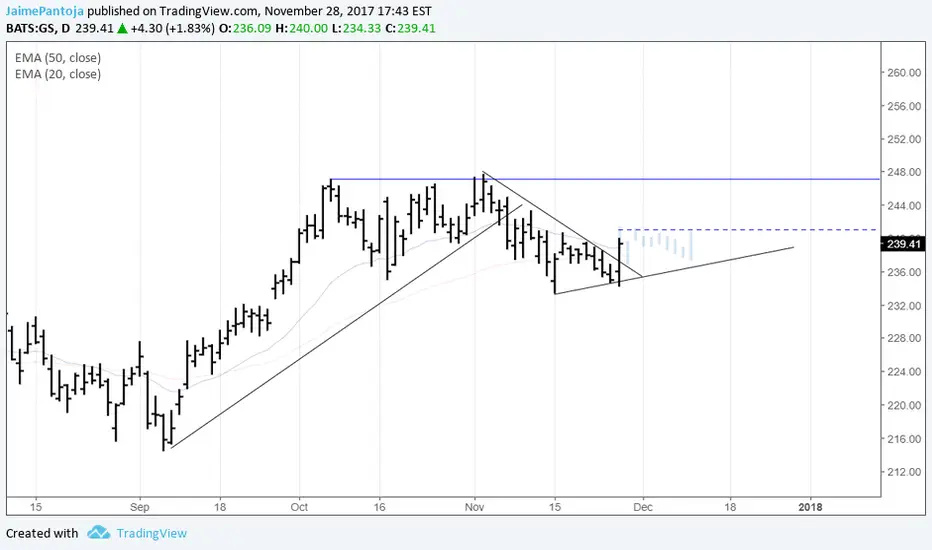
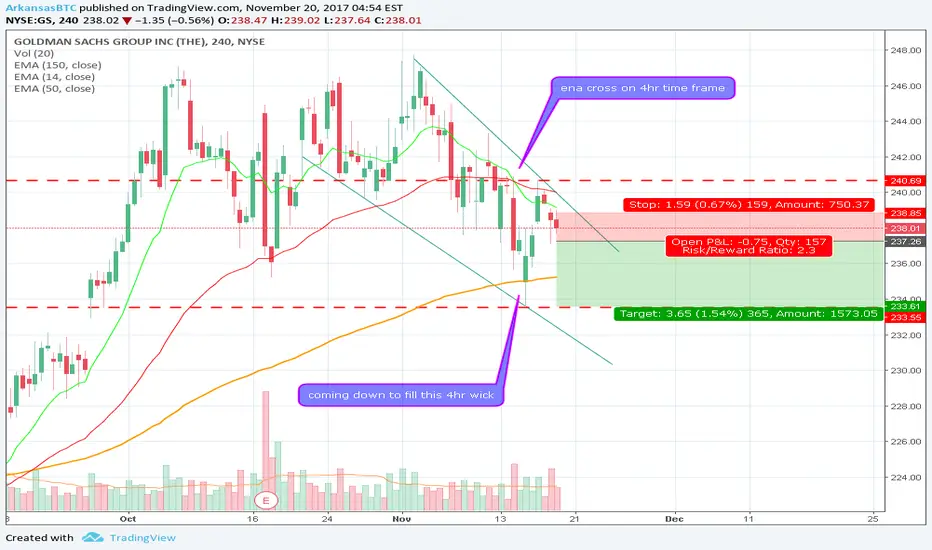
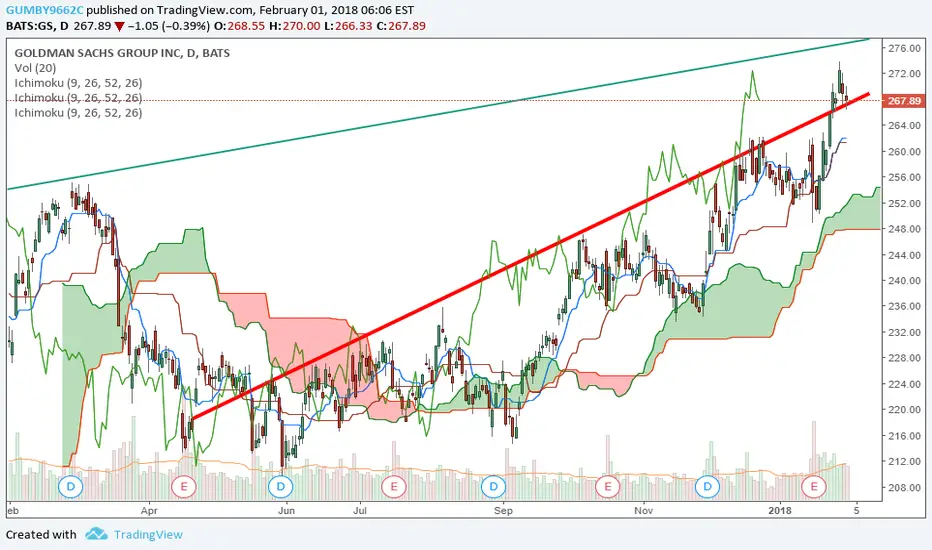
nyse: $GS Short plan for the week of 11/20/17Channel Down identified. This pattern is still in the process of forming b. Possible bearish price movement towards the support 233.55 within the next 2 days.
Supported by bearish Exponitial Moving Average cross on 4hr time frame