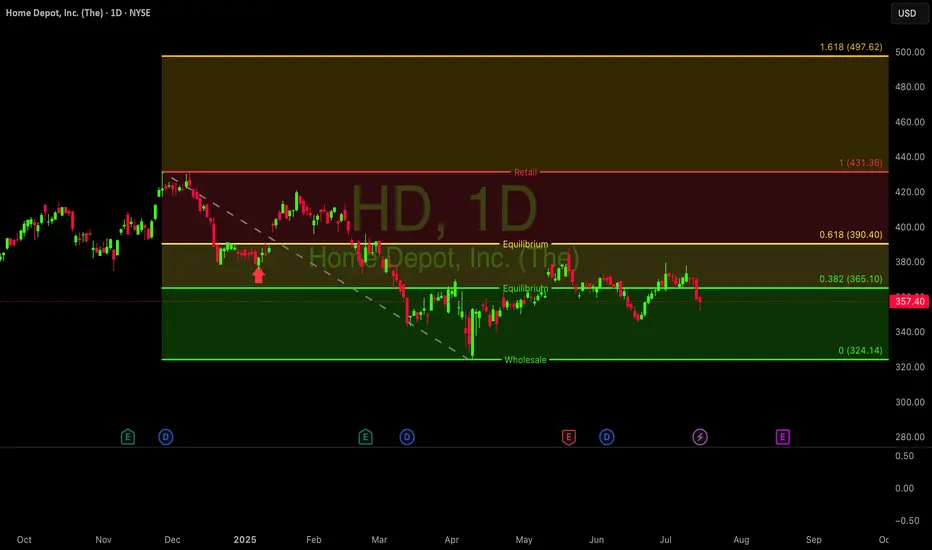
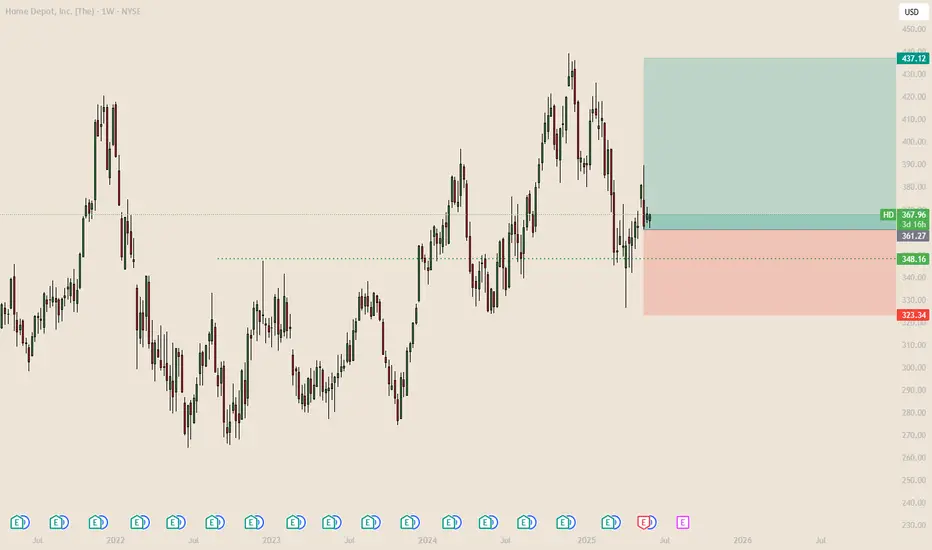
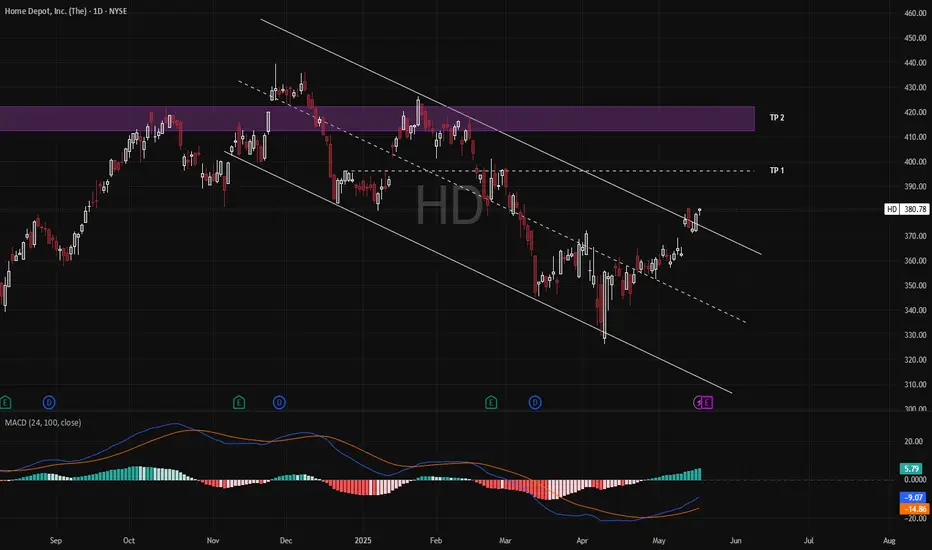
$HD - One of my bestfriend favorites <3NYSE:HD looking strong here, testing the 200-week EMA as a key support level. A classic spot for a long-term bounce. If it holds, could be building a base for a run back to the $426 highs. #HomeDepot #TechnicalAnalysis #Trading #Investing
Next report date
—
Report period
—
EPS estimate
—
Revenue estimate
—
14.77 USD
14.81 B USD
159.51 B USD
994.25 M
About Home Depot, Inc. (The)
Sector
Industry
CEO
Edward P. Decker
Website
Headquarters
Atlanta
Founded
1978
FIGI
BBG000BKZB36
The Home Depot, Inc. engages in the sale of building materials and home improvement products. Its products include building materials, home improvement products, lawn and garden products and decor products. The firm operates through the following geographical segments: U.S., Canada and Mexico. It offers home improvement installation services, and tool and rental equipment. The company was founded by Bernard Marcus, Arthur M. Blank, Kenneth Gerald Langone and Pat Farrah on June 29, 1978 and is headquartered at Atlanta, GA.
Related stocks
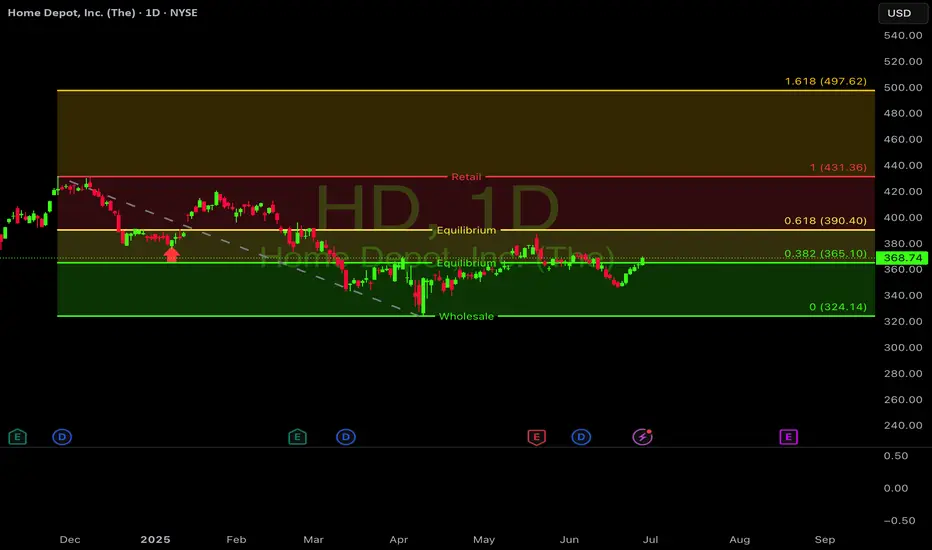
$HD - Cookie long hold this is bread and butterNYSE:HD hold a bullish position could see over $505 long term... <3
NYSE:HD breaking out with conviction! Up 5.2% this week on increasing volume. 12 analysts maintain BUY ratings with targets up to $455 (23% upside). Technical pattern shows higher lows since April. Strong revenue growth despite
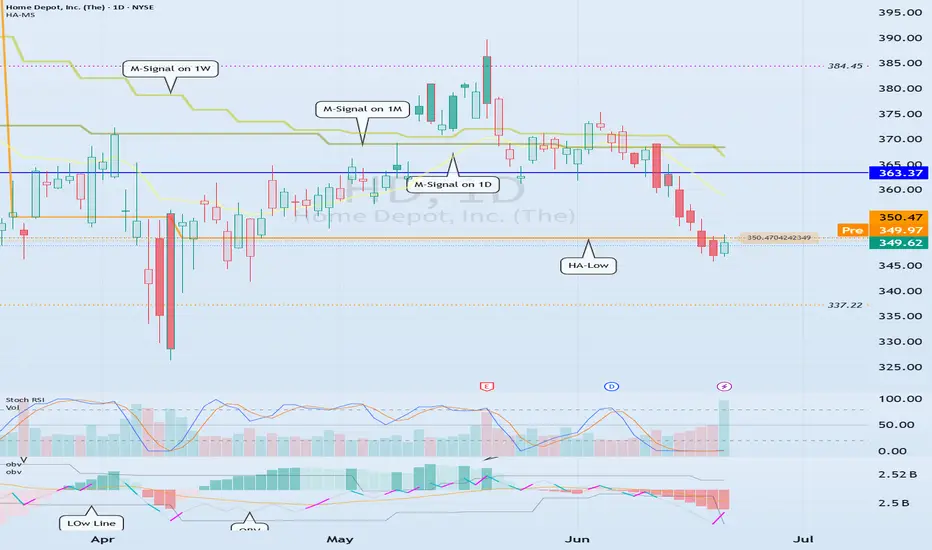
Check 350.47 support (HA-MS indicator interpretation method)
Hello, traders.
If you "Follow", you can always get new information quickly.
Have a nice day today.
-------------------------------------
(HD 1D chart)
Can the HA-MS indicator be applied to stock charts?!!!
The conclusion is that it can be applied to all charts.
However, since the stock marke
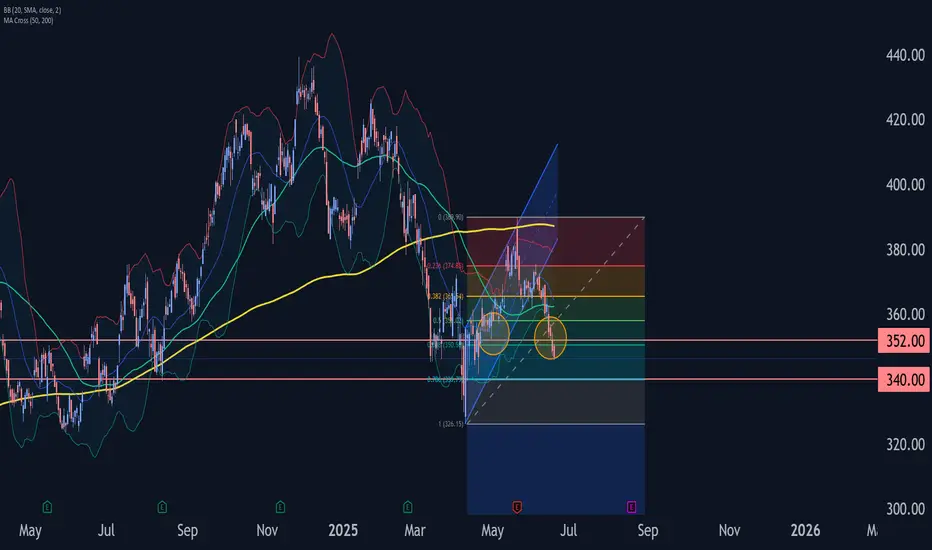
Home Depot Wave Analysis – 18 June 2025
- Home Depot broke support zone
- Likely to fall to support level at 340.00
Home Depot recently broke the support zone located between the support level 352.00 (low of wave A from April) and the 61.8% Fibonacci correction of the ABC correction (2) from April.
The breakout of this support zone acc
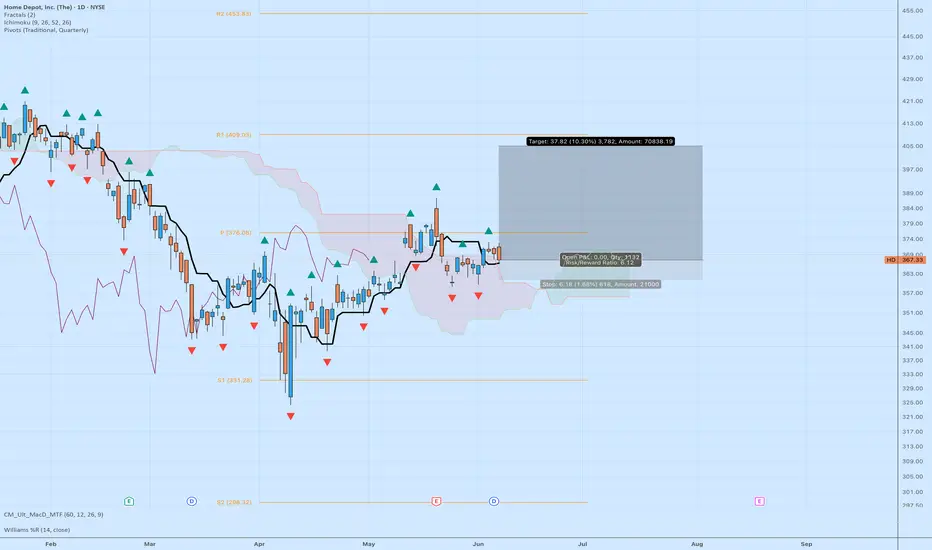
Long Setup: Home Depot ($HD) | Bullish Continuation Above Cloud 📈 Technical Setup:
Home Depot ( NYSE:HD ) is setting up for a potential bullish continuation after retesting the top of the Ichimoku Cloud and holding key support.
Ichimoku Cloud: Price is consolidating above the Kumo, with the Conversion Line (Tenkan) and Base Line (Kijun) flatlining — signaling p
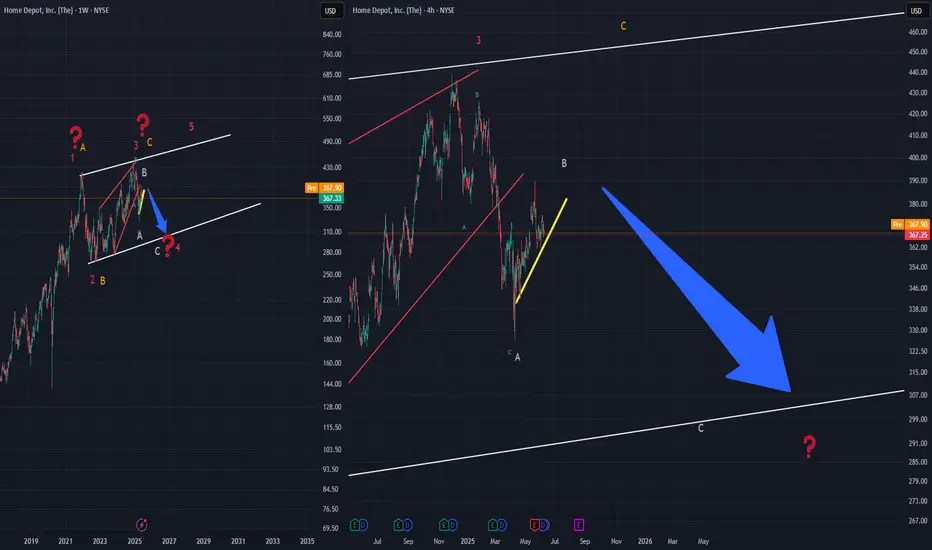
Home Depot – Pattern Suggests C Wave Toward $315 from $367 LevelHome Depot appears to be inside a pattern that fits either an Ending Diagonal or Skewed Triangle structure. From the $367 area, a potential C wave may begin targeting the $315 zone.
Investors should be cautious, as diagonal or skewed triangle formations often involve significant uncertainty. The wh
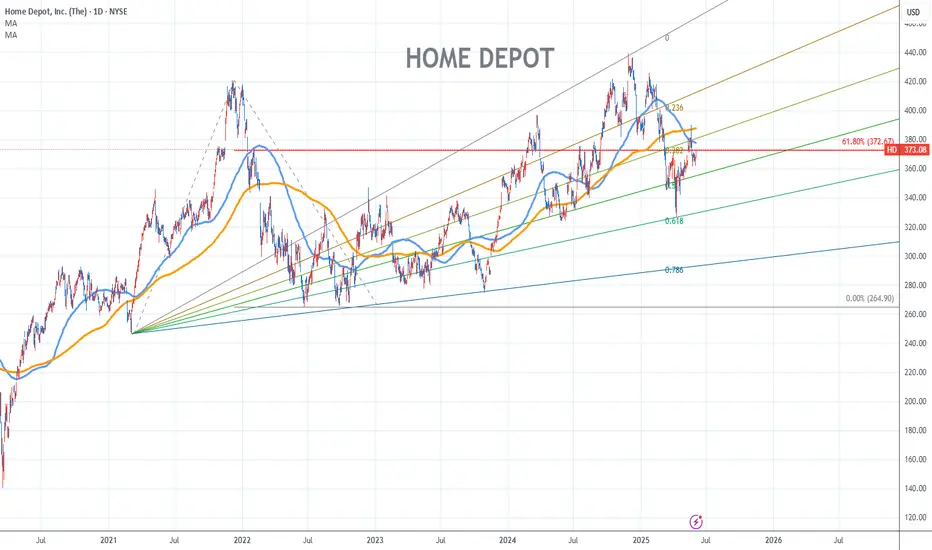
Home Depot Stock Chart Fibonacci Analysis 060325Trading Idea
1) Find a FIBO slingshot
2) Check FIBO 61.80% level
3) Entry Point > 372/61.80%
Chart time frame:D
A) 15 min(1W-3M)
B) 1 hr(3M-6M)
C) 4 hr(6M-1year)
D) 1 day(1-3years)
Stock progress:A
A) Keep rising over 61.80% resistance
B) 61.80% resistance
C) 61.80% support
D) Hit the bottom
E)
Home Depot LongSitting at a good spot technically speaking, whales accumulating, will probably go up
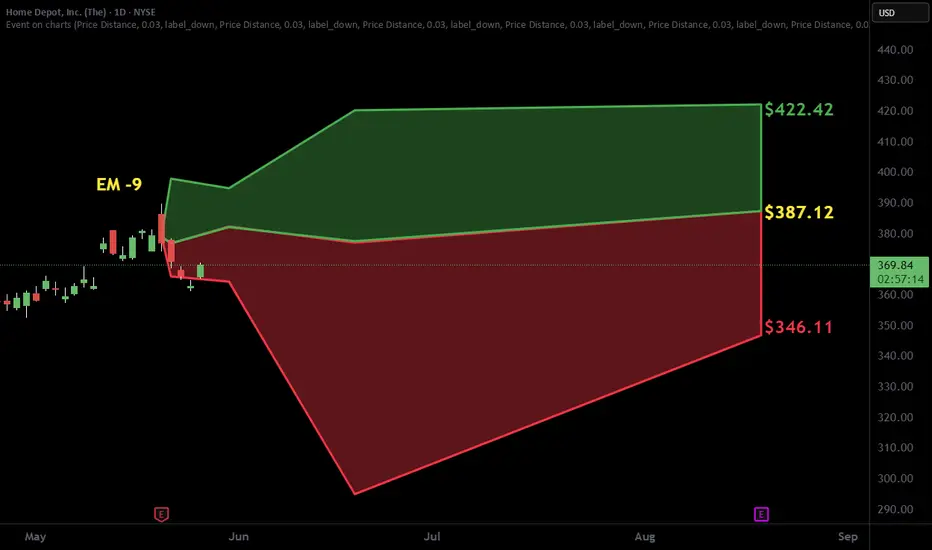
$HD with a bullish outlook following its earnings #StocksThe PEAD projected a bullish outlook for NYSE:HD after a positive over reaction following its earnings release placing the stock in drift B with an expected accuracy of 80%.
HD BULLISH POTENTIALHere's a professional and engaging English version of your summary, ideal for a social media or blog post:
---
🔨 Home Depot (HD) — Is the Bottom In?
Home Depot, often considered the U.S. equivalent of IKEA in the home improvement sector, just posted **strong Q4 2024 earnings**, signaling potenti
See all ideas
Summarizing what the indicators are suggesting.
Neutral
SellBuy
Strong sellStrong buy
Strong sellSellNeutralBuyStrong buy
Neutral
SellBuy
Strong sellStrong buy
Strong sellSellNeutralBuyStrong buy
Neutral
SellBuy
Strong sellStrong buy
Strong sellSellNeutralBuyStrong buy
An aggregate view of professional's ratings.
Neutral
SellBuy
Strong sellStrong buy
Strong sellSellNeutralBuyStrong buy
Neutral
SellBuy
Strong sellStrong buy
Strong sellSellNeutralBuyStrong buy
Neutral
SellBuy
Strong sellStrong buy
Strong sellSellNeutralBuyStrong buy
Displays a symbol's price movements over previous years to identify recurring trends.
US437076CG5
HOME DEPOT 21/51Yield to maturity
7.32%
Maturity date
Mar 15, 2051
US437076CK6
HOME DEPOT 21/51Yield to maturity
7.08%
Maturity date
Sep 15, 2051
HD4933111
Home Depot, Inc. 3.125% 15-DEC-2049Yield to maturity
6.62%
Maturity date
Dec 15, 2049
HD4401003
Home Depot, Inc. 3.5% 15-SEP-2056Yield to maturity
6.52%
Maturity date
Sep 15, 2056
HD4971789
Home Depot, Inc. 3.35% 15-APR-2050Yield to maturity
6.45%
Maturity date
Apr 15, 2050
HD5386726
Home Depot, Inc. 3.625% 15-APR-2052Yield to maturity
6.43%
Maturity date
Apr 15, 2052
US437076BS0
HOME DEPOT 17/47Yield to maturity
6.23%
Maturity date
Jun 15, 2047
US437076BX9
HOME DEPOT 18/48Yield to maturity
5.98%
Maturity date
Dec 6, 2048
HD4253641
Home Depot, Inc. 4.25% 01-APR-2046Yield to maturity
5.96%
Maturity date
Apr 1, 2046
HD4134022
Home Depot, Inc. 4.4% 15-MAR-2045Yield to maturity
5.92%
Maturity date
Mar 15, 2045
HD5475098
Home Depot, Inc. 4.95% 15-SEP-2052Yield to maturity
5.87%
Maturity date
Sep 15, 2052
See all HD bonds
Curated watchlists where HD is featured.


Frequently Asked Questions
The current price of HD is 373.66 USD — it has increased by 1.67% in the past 24 hours. Watch Home Depot, Inc. (The) stock price performance more closely on the chart.
Depending on the exchange, the stock ticker may vary. For instance, on NYSE exchange Home Depot, Inc. (The) stocks are traded under the ticker HD.
HD stock has fallen by −0.27% compared to the previous week, the month change is a 0.00% rise, over the last year Home Depot, Inc. (The) has showed a 0.99% increase.
We've gathered analysts' opinions on Home Depot, Inc. (The) future price: according to them, HD price has a max estimate of 475.00 USD and a min estimate of 328.00 USD. Watch HD chart and read a more detailed Home Depot, Inc. (The) stock forecast: see what analysts think of Home Depot, Inc. (The) and suggest that you do with its stocks.
HD stock is 2.47% volatile and has beta coefficient of 0.72. Track Home Depot, Inc. (The) stock price on the chart and check out the list of the most volatile stocks — is Home Depot, Inc. (The) there?
Today Home Depot, Inc. (The) has the market capitalization of 371.76 B, it has decreased by −4.26% over the last week.
Yes, you can track Home Depot, Inc. (The) financials in yearly and quarterly reports right on TradingView.
Home Depot, Inc. (The) is going to release the next earnings report on Aug 19, 2025. Keep track of upcoming events with our Earnings Calendar.
HD earnings for the last quarter are 3.56 USD per share, whereas the estimation was 3.60 USD resulting in a −0.99% surprise. The estimated earnings for the next quarter are 4.73 USD per share. See more details about Home Depot, Inc. (The) earnings.
Home Depot, Inc. (The) revenue for the last quarter amounts to 39.86 B USD, despite the estimated figure of 39.30 B USD. In the next quarter, revenue is expected to reach 45.54 B USD.
HD net income for the last quarter is 3.43 B USD, while the quarter before that showed 3.00 B USD of net income which accounts for 14.55% change. Track more Home Depot, Inc. (The) financial stats to get the full picture.
Yes, HD dividends are paid quarterly. The last dividend per share was 2.30 USD. As of today, Dividend Yield (TTM)% is 2.44%. Tracking Home Depot, Inc. (The) dividends might help you take more informed decisions.
Home Depot, Inc. (The) dividend yield was 2.15% in 2024, and payout ratio reached 60.36%. The year before the numbers were 2.35% and 55.32% correspondingly. See high-dividend stocks and find more opportunities for your portfolio.
As of Aug 2, 2025, the company has 470.1 K employees. See our rating of the largest employees — is Home Depot, Inc. (The) on this list?
EBITDA measures a company's operating performance, its growth signifies an improvement in the efficiency of a company. Home Depot, Inc. (The) EBITDA is 25.45 B USD, and current EBITDA margin is 15.82%. See more stats in Home Depot, Inc. (The) financial statements.
Like other stocks, HD shares are traded on stock exchanges, e.g. Nasdaq, Nyse, Euronext, and the easiest way to buy them is through an online stock broker. To do this, you need to open an account and follow a broker's procedures, then start trading. You can trade Home Depot, Inc. (The) stock right from TradingView charts — choose your broker and connect to your account.
Investing in stocks requires a comprehensive research: you should carefully study all the available data, e.g. company's financials, related news, and its technical analysis. So Home Depot, Inc. (The) technincal analysis shows the buy rating today, and its 1 week rating is buy. Since market conditions are prone to changes, it's worth looking a bit further into the future — according to the 1 month rating Home Depot, Inc. (The) stock shows the buy signal. See more of Home Depot, Inc. (The) technicals for a more comprehensive analysis.
If you're still not sure, try looking for inspiration in our curated watchlists.
If you're still not sure, try looking for inspiration in our curated watchlists.