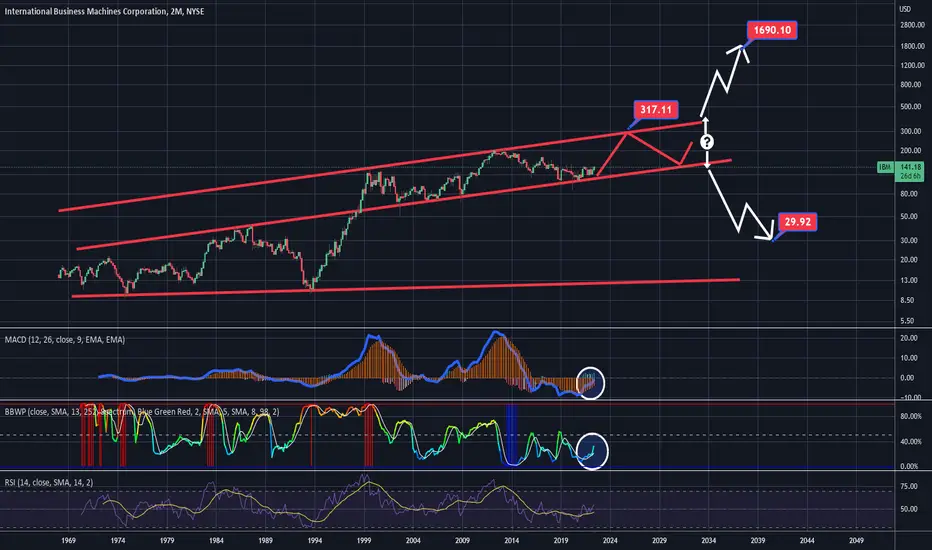
IBM USD NYSE: NEW ALL TIME HIGHS COMING, ASCENDING CHANNEL ??IBM has been in an ascending channel formation for a while now. We've had two touches and I believe there is one more then a correction to the bottom support line before the decision of whether this channel will break to the upside or whether we will break to the downside. Thats years away and we can revisit that then but for now it looks like IBM is about to make a nice move to the upside to new all time highs in the $300 dollar range. The MACD is curled and primed and the BBWP shows volatility is expanding while the RSI is kinda neutral but headed upwards. I think a nice move in the works, and it has probably already started. This is not financial or trading advice, this is just my opinion and what I am doing. Leave a comment below and follow me for more! Thank you and good luck!
IBM trade ideas
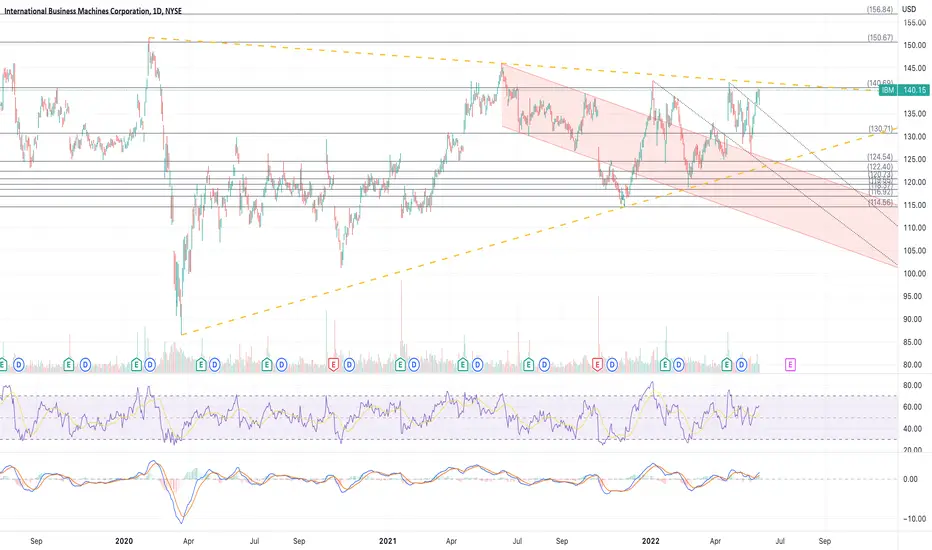
It's a Story of the Tortoise and the Hare (IBM) 💾 As you can see, International Business Machines NYSE:IBM 💾 has been in a very long period of consolidation. Reasons why this big pennant is incredibly bullish beyond the chart.
1. IBM has everything to prove and the recent earnings beat gives support to this emerging idea of "there's no choice but to succeed".
2. It's been ugly in this bear market, but IBM has consistently resisted action to the downside and remained stalwart throughout volatile price action.
3. There is a parallel channel of support starting back in 2000 that IBM retested and held after succumbing to a 9-year downtrending channel of misery.
4. Again, IBM is sitting above a 20-year range , bounced, and it's toying with the idea of breaking out.
5. If you want a solid dividend with tech exposure, this 4.76% dividend yield is generous.
Don't sit on this trade before a break to the upside occurs and you're buying above 150-160. When Big Blue does breakout to the upside, 250-300 is an easy target into 2023-2024 .
PLEASE NOTE : For this trade to work, it is imperative for our friends at Internal Business Machines to produce some headlines and reasons for major Wall Street buyers to step in.
Enjoy!
Zach B.
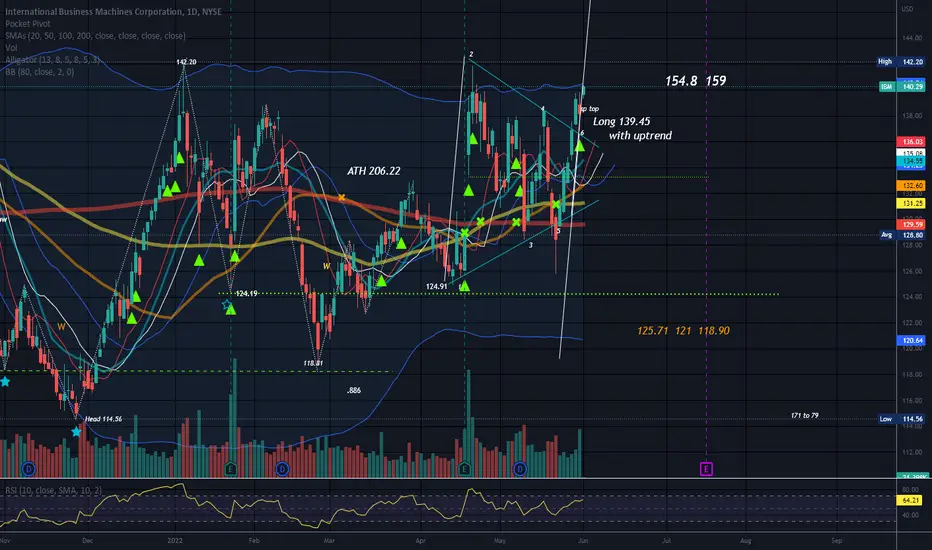
Symmetrical TriangleThis pattern is neutral until a trendline is broken with a trend in that direction.
Yesterday's candle is a spinning top which is a candle of indecision.
IBM had a fairly expansive trading range yesterday, but the spinning top is a candle of indecision. The Harami candle would need confirmation in order to be truly bearish , by another down candle forming today which would then be called a 3 Inside Down if this indeed happens.
The short term moving averages in the gator are looking upward.
No recommendation.


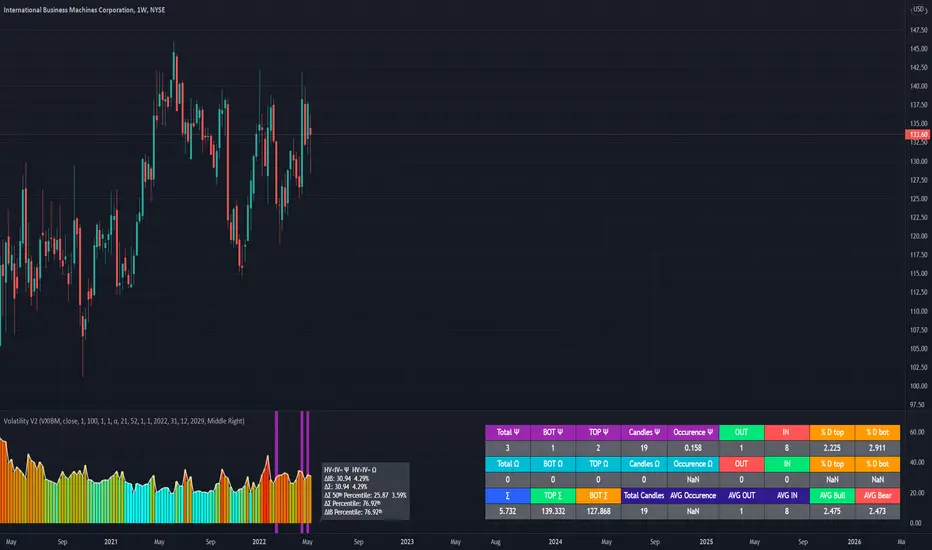
Volatility Weekly Movements Stock, Crypto & Others16-20 MayExpected movements for 16-20 May 2022
SPY/SPX
Current volatility expected for the next week is going to be around 4.52%
So in this case for SPY with almost 90% accuracy the next top and bottom are going to be:
TOP 420
BOT 383
At the same time for SPX/ES with almost 90% accuracy as well, we have the next top and bottom
TOP 4200
BOT 3840
----------------------------------------------------------------------------------------------
QQQ/NDX
Current volatility expected for the next week is going to be around 5.57%
So in this case for QQQ with almost 85% accuracy the next top and bottom are going to be:
TOP 318.75
BOT 285
At the same time for NDX/NQ with almost 85% accuracy as well, we have the next top and bottom
TOP 13100
BOT 11700
----------------------------------------------------------------------------------------------
DIA/ Dow Jones
Current volatility expected for the next week is going to be around 3.36%
So in this case for DIA with almost 90% accuracy the next top and bottom are going to be:
TOP 330
BOT 311
At the same time for MYM/YM with almost 90% accuracy as well, we have the next top and bottom
TOP 33200
BOT 31000
----------------------------------------------------------------------------------------------
Apple
Current volatility expected for the next week is going to be around 5.76%, however we are going to imply 7.2%
So in this case for Apple with almost 90% accuracy the next top and bottom are going to be:
TOP 157.7
BOT 136.5
----------------------------------------------------------------------------------------------
Amazon
Current volatility expected for the next week is going to be around 7.46%, however we are going to imply 9.3%
So in this case for Amazon with almost 80% accuracy the next top and bottom are going to be:
TOP 2471
BOT 2050
----------------------------------------------------------------------------------------------
Google
Current volatility expected for the next week is going to be around 6.01%, however we are going to imply 7.51%
So in this case for Google with almost 90% accuracy the next top and bottom are going to be:
TOP 2495
BOT 2145
----------------------------------------------------------------------------------------------
Russel 2000/ IWM
Current volatility expected for the next week is going to be around 5.22%, however we are going to imply 6.51%
So in this case for Google with almost 95% accuracy the next top and bottom are going to be:
TOP 189.6
BOT 166.44
----------------------------------------------------------------------------------------------
IBM
Current volatility expected for the next week is going to be around 4.29%, however we are going to imply 4.29%
So in this case for IBM with almost 85% accuracy the next top and bottom are going to be:
TOP 139.3
BOT 127.87
----------------------------------------------------------------------------------------------
BITCOIN
Current volatility expected for the next week is going to be around 13.82%, however we are going to imply 15%
So in this case for BITCOIN with almost 95% accuracy the next top and bottom are going to be:
TOP 34450
BOT 25500
----------------------------------------------------------------------------------------------
GOLD
Current volatility expected for the next week is going to be around 2.17%, however we are going to imply 3.25%
So in this case for GOLD with almost 80% accuracy the next top and bottom are going to be:
TOP 1870
BOT 1750
----------------------------------------------------------------------------------------------
EURUSD
Current volatility expected for the next week is going to be around 1.6%, however we are going to imply 1.89%
So in this case for EURUSD with almost 80% accuracy the next top and bottom are going to be:
TOP 1.061
BOT 1.021
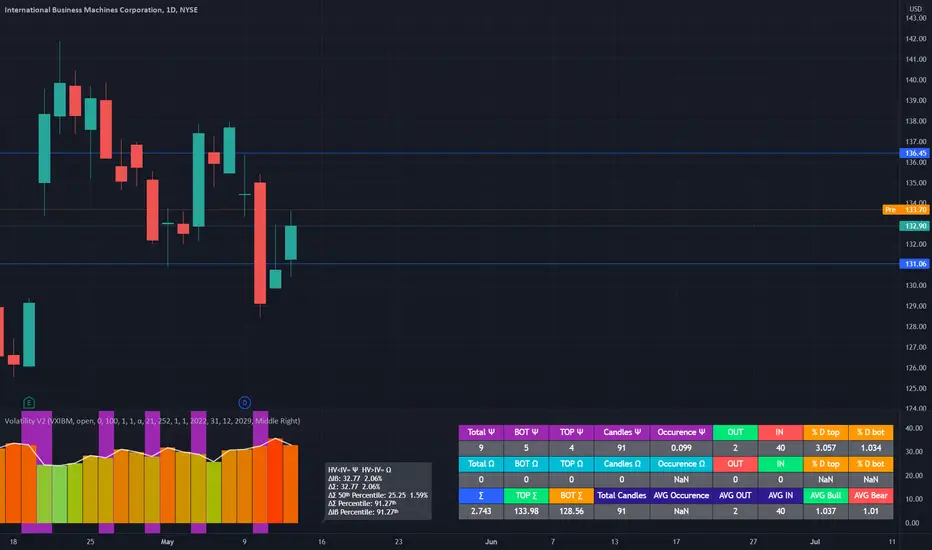
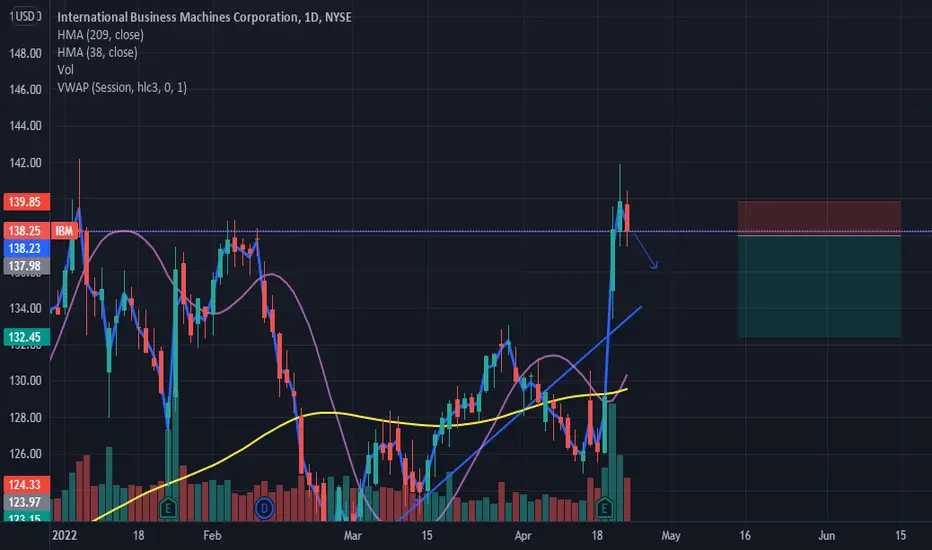
Iron Condor IBM 13 May 2022IBM 13 May 2022
The current implied volatility is at 32.77%/year
So that converted into daily is 2.06%
Since we are in need of the open price for the highest accuracy, I am going to take the current price
which is 133.7 (you can also wait for the opening price and take +- 2.75 points from the open candle value)
So based on that our channel for today is going to be compressed with a probability chance of 90% within
TOP 136.5
BOT 131
From fundamental point, today we have no big volatility news that can impact our asset.
At the same time the current values are expected to be sidemarket/bullish.
IBM to the moonbuddy of mine works here so i had to toss the chart for him, downside mcgee out there

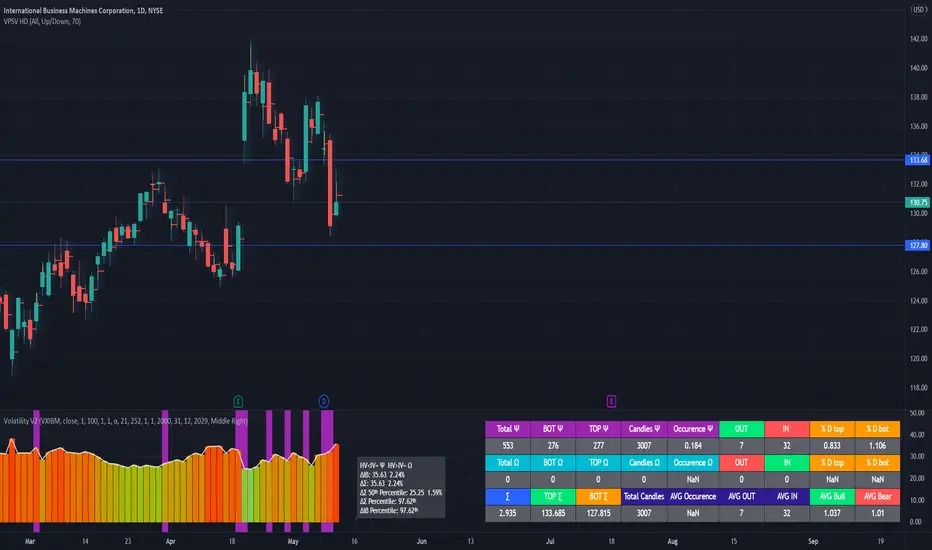
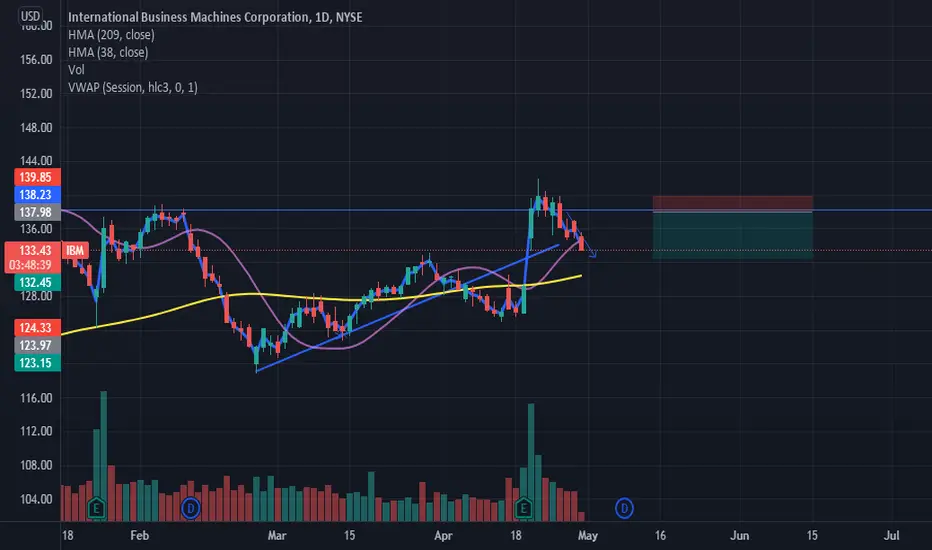
Expected Key Points IBM 12 May 2022IBM 12 May 2022
The current implied volatility is at 35.63%/year
So that converted into daily is 2.24%
The close of yesterday was 130.75
So based on that our channel for today is going to be compressed within
TOP 133.68
BOT 127.8
with a probability chance of 81.6% based on the last 3007 candles
From fundamental point, today we have
PPI and initial jobless claims releases and these mark a huge volatility moment
At the same time the current values are expected to be bearish.
IBM...Holding up like a champ!In the recent meltdown of the NDX, IBM has held up quite well. IBM has taken a longggg time to right its ship, but many signs point to success at last! The street reaction in recent days is telling...while tech was being annihilated, IBM stood its ground reasonably well.
One could expect the naysayers of recent years to be taking note and looking to add.

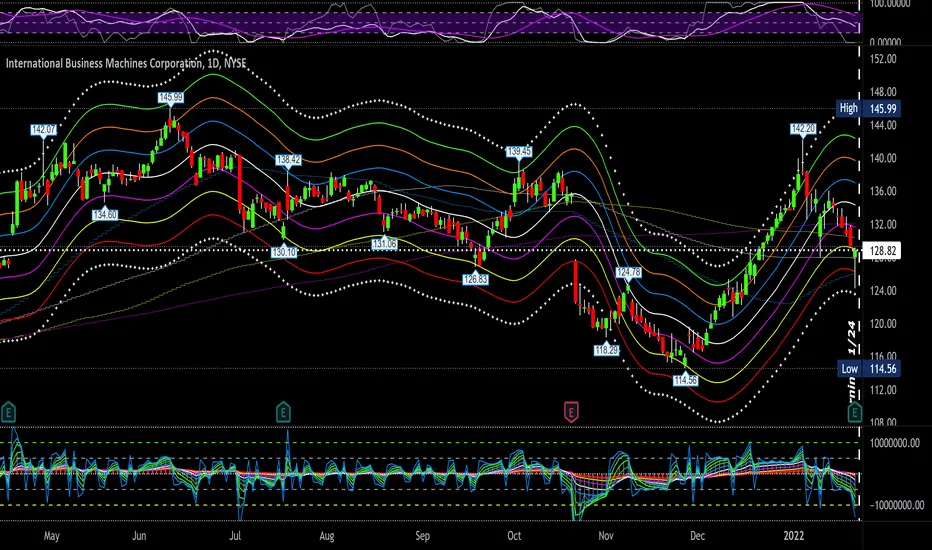
IBM Q4 earningsIBM (IBM) reported Q4 December 2021 earnings of $3.35 per share on revenue of $16.7 billion. The consensus earnings estimate was $3.39 per share on revenue of $17.6 billion. "We increased revenue in the fourth quarter with hybrid cloud adoption driving growth in software and consulting," said Arvind Krishna, IBM CEO. "Our fourth-quarter results give us confidence in our ability to deliver our objectives of sustained mid-single digit revenue growth and strong free cash flow in 2022". On November 3, 2021, IBM completed the separation of Kyndryl. Here's important levels on the 1 day chart:
P/E = 20.29
EPS = $3.35
Div/Yld = 5.09
52 week high = $152.84
52 week low = $114.56
SMA200 = $132.08
SMA150 = $130.39
SMA100 = $127.87
SMA50 = $126.01
breakout = $145.04
R3 = $142.36
R2 = $139.67
R1 = $136.99
pivot = $134.30
S1 = $131.61
S2 = $128.93
S3 = $126.24
breakdown = $123.56
Do your own due diligence, your risk is 100% your responsibility. This is for educational and entertainment purposes only. You win some or you learn some. Consider being charitable with some of your profit to help humankind. Good luck and happy trading friends...
*3x lucky 7s of trading*
7pt Trading compass:
Price action, entry/exit
Volume average/direction
Trend, patterns, momentum
Newsworthy current events
Revenue
Earnings
Balance sheet
7 Common mistakes:
+5% portfolio trades, capital risk management
Beware of analyst's motives
Emotions & Opinions
FOMO : bad timing, the market is ruthless, be shrewd
Lack of planning & discipline
Forgetting restraint
Obdurate repetitive errors, no adaptation
7 Important tools:
Trading View app!, Brokerage UI
Accurate indicators & settings
Wide screen monitor/s
Trading log (pencil & graph paper)
Big, organized desk
Reading books, playing chess
Sorted watch-list
Checkout my indicators:
Fibonacci VIP - volume
Fibonacci MA7 - price
pi RSI - trend momentum
TTC - trend channel
AlertiT - notification
tickerTracker - MFI Oscillator
tradingview.sweetlogin.com
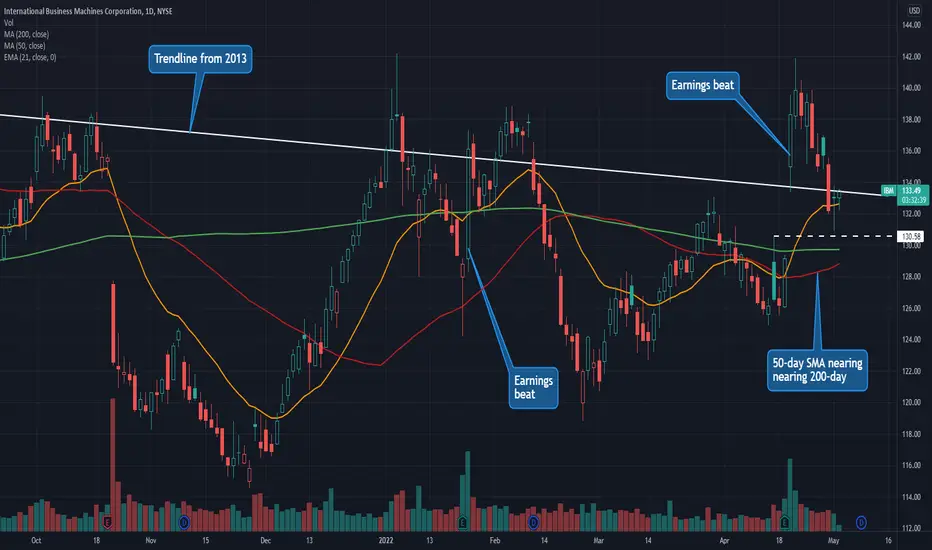
IBM: Another Value Turnaround?International Business Machines has been in a downtrend for almost a decade, but now it could be showing signs of a turn.
The main pattern on today’s chart is the bullish gap following the last quarterly report on April 19. IBM has retraced almost all the jump but remains higher despite a big drop in the broader market at the same time.
The rally established prices above the 50-day simple moving average (SMA). That’s something of a feat that only nine members of the Technology Select Sector SPDR ETF managed to achieve yesterday, according to TradeStation data. (XLK’s portfolio includes 70+ companies.)
Speaking of the 50-day SMA, it’s rising toward the 200-day SMA. Is a “golden cross” coming soon?
Third, the stock’s long decline has produced a falling trendline that IBM has battled since June. Will the current strength result in a breakout through the downtrend?
Finally, consider that IBM jumped last month because management is finally shifting more of its revenue to cloud services. In that way, it may have potential as a “value turnaround,” similar to Oracle a year ago.
TradeStation has, for decades, advanced the trading industry, providing access to stocks, options, futures and cryptocurrencies. See our Overview for more.
Important Information
TradeStation Securities, Inc., TradeStation Crypto, Inc., and TradeStation Technologies, Inc. are each wholly owned subsidiaries of TradeStation Group, Inc., all operating, and providing products and services, under the TradeStation brand and trademark. You Can Trade, Inc. is also a wholly owned subsidiary of TradeStation Group, Inc., operating under its own brand and trademarks. TradeStation Crypto, Inc. offers to self-directed investors and traders cryptocurrency brokerage services. It is neither licensed with the SEC or the CFTC nor is it a Member of NFA. When applying for, or purchasing, accounts, subscriptions, products, and services, it is important that you know which company you will be dealing with. Please click here for further important information explaining what this means.
This content is for informational and educational purposes only. This is not a recommendation regarding any investment or investment strategy. Any opinions expressed herein are those of the author and do not represent the views or opinions of TradeStation or any of its affiliates.
Investing involves risks. Past performance, whether actual or indicated by historical tests of strategies, is no guarantee of future performance or success. There is a possibility that you may sustain a loss equal to or greater than your entire investment regardless of which asset class you trade (equities, options, futures, or digital assets); therefore, you should not invest or risk money that you cannot afford to lose. Before trading any asset class, first read the relevant risk disclosure statements on the Important Documents page, found here: www.tradestation.com .
IBM announced dividend increases this weekInternational Business Machines Corporation is paying out a larger dividend than last year.
IBM Institute for Business Value (IBV) in cooperation with Celonis and Oxford Economics, surveyed almost 500 CSCOs across 10 industries including banking, consumer products, manufacturing and automotive. The study findings indicate that organizations are searching for ways to modernize their supply chains by embracing data and hybrid cloud strategies as well as prioritizing sustainability.
"The Confluence of post-COVID-19 challenges, inflation and supply issues, security, and sustainability has led to the most complex operating environment in modern business. This has forced organizations to rethink and rebuild their supply chains to be more agile, efficient, and sustainable," said Jonathan Wright, Managing Partner, Finance and Supply Chain Transformation, IBM Consulting. "Technology and data-fueled automation and intelligence are key to not only evaluating current workflows and inefficiencies, but in identifying new opportunities as well."
Sustainability over profit.

IBM FORCAST UPDATE : HOLD- on the daily chart : we noticing a strong movement down with descent enough momentum
- personal opinion : the price might a pullback soon so stay elerted for that
- best move : hold . dont buy yet
oh man! what a beautiful set up.. watching this like a hawk IBM on the verge of breaking this 9 year downtrend! sheeesh :o
watching very carefully, i expect a huge breakout once trend resistance breaks..
targeting 184.54-233.56-282.58 long term once we get confirmation !

IBM FORCAST- on the weekly chart :the price strongly rejecting the level
- on the daily chart : even when it broke a good reen candle , we can notice a big attack from the seller that made that wick on the top with a confirmation red candle that the price will fall again
- personal opinion : the price got a chance of 80% of going down but not before doing a little fluctuation on the level
- best move : you can sell now if you want , but it'll be better to wait until today's candle to form
$IBM with a Bullish outlook following its earnings #Stocks The PEAD projected a Bullish outlook for $IBM after a Positive Under reaction following its earnings release placing the stock in drift A with an expected accuracy of 50%.

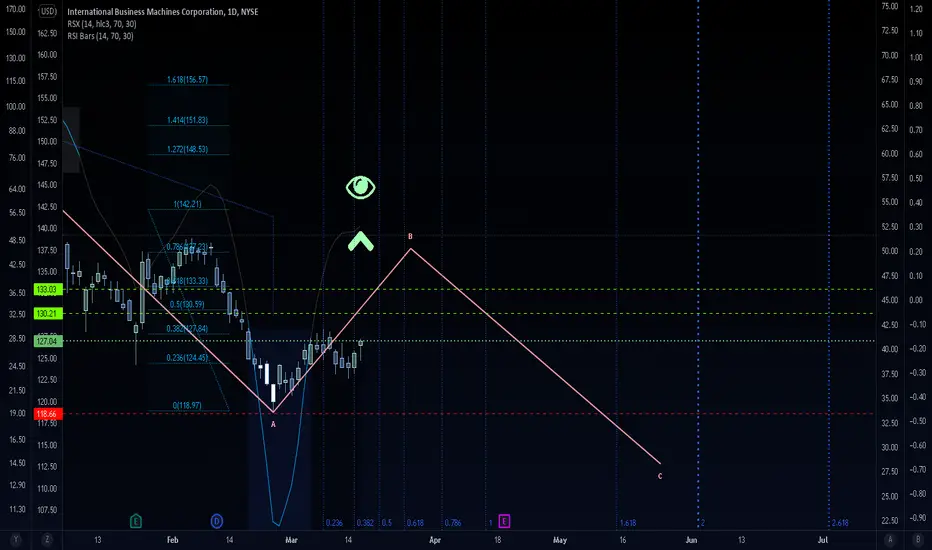
High risk setup for IBM long. IBMShort term outlook only.
Goals 130, 133. Invalidation at 181.
We are not in the business of getting every prediction right, no one ever does and that is not the aim of the game. The Fibonacci targets are highlighted in green with invalidation in red. Fibonacci goals, it is prudent to suggest, are nothing more than mere fractally evident and therefore statistically likely levels that the market will go to. Having said that, the market will always do what it wants and always has a mind of its own. Therefore, none of this is financial advice, so do your own research and rely only on your own analysis. Trading is a true one man sport. Good luck out there and stay safe
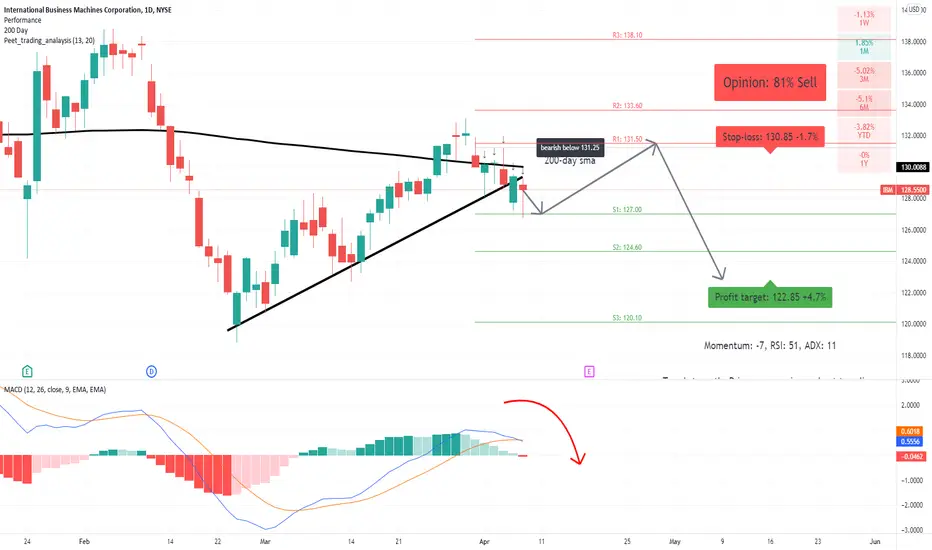
IBM: bearish MACD crossover!MACD bearish crossover applicable.
Crossed below its 200-day sma.
Crossed below some major support.
Below 131.25 supports a bearish trend.
Crossing above this level will negate the bearish trend.
Downside price momentum supports the bearish trend.
RSI leaves enough room for further downside price potential.
IBM WATCHibm is following a stable level that the price respect . best move is to wait until it reachs that level again , wait for it to bounce then go in as buyers

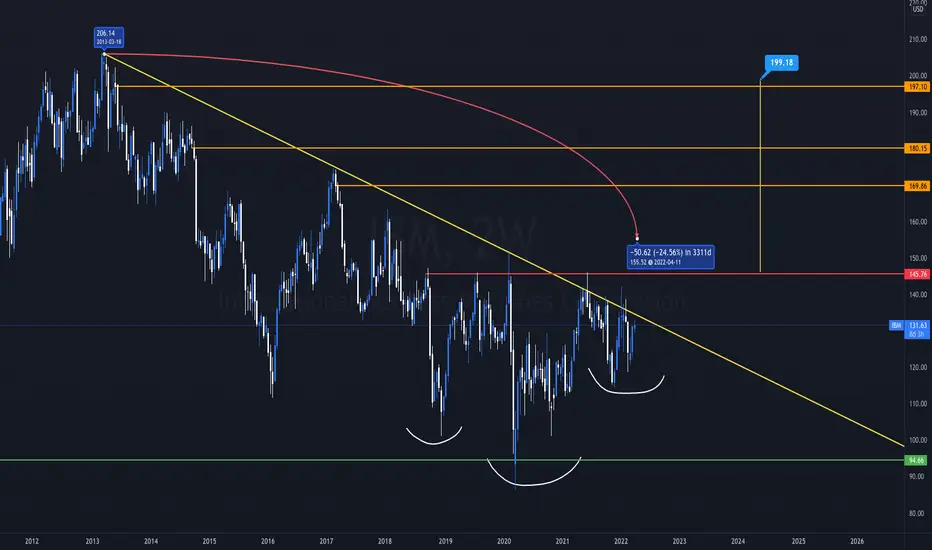
IBM 3000+ Day Downtrend Breaking?$IBM #IBM has been in a HTF downtrend since 2013...3311 days.
Currently retesting trendline and forming a right shoulder of inverse HnS. Weekly close above 145 and PT would be 199.
nPOCs at 169, 180, 197.
——————————————————————————————
Top 10 trading tips:
1. DO NOT FOMO into a trade. Let it come to you. Don’t force it.
2. Find a strategy that works for you and be consistent. Operate like a machine and less like the wind.
3. Let your winners run and cut your losers short.
4. You will not win every trade, but if you are disciplined with great RM you don't need to be right all the time to win!
5. Before you enter a trade, know your target AND your exit strategy.
6. Never use just 1 indicator for confirmation.
7. Set Perimeters and remove emotions from the equation. (stop loss, take profit levels, etc)
8. Don't fight the trend. The trend is your friend.
9. Price Action greater than Indicators/Fractals/MAs
10. Horizontals greater than Diagonals
Please Note:
- This is not financial advice.
- I do not take every trade I post.
- Never trade off of someone else's chart until you DYOR!
IBM: 40 Years ReviewIBM to continue in accumulation phase after a small tick up ($140-150) then buoy right around $110 before next bull run (2-3+ yr).
