LC EARNINGS PLAY – STRIKE WHILE IT'S HOT!**
🚨 **LC EARNINGS PLAY – STRIKE WHILE IT'S HOT!** 🚨
📅 **Earnings Season Heat Check: LC | Jul 29**
💰 **Positioning for a Post-Earnings POP!**
---
🔥 **The Setup:**
LC’s earnings momentum is real –
📈 TTM Rev Growth: **+13.1%**
💹 EPS Surprise Rate: **150% avg**
📊 75% Beat Rate History
💵 Analyst Consensus: **Strong Buy (1.8/5)**
---
📉 **Technical Tailwind:**
✅ Price above 20D + 200D MA
✅ RSI: **60.07** – room to run
📈 Volume Spike: **+61% above 10-day avg**
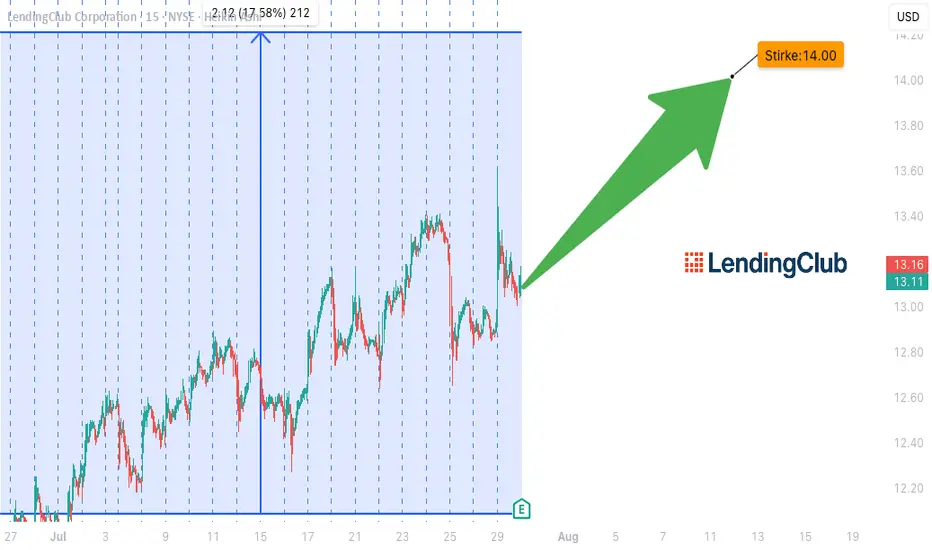
🚀 Options flow targeting **\$14 CALLS** w/ OI: **864** / Vol: **737**
---
📌 **TRADE IDEA**
🎯 Buy: **\$14.00 Call @ \$0.70**
📆 Exp: **Aug 15, 2025**
🎯 Target: **\$2.10** (Risk/Reward = 1:3)
🛑 Stop: **\$0.35**
---
⚠️ **Earnings Risk:** IV crush real.
🎯 Exit within 2 hours **post-EPS** if no move.
Macro tailwinds + financial sector rotation = 🚀 fuel.
**Beta = 2.45** → Big move potential incoming!
---
🧠 Confidence Level: **75%**
⏰ Timing: Pre-Earnings Close
🧾 Model-Driven Strategy | No Hype, Just Edge.
---
💥 Let’s ride the LC earnings wave – \$15+ in sight! 💥
\#LendingClub #LC #EarningsPlay #OptionsTrading #TradingView #StocksToWatch #CallOption #Fintech #SwingTrade #EarningsHustle #BullishSetup #IVCrush #EarningsGamma #ShortTermTrade
LC trade ideas
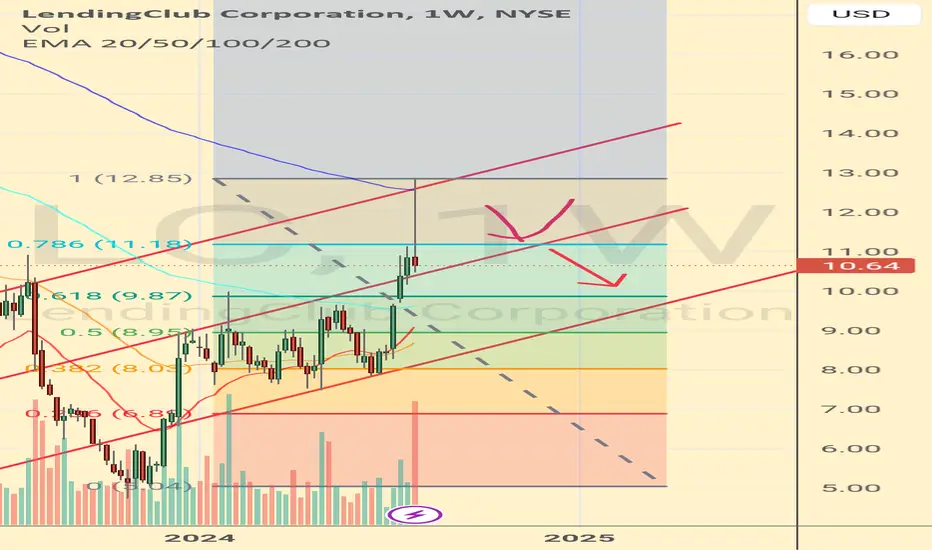
LC 1W: When the Market Spreads Its WingsOn the weekly chart of LendingClub (LC) , a “golden cross” has formed - the MA50 crossing above the MA200 from below, confirming a medium-term trend shift in favor of buyers. The current price of 15.30 is trading within the 0.705–0.79 Fibonacci zone (14.54–15.32), which now acts as a key support after the breakout. Structurally, the asset is moving within a broadening ascending channel, suggesting potential for increased volatility and range expansion.
Technically, the market shows strength: the upward impulse was accompanied by an abnormal spike in volume, both MA50 and MA200 are positioned below the price, and the nearest resistance is at 17.26 (1.0 Fibonacci level). A breakout above this area opens the way to the 1.618 extension at 22.95–23.02. The scenario is invalidated if the price closes below 12.65, which would pull it back into the previous descending structure.
Fundamentally, LendingClub benefits from easing tensions in the US debt market and moderate growth in consumer lending. Positive earnings momentum and the resilience of its business model add further confidence to the bulls.
Tactical plan: as long as the price holds above 14.54–15.32, the medium-term growth scenario remains valid, targeting 17.26 and 23.02. The optimal entry would come after confirming the support hold and spotting a local reversal candlestick pattern on the daily timeframe.
As they say, a golden cross isn’t just an indicator - it’s a first-class ticket to the trend league. Just make sure you don’t miss the flight.

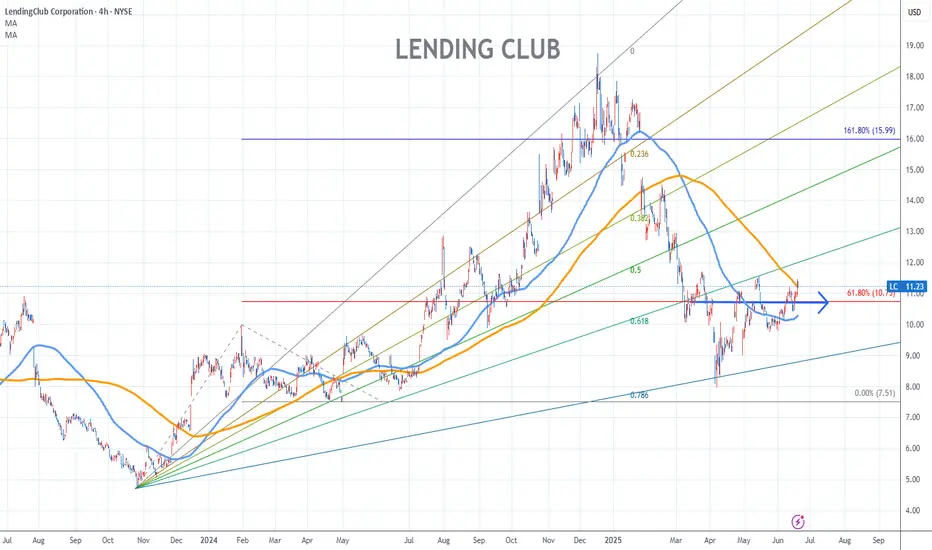
Lending Club Stock Chart Fibonacci Analysis 061825Trading Idea
1) Find a FIBO slingshot
2) Check FIBO 61.80% level
3) Entry Point > 10.7/61.80%
Chart time frame:C
A) 15 min(1W-3M)
B) 1 hr(3M-6M)
C) 4 hr(6M-1year)
D) 1 day(1-3years)
Stock progress:A
A) Keep rising over 61.80% resistance
B) 61.80% resistance
C) 61.80% support
D) Hit the bottom
E) Hit the top
Stocks rise as they rise from support and fall from resistance. Our goal is to find a low support point and enter. It can be referred to as buying at the pullback point. The pullback point can be found with a Fibonacci extension of 61.80%. This is a step to find entry level. 1) Find a triangle (Fibonacci Speed Fan Line) that connects the high (resistance) and low (support) points of the stock in progress, where it is continuously expressed as a Slingshot, 2) and create a Fibonacci extension level for the first rising wave from the start point of slingshot pattern.
When the current price goes over 61.80% level , that can be a good entry point, especially if the SMA 100 and 200 curves are gathered together at 61.80%, it is a very good entry point.
As a great help, tradingview provides these Fibonacci speed fan lines and extension levels with ease. So if you use the Fibonacci fan line, the extension level, and the SMA 100/200 curve well, you can find an entry point for the stock market. At least you have to enter at this low point to avoid trading failure, and if you are skilled at entering this low point, with fibonacci6180 technique, your reading skill to chart will be greatly improved.
If you want to do day trading, please set the time frame to 5 minutes or 15 minutes, and you will see many of the low point of rising stocks.
If want to prefer long term range trading, you can set the time frame to 1 hr or 1 day.
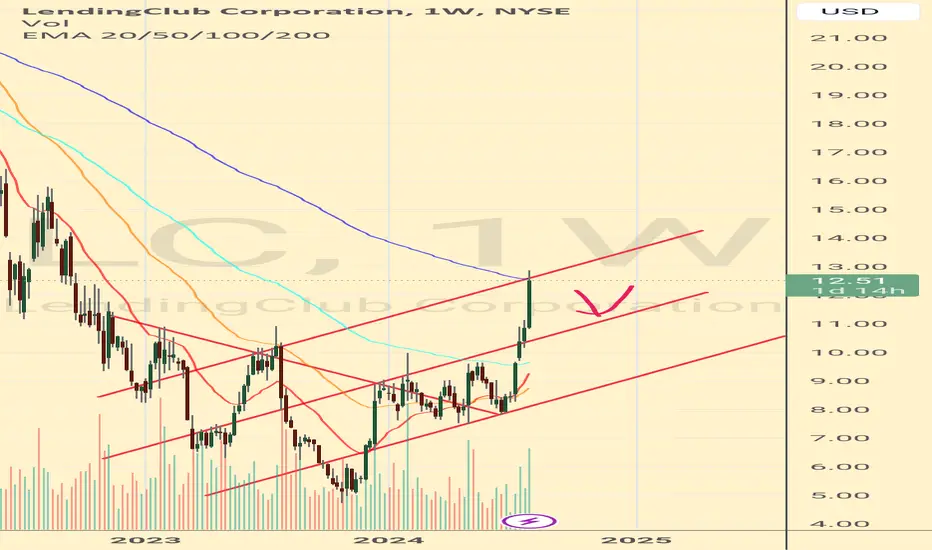
$LC is a logical buy in this economyKey Stats:
P/E Ratio: 35.22
Market Cap: $1.86B
Next Earnings Date: Feb 25, 2025
Technical Reasons:
The stock is riding a strong uptrend. It’s currently trading above both its 50-day and 200-day moving averages, signalling sustained bullish momentum.
RSI momentum is bullish but not overbought, leaving room for further upside.
Recent price action shows strong support, with multiple higher lows. This suggests buyers are stepping in aggressively.
Fundamental Reasons:
Institutional ownership is robust, indicating strong confidence from big players. BTIG recently raised its price target, reinforcing bullish sentiment.
LendingClub’s balance sheet is solid with minimal Debt-to-Equity, giving it flexibility to navigate economic uncertainty.
Its forward P/E and PEG ratio suggest it’s reasonably valued relative to its growth prospects.
Potential Paths to Profit:
Option 1 (Low Risk): Buy shares outright at current levels and hold for target.
Option 2 (Moderate Risk): Buy $17 call options expiring in March 2025 for leveraged exposure to the upside.
Option 3 (High Risk): Execute a bull call spread by buying the $16 strike and selling the $18 strike for a defined-risk strategy.
Disclaimer:
We are not a brokerage or investment firm. We do not offer financial advice or investment advice and/or signals. This is not certified financial education. We offer access to the daily thought process of an individual and his experiences. We do not offer refunds. All sales are final.

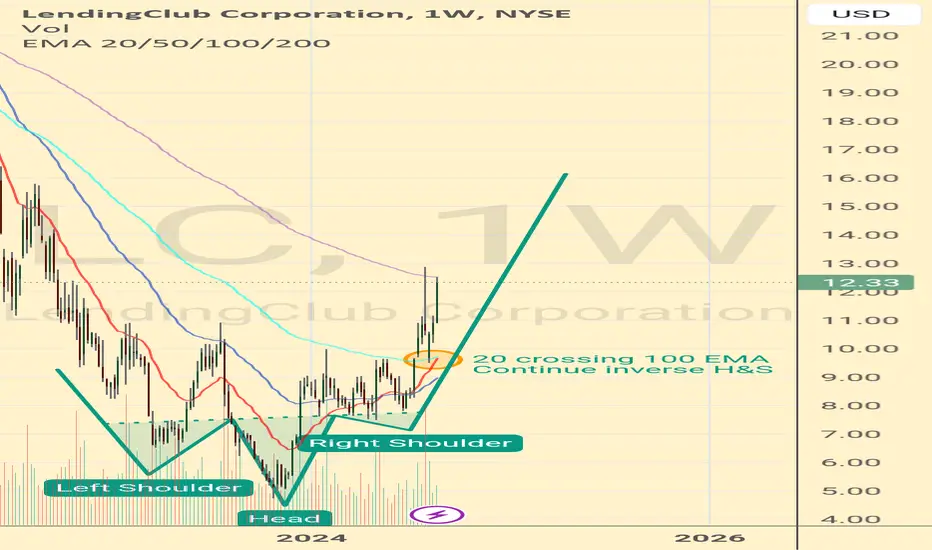
Hello LC club holdersMoving averages 20 avoid to cross the 100
Continuation of inverse Head and shoulders pattern
Bought in low. Holding for long termThank you for the opportunity! Bought in for long term until it doubles or 3x.
Minor correction for LendingclubOverheated! Expecting a correction. Before this inverse head and shoulders pattern resumes.
Good opportunity to buy in soon.
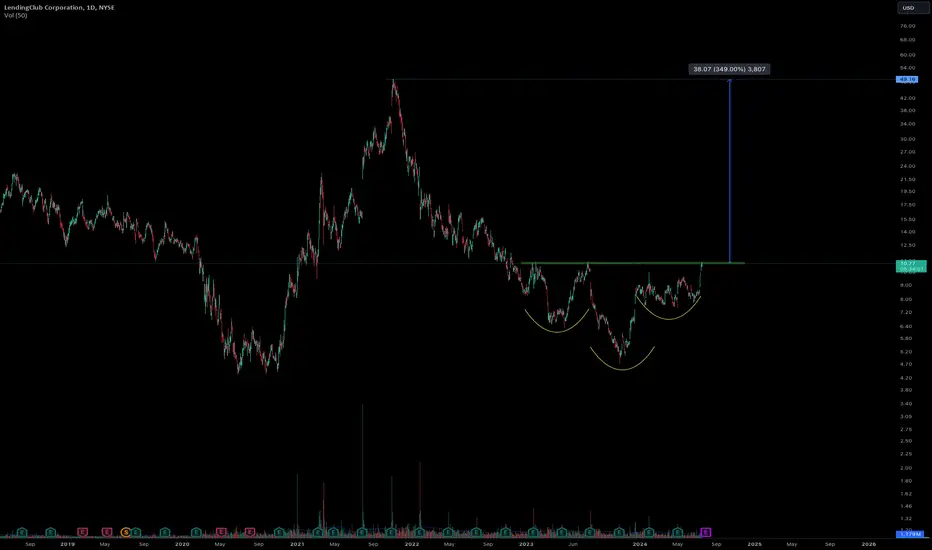
LCA nice inverted head and shoulders, price exactly at the neckline
+350% upside to test the high. Rate sensitive
Trade safe
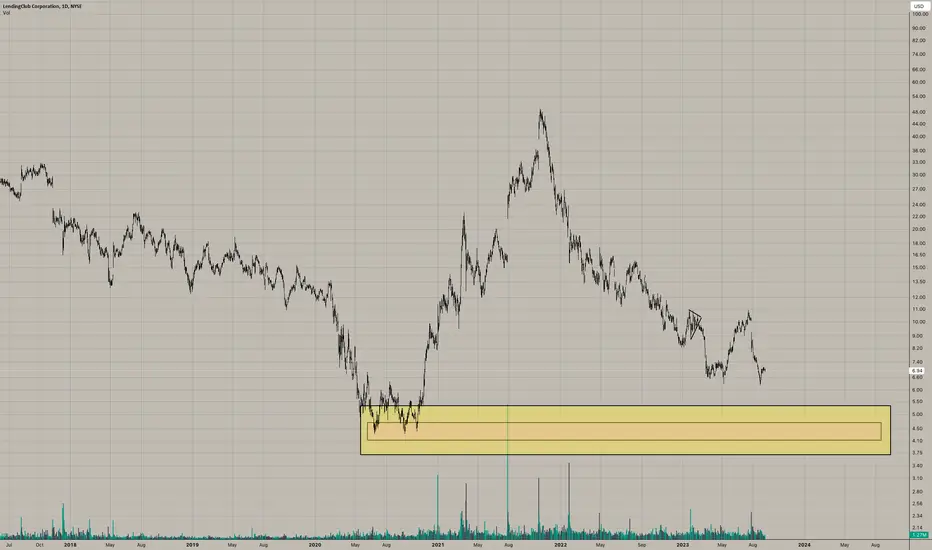
Load up at around $5LC isn't done falling. It has to drop to he demand zone at around $4-$5. Given the massive put wall at $5 I don't think we'll see $4, price should bottom out slightly above $5.
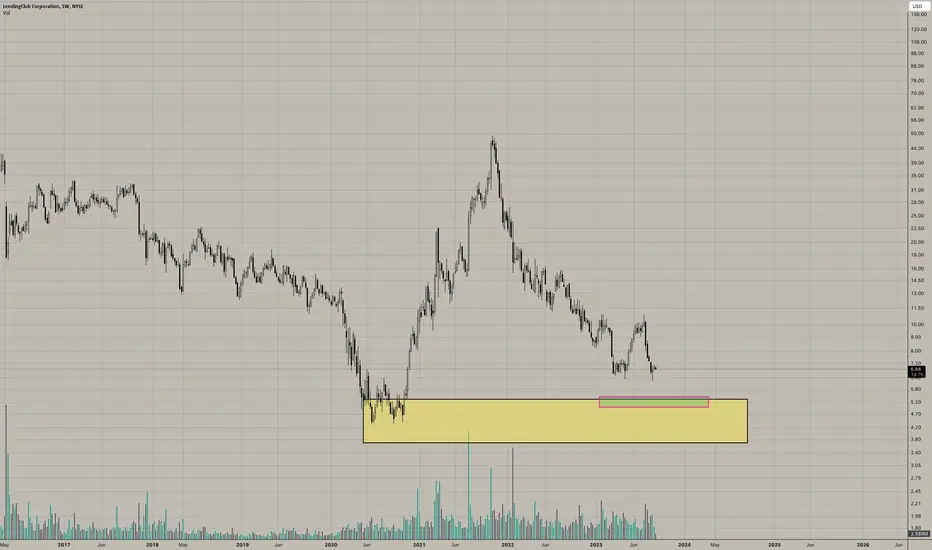
Put wall is at $5Given the OI , there's a put wall at $5, so there's still room left for another drop, from there we should start moving towards $8.
$LC, rate hike sensitive and bullish pattern formationLending Club beaten down since inception. The chart is almost similar to NASDAQ:UPST and recently broken a downtrend. It is forming a cup and handle, but i believe it still not confirmed. It has a book value as of Q1 23 of $11, so i believe it is trading at a discount. I am considering having a starter position and scale in after the fed meeting.
looking forward for any opinions and please do your research.

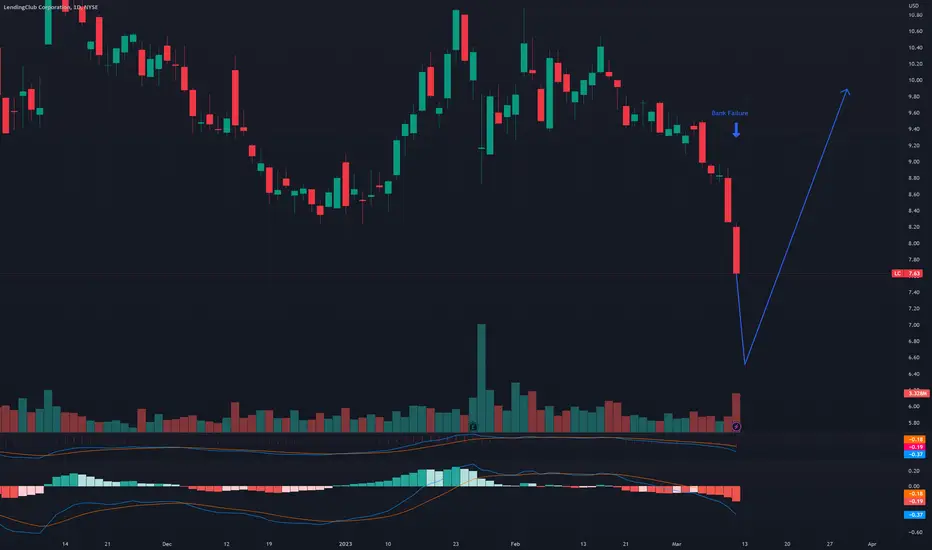
Overreaction to bank failure might cause discountLC seems to be a pretty good buy already with a P/E of 3.17 and a P/B of 0.82
with the news that the bank failed that had only $21M of the $8B that makes up LC some might panic and sell their shares that have already been declining.
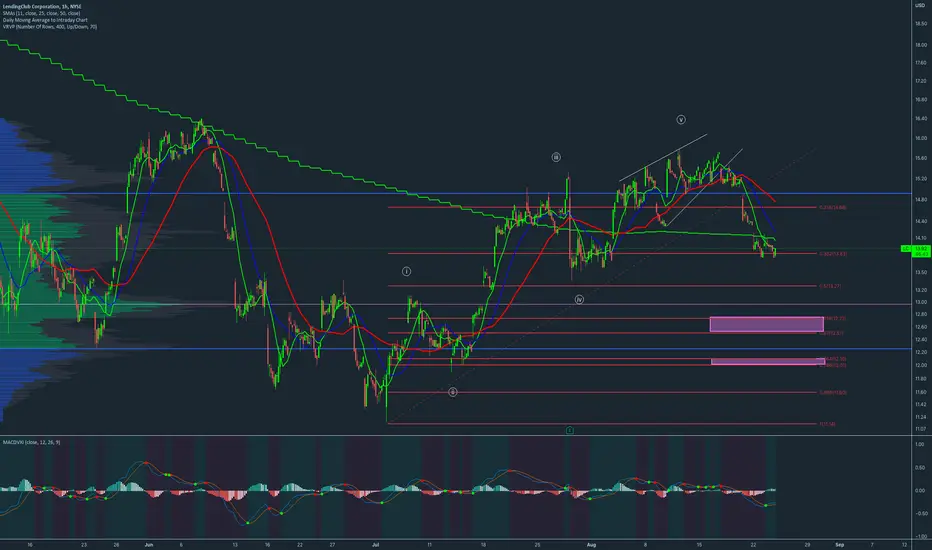
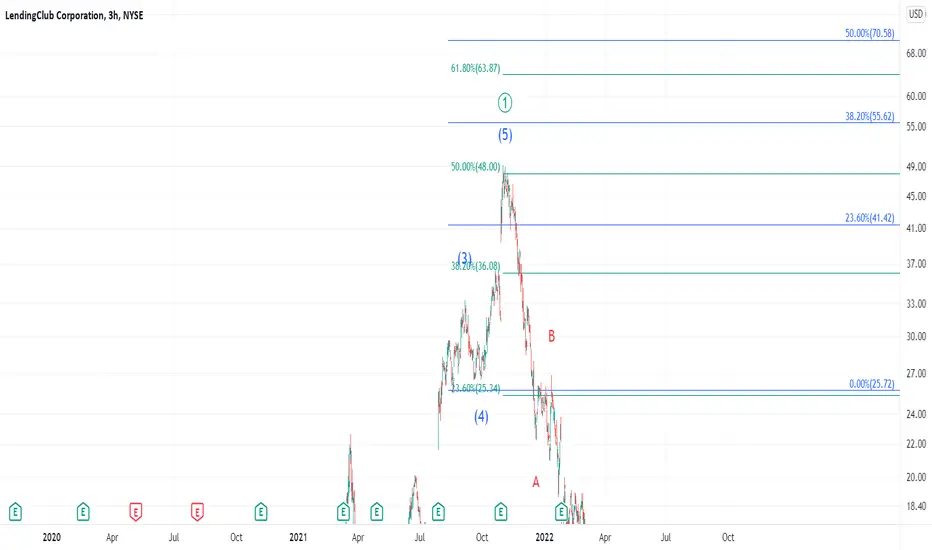
LendingClub bearish short term outlook As you can see on the hourly chart Lendingclub has completed a solid 5 wave structure to the upside, with wave 5 being an ending diagonal.
Now it's time to retrace. Lendingclub should retrace to the 61.8% - 67% Fib at around $12.75 - $12.50. This Fib pocket is also the area where the most activity occured, according to the volume profile.
If this level doesn't hold. we should drop slightly below our value area to around $12.20.
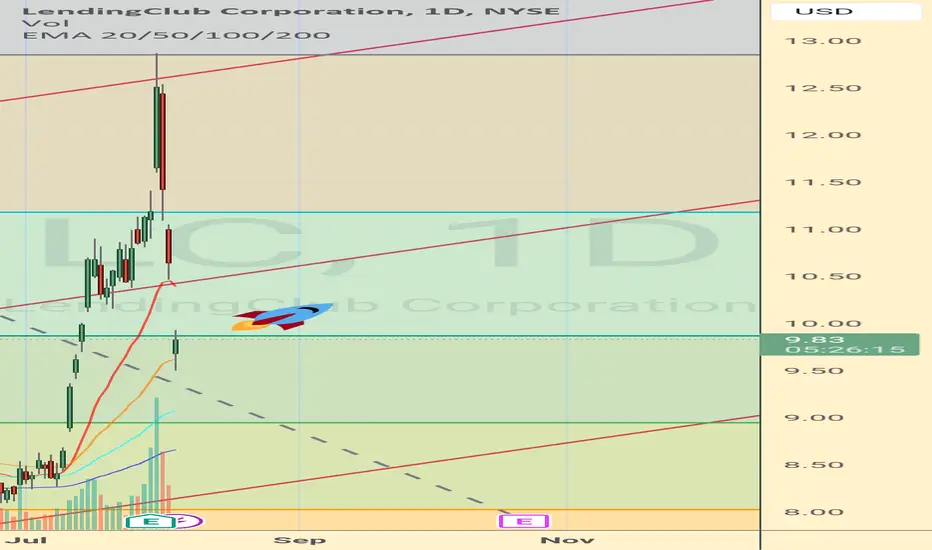
$LC with a bullish outlook and price target of $28-$30$LC has found support at the 61.8% of the preceding wave count on July first. From here on I see it climbing all the way up to $28-$30. Our first intermediate target should be somewhere around $19-$20.

LC - breaking outLC just had strong earnings but was shy due to overall market conditions.
Not surprising that as soon as we got relative relief about inflation, it moved higher( already 8% while I'm writing it)
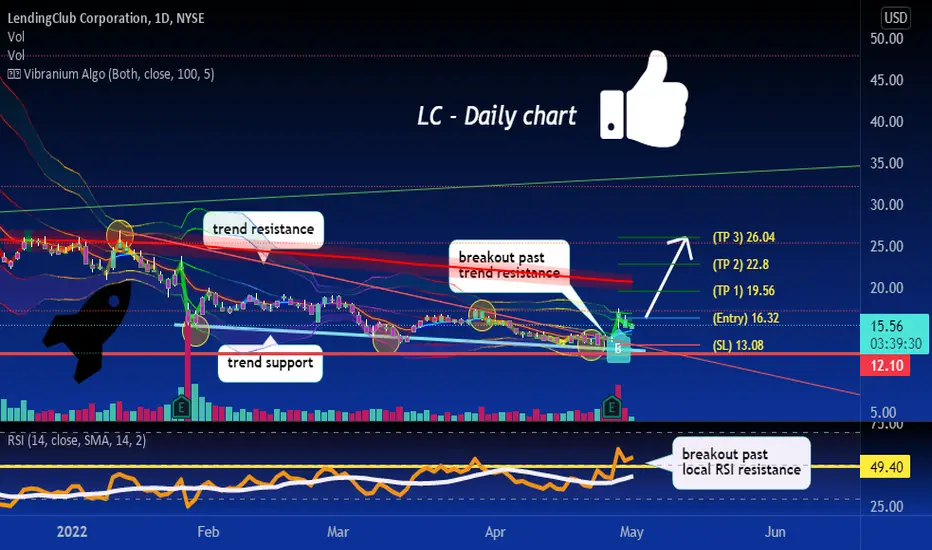
First target 20 (200 ma resistance)

looking for more rally here after trend breakoutLC fresh breakout past trend/rsi resistance zone, could see a rally to 19.5-22.8-26 now
needs to reclaim support ! ✅LC will continue to the downside if it fails to break back above trend resistance/local support.
target 19.34 if we break back above 15.55 though.
like and follow for more!❤❤


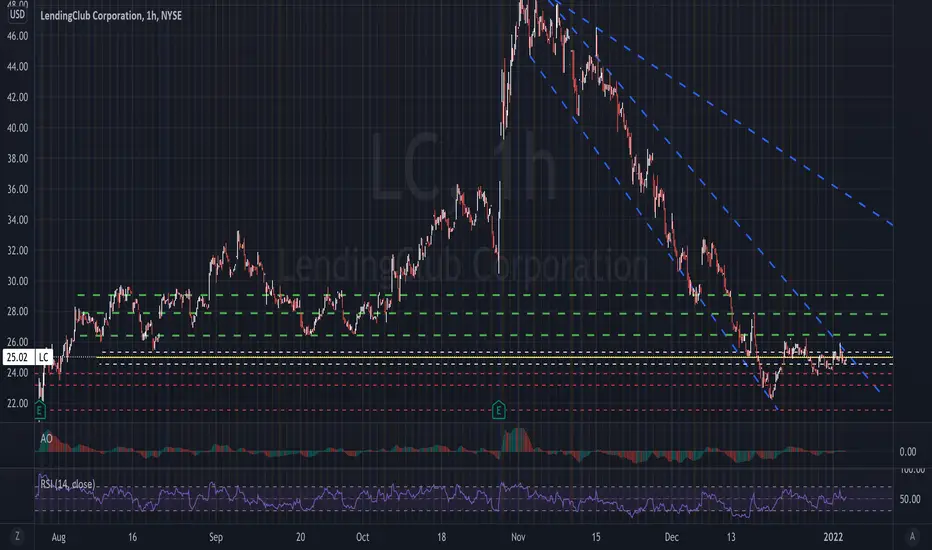
the nasty downtrend broke!🔥 time for a little rally lc finally breaking this extreme downtrend, currently making a higher low when comparing it to the most previous low.
this is a good sign for longs. If we bounce off this higher low my price targets are 29.35-36 for early 2022.
like and follow for more 💘

$LC mean reversion long idea, offers 100% upside. Strong growth.$LC mean reversion long after the stock has drifted significantly lower, company is under valued here and doing triple digit earnings. Expecting buyers to show up around this demand level and shorts to cover causing a nice snapback in price.
