$OKLO – Back to the Moneymaker: HTF + C&H Combo at $77.50NYSE:OKLO – Back to the Moneymaker: HTF + C&H Combo at $77.50
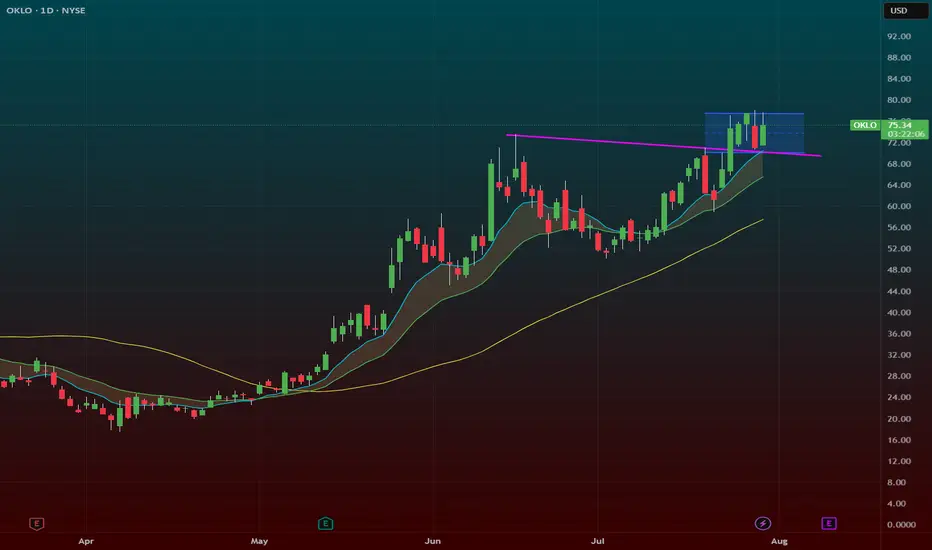
Back to my bread and butter setup — NYSE:OKLO is setting up again, and it’s 🔥. We’ve got a high tight flag forming right above the 9 EMA, and to sweeten the deal, there’s a cup and handle structure layered in too.
🔹 The Setup:
After a strong breakout, NYSE:OKLO has spent the past week consolidating tightly above the 9 EMA.
Price action is coiled, volume has dried up — exactly what I want to see before a power move.
This is a high tight flag + cup and handle combo, one of my favorite high-probability setups.
🔹 Trigger Level:
Watching the $77.50 breakout zone — that’s the line in the sand. If you get a good intraday dip to support you can pre-empt the play i like to often scale in a half in anticipation if the market is in a runup phase
A clean push through with volume, and this can speed up fast.
🔹 My Trade Plan:
1️⃣ Entry: Either starter near 9 EMA support or confirmation on breakout over $77.50.
2️⃣ Stop: Under the 9 EMA — no reason to stay if it breaks down.
3️⃣ Target: Measured move extension if it clears $77.50 with juice.
Why I Love This Setup:
HTF + C&H = momentum fuel
This name has already proven itself — we’ve made money here before
The structure, the consolidation, and the setup are all textbook
OKLO trade ideas
OKLO C&HC&H chart pattern in a hot sector seeing support by the US Government. The intersection of energy, uranium, nuclear, utilities, data centers, the grid, AI, etc.
SL = LL at 58
OKLO 75.50RECOMMENDED STRATEGIC ENTRIES
Bullish: (75.60/80.00) Target (82.00–83.00) Stop (74.50)
Bearish: (72.40/70.00) Target (71.00–70.00) Stop (74.00)
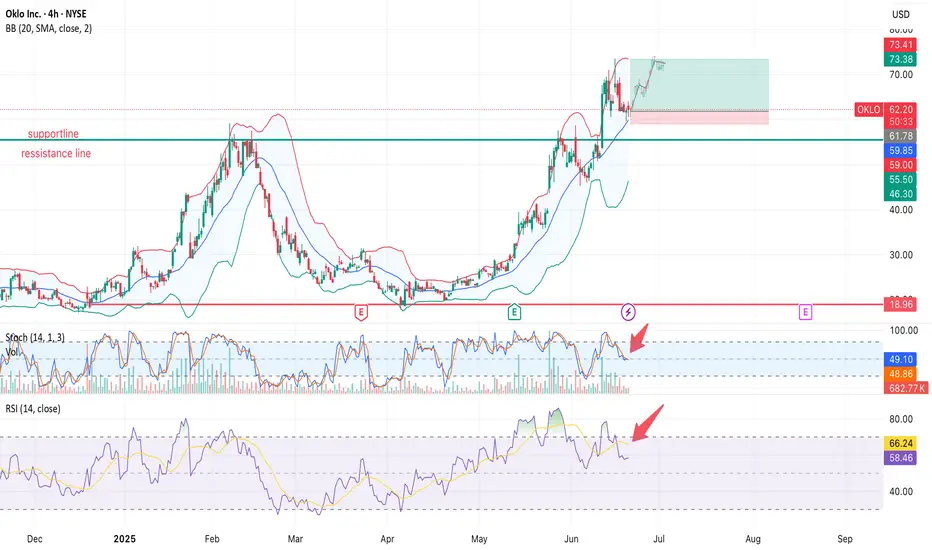
OKLO ($OKLO) — Consolidation After a Powerful Run: What’s Next?NYSE:OKLO After a +180% breakout earlier this year and a strong return above the $60–62 resistance zone, OKLO is now consolidating under $73.40. Let’s break it down 👇🔍 Technical Overview (4H chart)
• Breakout above key resistance ($59–62), which now acts as support.
• Price is consolidating in a bullish flag formation.
• Bollinger Bands are tightening — potential volatility ahead.
• Volume declining — market in a wait-and-see mode.
📉 Indicators:
• Stochastic Oscillator: curling down from 80+ zone — short-term exhaustion
• RSI: rolling over below 60 after peaking near 70 — momentum is fading
• Price Action: Still holding above support, but losing bullish strength📰 What drove the price to $55 (Feb 2025)?
• ✅ Wedbush sets $55 target, highlighting AI data center energy demand
• ✅ Q1 earnings: net loss narrowed to $0.07/share from $4.79/share
• ✅ Regulatory optimism: fast-track support for SMRs by U.S. government
📉 The following correction was largely technical (profit-taking after overextension).🚀 Why OKLO surged again to $73+ (June 2025)
• 🛡 $100M DoD contract for Aurora reactor on Eielson Air Force Base
• 💸 New capital round ($460M), backed by Bill Gates and Nvidia Ventures
• 📈 Wedbush upgrades target to $75, citing defense + AI synergy📐 What I’m Watching Now
Price remains above key support (~$61.8), but both RSI and Stoch are weakening. A breakdown below support may open the way for deeper correction — but volume will be the trigger.
📌 Break above $73.40 on strong volume could mark the next bullish leg
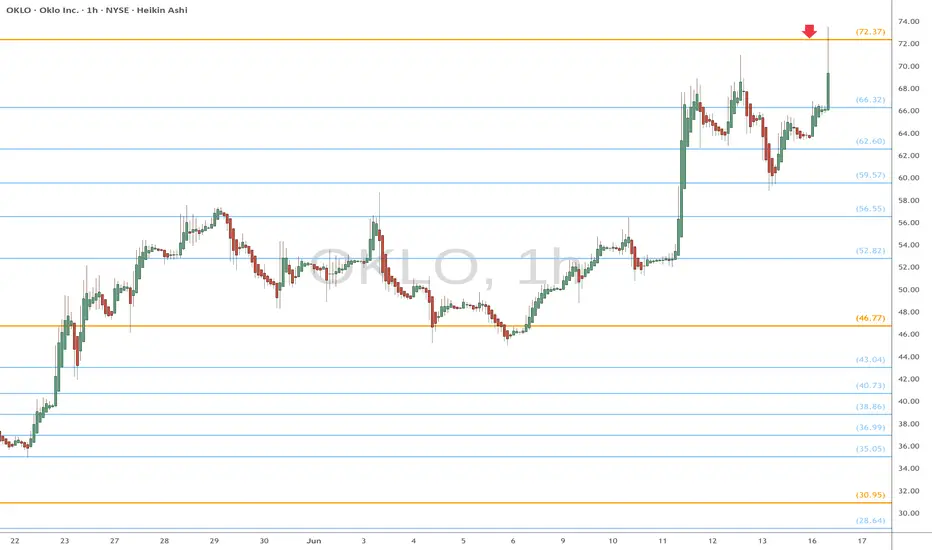
OKLO eyes on $72.37: Golden Genesis fib that should give a DIP OKLO going nuclear into a Golden Genesis fib at $72.37
Looking for a Dip-to-Fib or a Break-n-Retest new longs.
Most likely a few orbits around this ultra-high gravity fib.
.
Last Plot caught break and sister Genesis Fib
.
Older Plot caught the perfect Dip-to-Fib buys:
.
Hit the BOOST and FOLLOW to catch more such EXACT trades.
=======================================================
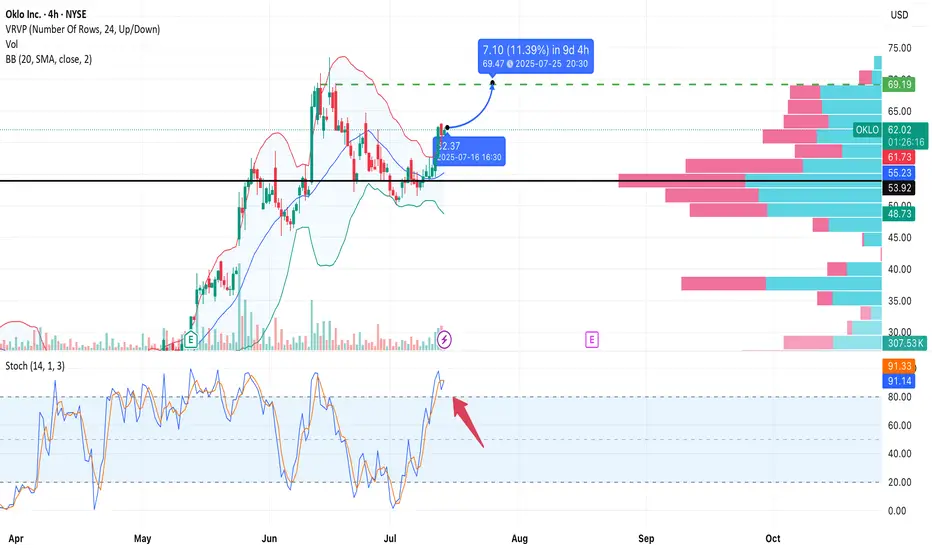
OKLO – Upside Potential Ahead of EarningsNYSE:OKLO
Type: Swing/positional
Timeframe: 4H
Style: No stop-loss, technically driven
Target: 69.50
Risk: Moderate (earnings volatility risk)
Overview:
Oklo is forming a bullish continuation pattern after consolidating above the 55.00 support area.
The price has broken above the Bollinger Band basis and reclaimed the 61.78 resistance zone.
Stochastic shows overbought conditions, but the trend remains strong.
The volume profile reveals a low-resistance zone up to ~69.50, offering clean air for upward momentum.
Entry Zone:
• Entry near 62.2 (market price)
• The setup remains valid while price stays above ~61.5
• Upcoming earnings (July 19) may act as a catalyst
Target:
• Take Profit: 69.50
Expected move: +11%
No Stop? Then Watch Closely:
Soft invalidation if price breaks below 59.50 (4H close)
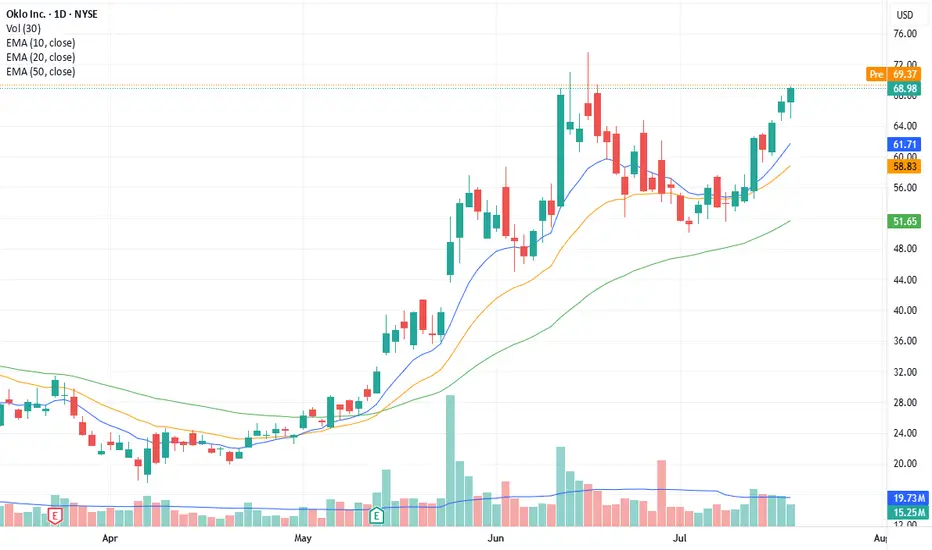
oklo break out The 14 jul 25 was probably a day to buy. of course hind sight is 20/20 but the chart gave a good indication to enter. risk wise maybe the reward we looking for is too much.
alternatively, there have also been places where the chart looked good but in the end getting stopped out. so likely that this one is a missed chance but not one that is perversely glaring
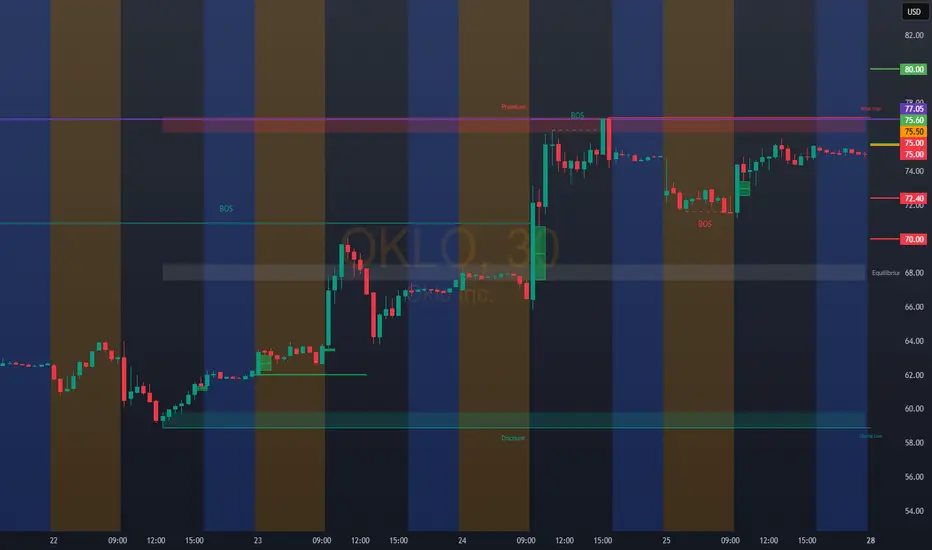
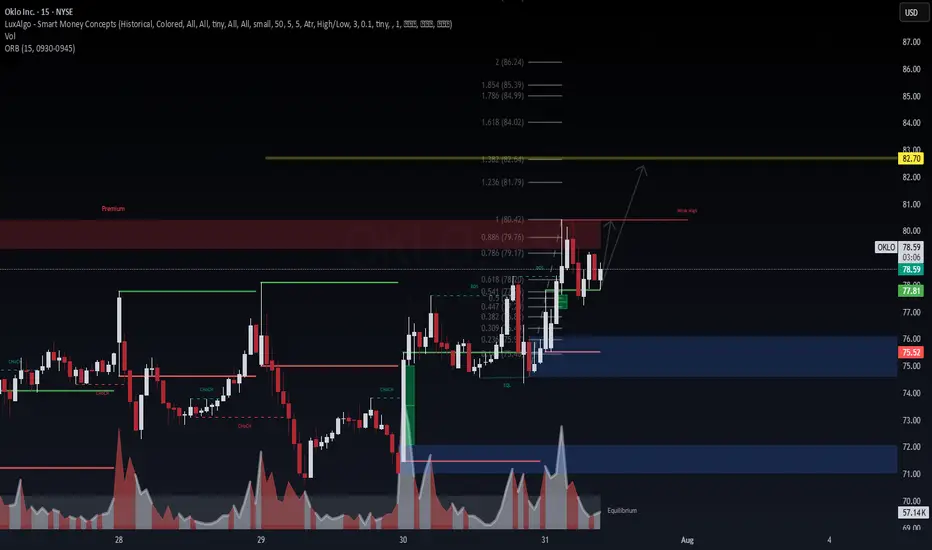
OKLO (NYSE: $OKLO) – 15M Liquidity Hunt & Expansion Path📈 OKLO (NYSE: NYSE:OKLO ) – 15M Liquidity Hunt & Expansion Path
Chart by WaverVanir International LLC | VolanX Protocol
We're observing clean SMC structure post-CHOCH (Change of Character) with strong demand defense off equilibrium. Price just reclaimed the ORB high (77.81) and is consolidating under a weak high near $80.42, inside a premium rejection block.
🧠 Institutional Narrative
CHoCH → BOS confirms bullish intent post-manipulation.
Volume spike on reclaim of fair value gap shows potential absorption and re-accumulation.
Fib confluence at 0.618 (78.20) with bullish rejection and internal liquidity grab.
🎯 Targets
Minor: 80.42 (weak high), expect sweep.
Primary: 82.70 (Fib 1.382 extension) aligns with prior premium inefficiency.
Aggressive: 84.99–86.24 (1.786–2.0 extension zone).
🛡️ Invalidation
Break below ORB low 75.52 would invalidate current bullish structure short term.
🧭 VolanX Signal
This aligns with a Liquidity Expansion Playbook inside the institutional price delivery model. Watching for continuation if $80.42 sweep holds with strength.
Disclaimer: For educational purposes only. Not financial advice. #VolanX #SMC #Trading #OKLO #Stocks #LiquidityHunt #MarketStructure #InstitutionalTrading
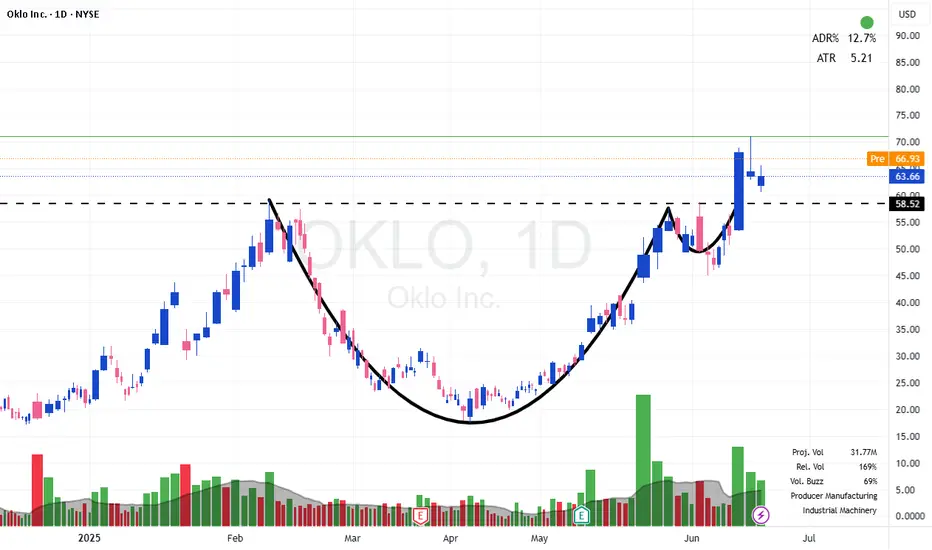
Cup and Handle, another leg up?Oklo is looking pretty decent, waiting for a break to confirm this momentum trade
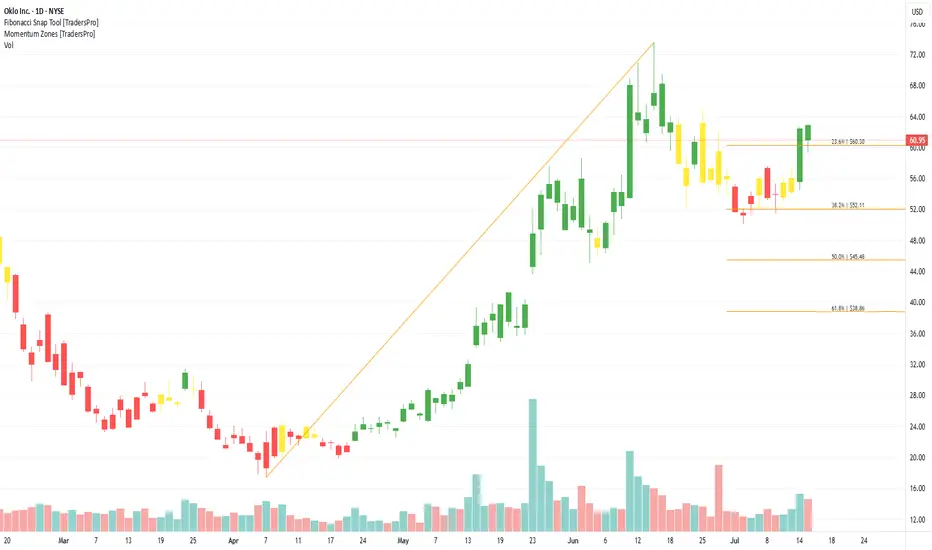
Oklo Inc. (OKLO) Builds the Future of Nuclear EnergyOklo Inc. (OKLO) is a nuclear energy company developing compact, advanced fission power plants designed to deliver clean, reliable energy with minimal waste. Its flagship design, the Aurora powerhouse, aims to provide scalable power solutions for remote locations, data centers, and industrial applications. Oklo’s growth is driven by the global push for zero-carbon energy, innovation in small modular reactors, and rising interest in alternative baseload power sources.
On the chart, a confirmation bar with rising volume signals strong buying momentum. The price has entered the momentum zone by breaking above the .236 Fibonacci level. A trailing stop can be set just below that level using the Fibonacci snap tool to protect gains while staying exposed to further upside.
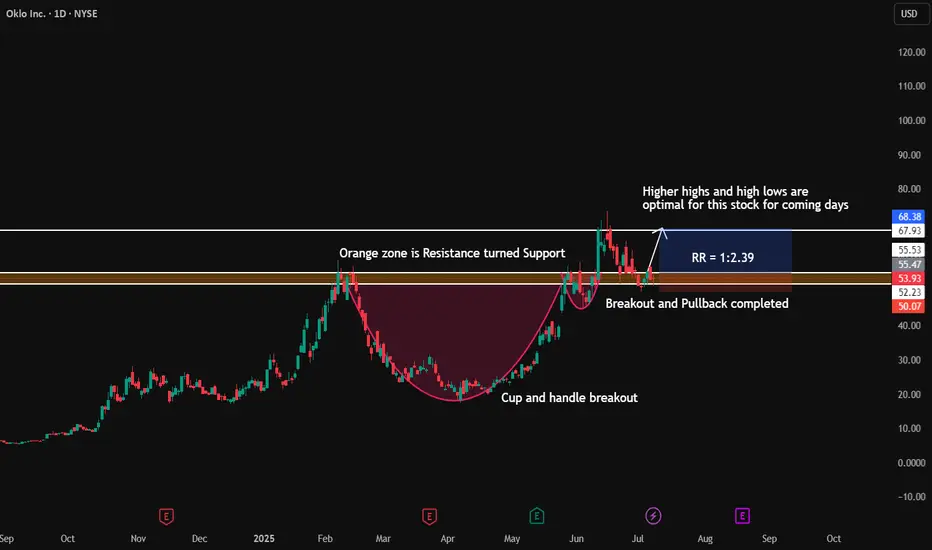
OKLO nice technicals.OKLO after a wonderful cup and handle setup, it has given a breakout and now a pullback to which for me is a great entry position.
Risk aversion.
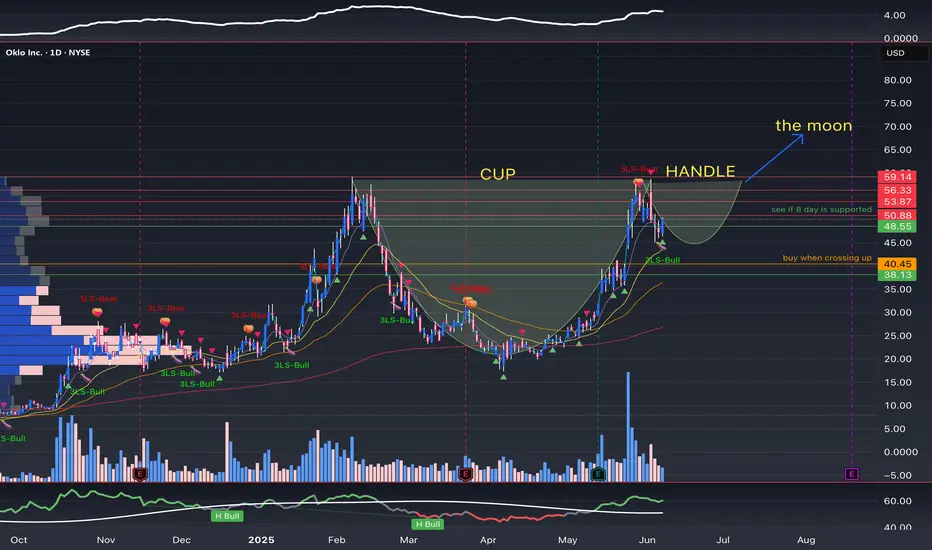
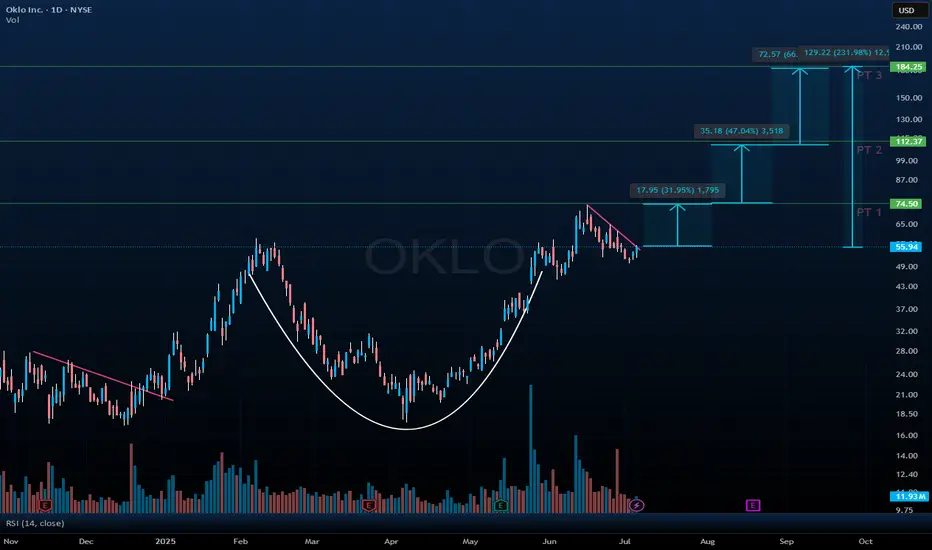
$OKLO Bullish SetupNYSE:OKLO is setting up a textbook cup and handle breakout on the daily chart, signaling a potential continuation of its impressive uptrend. The cup formed over several months with a rounded bottom, showing healthy accumulation behavior and strong trend structure. Following that, the handle is shaping into a clean bull flag — marked by a tightening price range with declining volume, which is typical before a breakout. The breakout trigger is a daily close above the $56–57 range, which would confirm the pattern and likely lead to strong momentum upside.
Using measured move logic and Fibonacci extensions from the cup’s depth and the flag’s structure, I’ve mapped out four staged price targets: $74.50, $108.00, and $184.25. These represent a potential upside of 31%, 91%, and 233% respectively if the pattern plays out fully. RSI is curling up around 54, which hints at building momentum — a breakout above 60 would further confirm strength. The Lum3n Trend Cloud remains bullish, the 8/21 EMAs are intact, and the 200-day moving average is far below current price levels, supporting the long-term bullish bias.
If NYSE:OKLO can break out of this handle with conviction and strong volume, the setup offers one of the cleanest technical continuation patterns on the chart right now. Watch closely for a breakout and hold above the $56 neckline — confirmation here could kick off the next powerful leg higher.
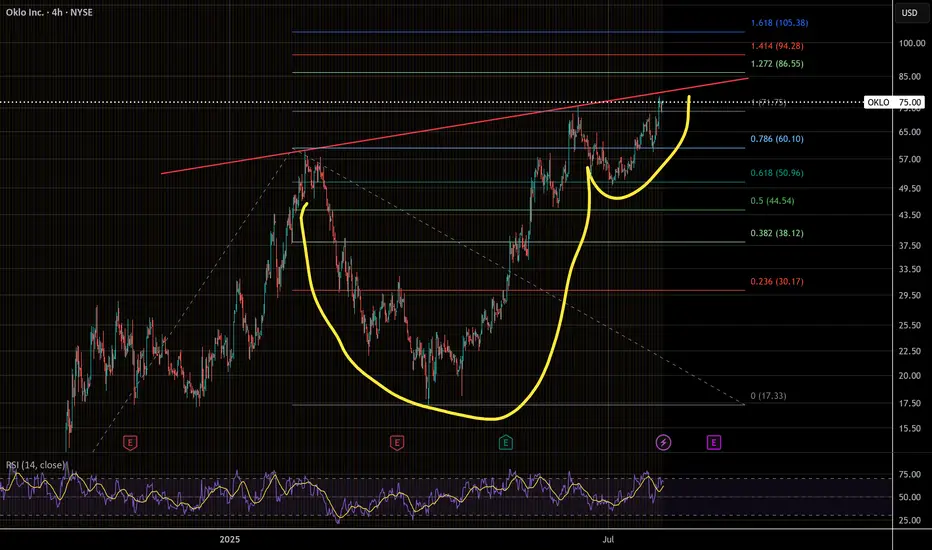
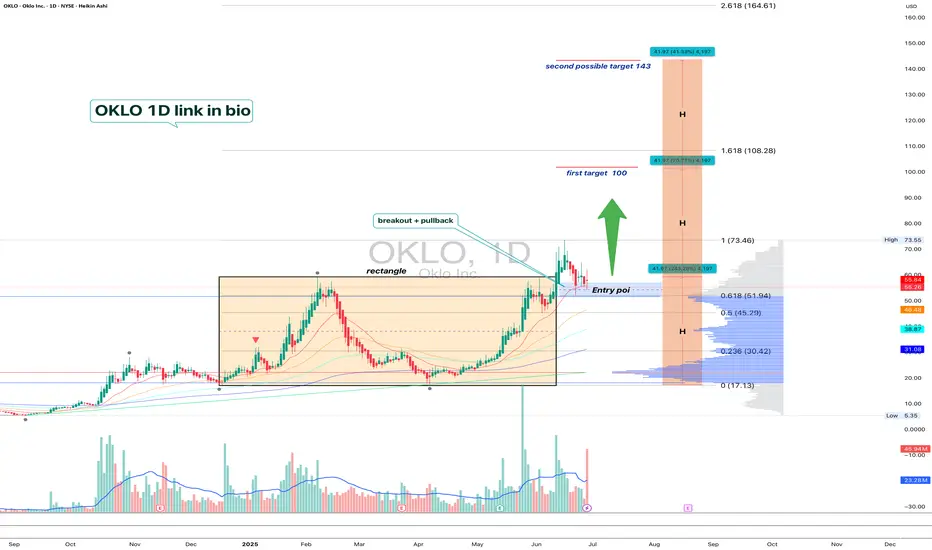
OKLO — when nuclear momentum breaks resistanceSince late 2024, OKLO had been consolidating inside a clear rectangle between $17 and $59. The breakout from this long-term range triggered a new bullish impulse. The price has since returned to retest the breakout zone, now aligned with the 0.618 Fibonacci retracement at $51.94. The retest has completed, and the price is bouncing upward, confirming buyer interest.
Technically, the trend remains firmly bullish. The price closed above the prior range, EMAs are aligned below, and the volume spike during breakout supports genuine demand. The volume profile shows a clean path toward $100, indicating limited resistance ahead. The structure suggests a controlled rally rather than an exhausted move.
Fundamentally, OKLO is a next-generation SMR (Small Modular Reactor) company focused on delivering compact, efficient nuclear power solutions. Following its public debut via SPAC and recent capital injection, OKLO is transitioning from development to implementation. Institutional interest is holding strong, and the broader move toward decarbonization and energy independence places the company in a strategic position.
Target levels:
— First target: $100 — psychological and technical resistance
— Second target: $143 — projected from prior range breakout
OKLO isn’t just another clean energy ticker — it’s a quiet disruptor with nuclear potential. The chart broke out. The volume confirmed. Now it’s time to see if the market follows through.
$OKLO Gann Chart The symmetry on this Gann chart is superb! It would be healthy if it consolidated a bit to gear up for it's next leg.
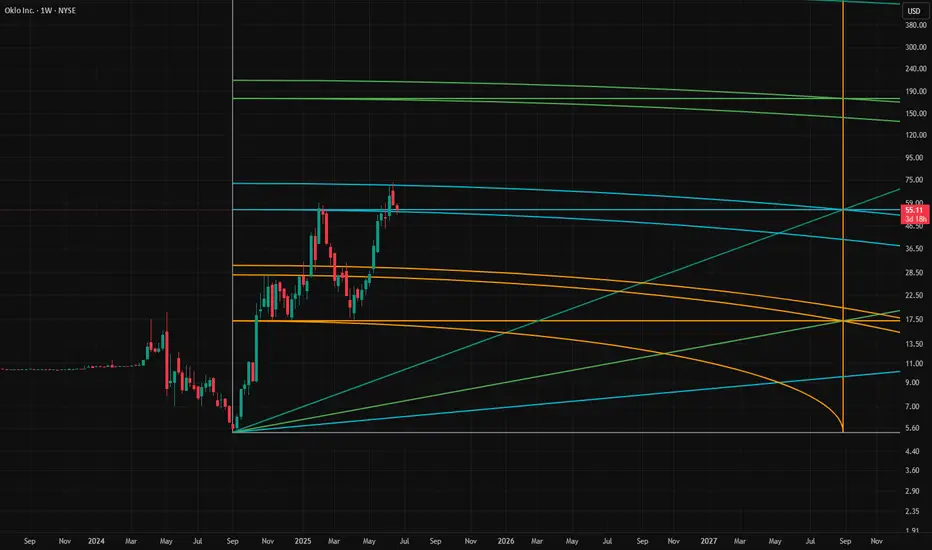
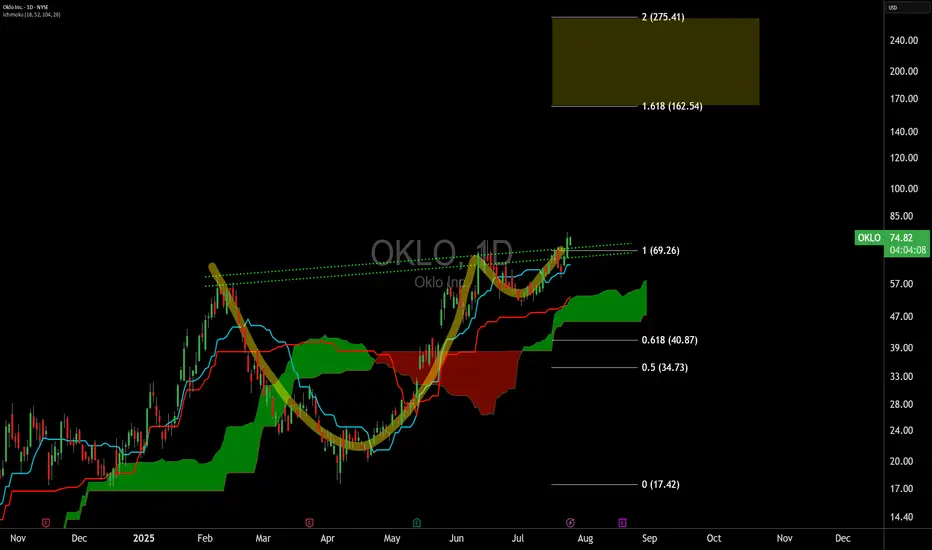
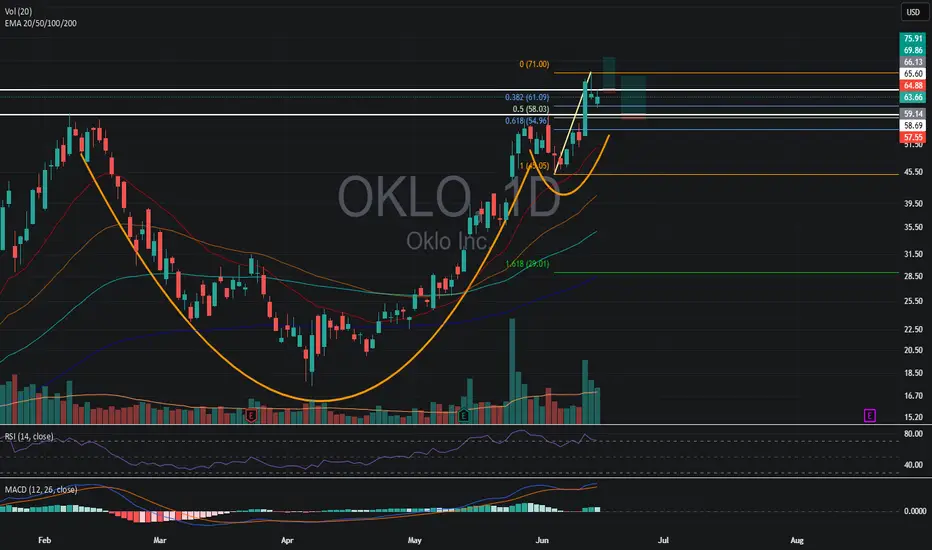
OKLO - Momentum PlayOKLO finding support at ATH levels. Tight stop and letting it ride to recent high for target 1 and 1.618 fib level for target 2.
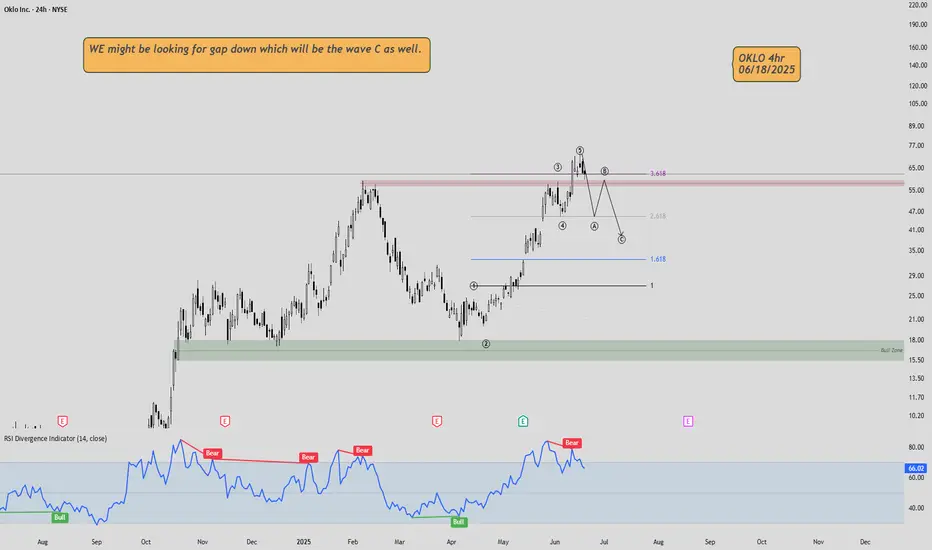
OKLO!!! Elliot wave AnalysisOklo has surged rapidly—Wave 5 appears complete, and we seem to be entering a correction with Wave A, targeting the $45 area. Let’s see how it reacts...
OKLO Perfect Cup Handle PatternOKLO was a perfect setup, 59 USD, but I think its stil a nice buy point. It will most likely continue its way. %10 stop is still okay to put in my opinion.
OKLO on WatchLooking to go long over previous days high ($65.60) or buy a pullback around $59.
Why:
Cup and handle chart pattern
High volume green days
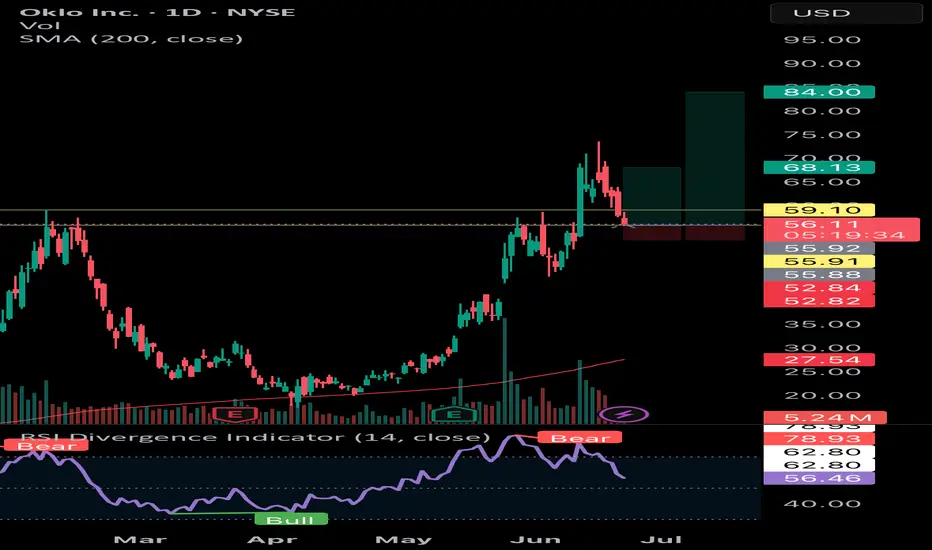
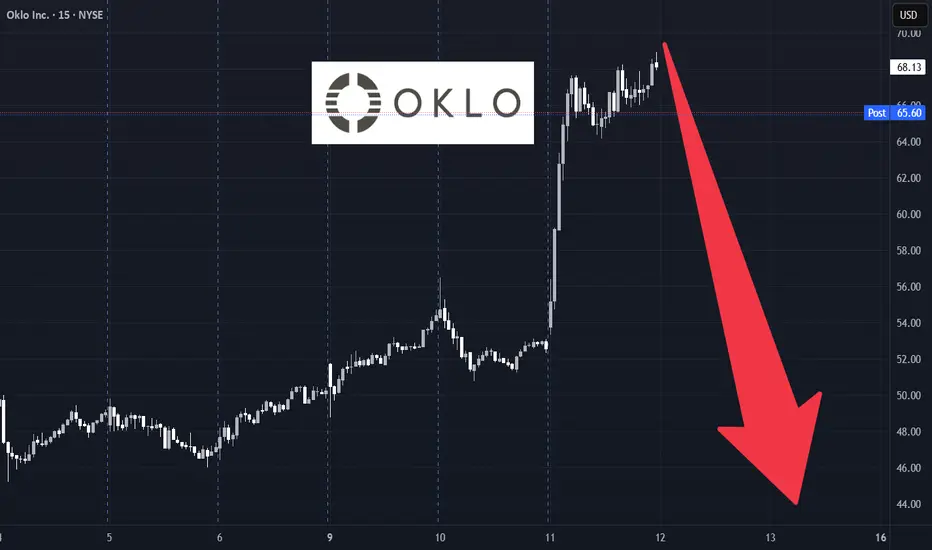
OKLO Weekly Options Setup – Bearish Reversal Risk (2025-06-11)📉 OKLO Weekly Options Setup – Bearish Reversal Risk (2025-06-11)
Ticker: NYSE:OKLO | Bias: 🟥 Moderately Bearish
Entry Timing: Market Open | Confidence: 65%
🔍 Model Consensus Overview
📍 Price: ~$68.00
📈 Short-Term (5-min): Strong momentum, price > EMAs, MACD bullish
📉 Daily Chart: RSI >80, price well above upper Bollinger Band → overbought
📉 News Catalyst: $400M dilutive equity offering adds downside pressure
⚠️ Max Pain: $58 → suggests strong gravitational pull
🧠 AI Model Breakdown
Bullish View (Grok/xAI):
• Strong intraday chart → targets $70+
• Recommends call play (low conviction)
Bearish View (Llama, Gemini, DeepSeek):
• Daily exhaustion + dilution = reversal setup
• Favor puts (strikes around $61) for downside exposure
• Use weekly contracts for high R:R plays on reversion toward $60–$58
✅ Recommended Trade Setup
🎯 Strategy: Naked PUT (short bias)
📍 Strike: $61
📅 Expiry: 2025-06-13
💵 Entry Price: $0.55
🎯 Profit Target: $1.10 (+100%)
🛑 Stop Loss: $0.26 (–50%)
📈 Confidence: 65%
⏰ Entry: At open
📏 Size: 1 contract (risk-controlled)
⚠️ Risks to Monitor
• 🚀 Bullish momentum at open could squeeze premiums
• ⏳ Weekly theta decay = fast time burn if reversal is slow
• ⚡ Gaps or price whipsaws could breach stops before thesis plays out
• 📉 Trade only with capital you’re prepared to risk on rapid decay
📉 NYSE:OKLO is hot but stretched — fading momentum or riding breakout?
💬 Drop your play 👇 | Follow for more AI-powered weekly setups.
OKLO Daily Cup and HandleStrong pattern formed off a key level that could breakout in August or September. Upper price target of 90 as long as the gap is filled but not too far under
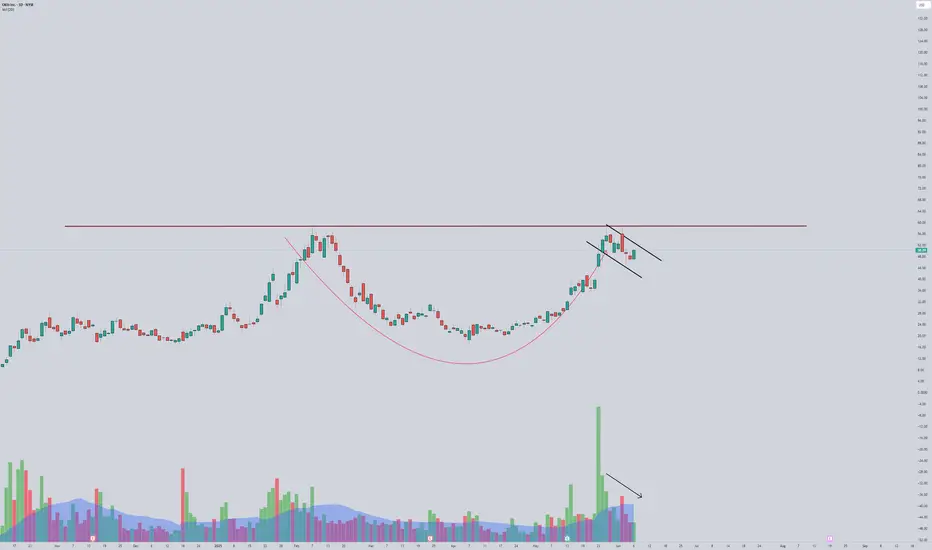
OKLO can go locoPattern: Classic cup and handle formation. Handle forming as a bull flag — very bullish continuation setup.
Resistance: ~$57.78 — key neckline from prior highs. Needs strong close above this level for confirmation.
Volume: Declining during handle = textbook. Suggests controlled pullback. Watching for volume spike on breakout.
Moving Averages: Price is trading above all key MAs, confirming bullish trend structure.
🔥 Most Favorable Path:
Let price tighten within the handle, then breakout above $57.78 on increased volume. If confirmed, target $66–70+ based on measured move from cup base to neckline.
⚠️ Invalidation:
Break below $50 with volume would invalidate handle and signal potential deeper retracement.
✅ Summary:
Setup: Cup & Handle
Bias: Strongly bullish
Entry trigger: Break + close > $57.78
Targets: $66 → $70 zone
Risk level: Manage below $50
*Not a financial advice
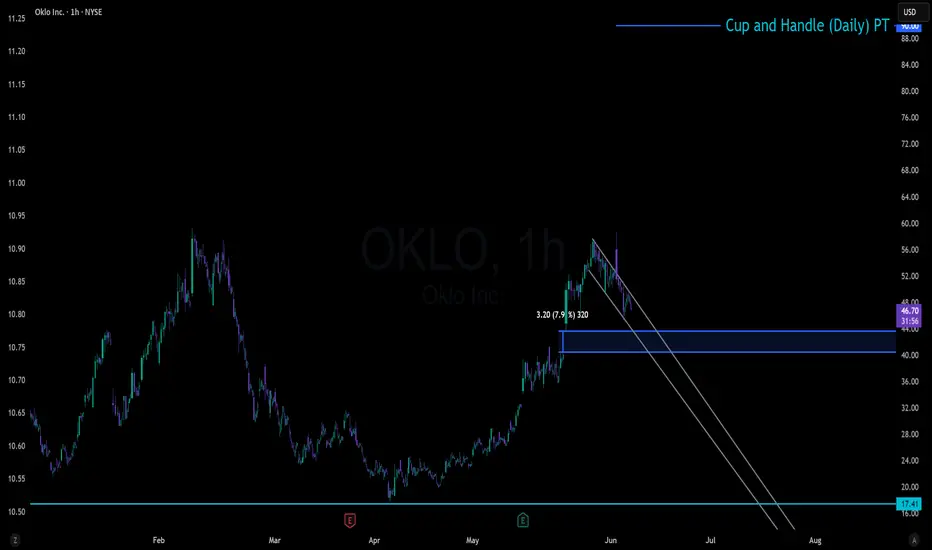
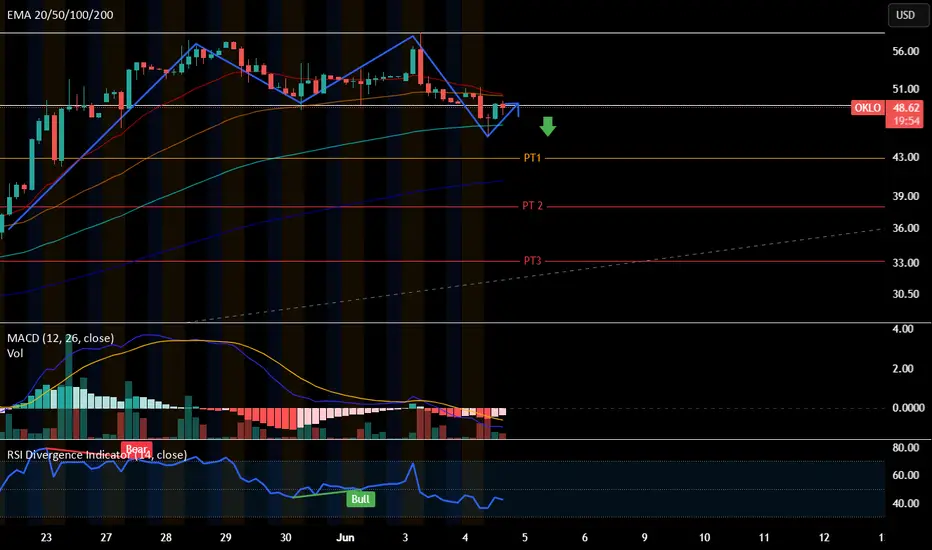
OKLO - ShortChart pattern : double top testing the neckline at $~49.5
Enter Put when it rejects the neck line at $48
Stoploss at ~$50.2
PT1 :~$42.85
PT2: ~$38.25
PT3: ~33.11 - possible PT because it might finish at PT2. considering taking profit at PT2.
Period to reach PT is 1-2 weeks.
$OKLO going longits with the energy theme (and how we never have enough and expect issues in Aug). Fits with modernization and clean energy initiatives