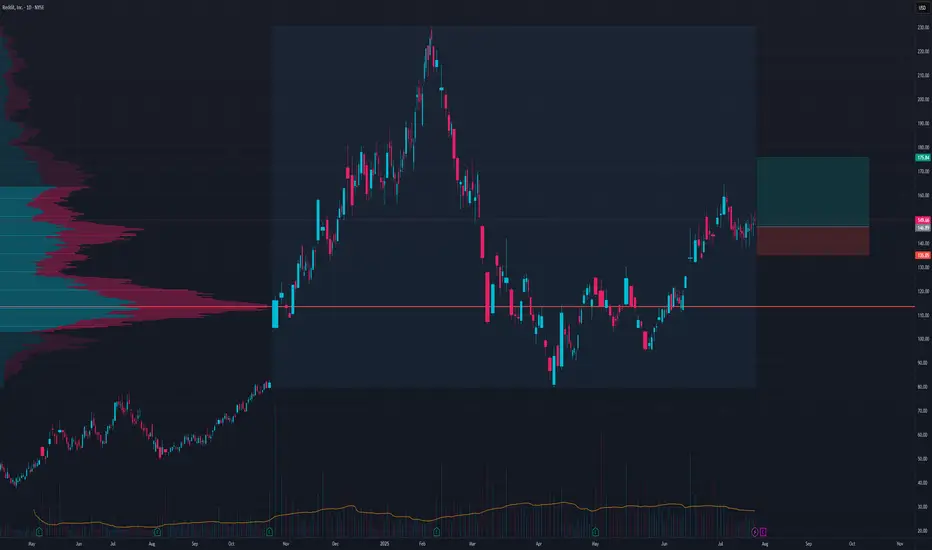
RDDT LongOn a pullback to 146 there is a 2.45 risk to reward setup
I like the volume accumulation here it seems prime to push out of this volume profile
RDDT trade ideas
RDDT Earnings Play — July 30 (BMO)
## 🚀 RDDT Earnings Play — July 30 (BMO)
**🎯 Bullish Call Trade | 75% Confidence | High Momentum Setup**
---
### 📈 REDDIT, INC. (RDDT) – EARNINGS SNAPSHOT
🧠 **Revenue Growth**: +61.5% TTM — AI + Ads combo paying off
💸 **Margins**:
• Gross: 90.8% ✅
• Op: 1.0% 🚩
• Profit: 8.1% 👍
🧾 **EPS Surprise Streak**: ✅ 5 for 5 | Avg. +191%
🎯 **Target Price**: \$155.58 (+9.5%)
⚖️ **Forward P/E**: 222.6 — Rich but justified?
**Score: 8/10**
📊 Sector: Comm Services (AI-driven tailwinds)
---
### 💥 OPTIONS FLOW SNAPSHOT
💰 Calls Stack at \$150 & \$160
🛡️ Puts cluster \$140–\$149 = Hedges, not bearish bets
📉 IV High = Juicy premiums
📈 Gamma Bias: Positive Skew
**Score: 7/10**
---
### 🔍 TECHNICAL CHECK
📍 Price: \~\$145.32
🧭 20D MA: \$147.89
📊 RSI: 59.5 (Momentum neutral, room to run)
🔓 Resistance: \$150
🛡️ Support: \$140
**Score: 6/10**
---
### 🌎 MACRO CONTEXT
🧠 Sector tailwinds from AI hype + digital ad rebound
🛑 No major regulatory red flags
**Score: 8/10**
---
## 🔥 THE TRADE SETUP
**📈 Direction**: Bullish
🎯 **RDDT 08/01 \$150C**
💸 **Entry**: \$9.55
🛑 **Stop Loss**: \$4.78
📈 **Target**: \$19.55+
🧮 **Size**: 1 Contract = \$955 Risk
🕒 **Entry Timing**: Pre-earnings close
📆 **Earnings Time**: BMO (Before Market Open)
📊 Expected Move: \~5%
📈 Setup = High risk / High reward, theta-sensitive
---
## ⚡ TRADE PLAN
✅ Take partial profit at 100%, full at 200%
⏳ Exit within 2H post-ER if target unmet
🛑 Cut below \$4.78 to cap drawdown
---
## 🧠 CONVICTION SCORE
🎯 75% Bullish Bias
📊 Based on fundamentals, options, and flow
📉 Risk = Valuation + Thin Op Margin
📈 Reward = Explosive upside w/ surprise history
---
💬 **Watch for \$150 breakout. If cleared post-ER = moonshot to \$160 possible.**
📢 #RDDT #EarningsTrade #RedditStock #CallOptions #AIStocks #TechMomentum #OptionsFlow #IVSurge #TradingViewIdeas #SwingTrade #OptionsStrategy #VolatilityPlays #RDDTstock

RDDT Earnings Setup (2025-07-31)
### 🔥 RDDT Earnings Setup (2025-07-31)
📈 **Bullish Bias | Confidence: 75%**
🎯 Target: \$165+ | 🔒 Resistance: \$155.58
---
### 📊 FUNDAMENTALS
* 📈 **Revenue Growth (TTM): +61.5%**
* 💰 **Gross Margin**: 90.8%
* ⚠️ **Op Margin**: 1.0% (Thin runway)
* 💥 EPS Surprise Avg: **+191% (5/5 beat streak!)**
* 📉 EPS Growth Est: **-86.6%** → low bar = potential upside
**🧠 Fundamental Score: 7/10**
---
### 🧠 OPTIONS FLOW
* 🔵 **\$172.00C** building OI
* 💸 IV Rank \~0.75 (Move priced in!)
* 🧲 Bullish call activity > puts
* 🛡️ Put skew = hedged upside
**📊 Options Score: 7/10**
---
### 📈 TECHNICAL SETUP
* ✅ Above 20DMA
* 🔥 RSI: 62.2 = strength but not overbought
* 📦 Accumulation spike
* 🔐 Resistance: \$155.58
* 🧲 Break = squeeze setup
**📉 Technical Score: 8/10**
---
### 🌍 MACRO BACKDROP
* 🌐 Digital ad sector = support
* 🚨 Regulatory overhang = minor risk
* 🧬 Growth stock rotation helps RDDT
**🌐 Macro Score: 7/10**
---
### 🎯 TRADE IDEA
**💥 RDDT \$172.00C** (Aug 1 Exp)
* 💵 Entry: \$6.15
* 🎯 PT: \$18.45
* 🛑 SL: \$3.08
* 📈 Risk/Reward: \~3:1
* ⏱ Exit: 1–2 hrs post-earnings
* ⚖️ Sizing: 1 contract = \~\$615 risk
---
### ✅ SUMMARY
🧬 Strong rev growth + historical beat streak
🎯 Technical breakout setup + bullish flow
🚀 Potential squeeze toward **\$165+**
📣 Tag: #RDDT #EarningsPlay #OptionsFlow #RedditIPO #SwingTrade #TradingViewViral #EarningsSeason #TechStocks #CallOptions

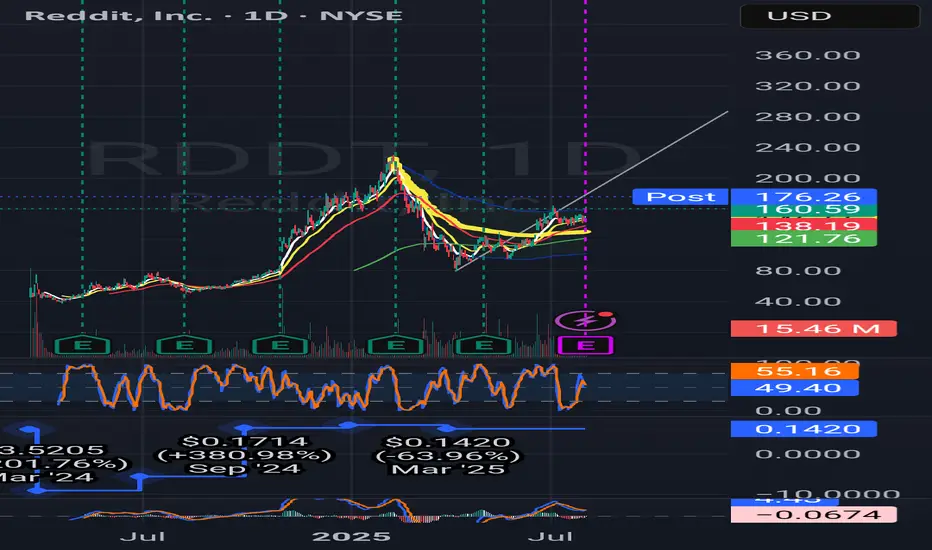
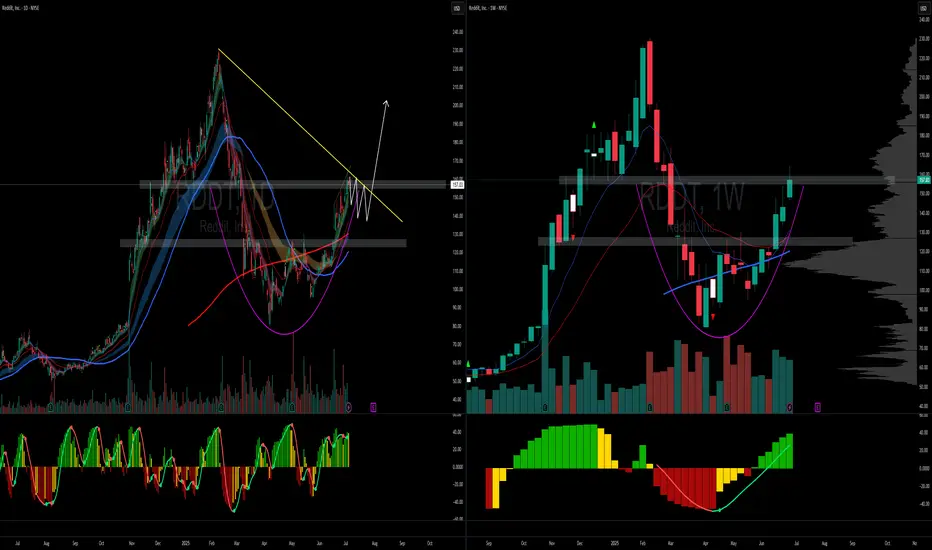
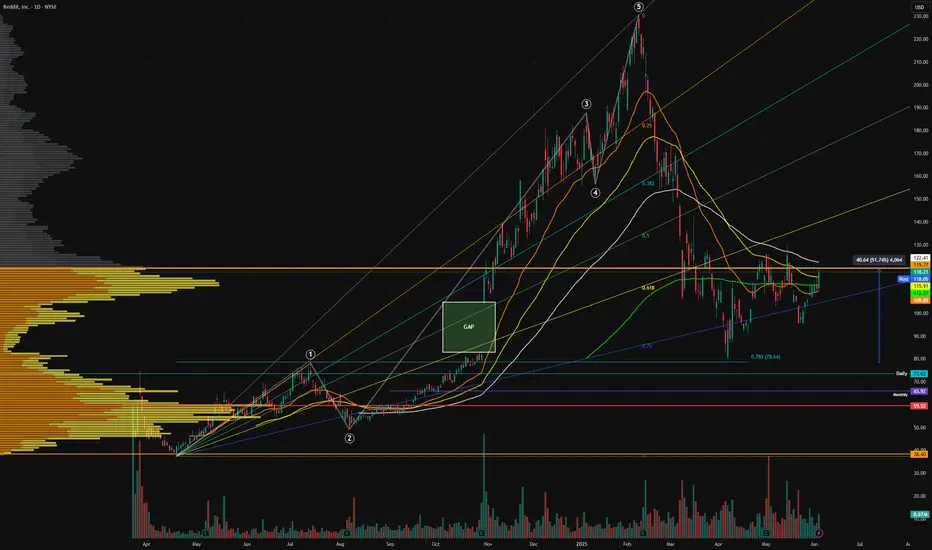
New targets for Reddit RDDT In this video I recap the previous reddit analysis where we looked for the long which is playing out really well .
I also look at the current price action and simulate what I think could be a target for the stock moving forward using Fib expansion tools as well as levels below for price to draw back too.
Welcome any questions below the chart . Thanks for viewing

RDDT break out sling shotEntry Trigger: Entry above $149.95 with strong volume
Technical Indicators:
-RS = 91
-clear uptrend
-contracting volume before breakout
-Fundamentals Last 3 quarters show rising EPS and sales
Play
Stop Loss Below the breakout candle
Target Minimum 2.5R / ride the EMA
Sell in to strenght nex pivot 165,05

Reddit breaks out for bullish run I have been watching Reddit for a couple of weeks and identified that we had put in the .786 low from the correction since February and then formed a range that was well respected for the past 4 months .
In this video I highlight zones where i expect price to gravitate too and where a nice entry will be if you are looking to long reddit.
Tools used Fib suite , trend based fib , tr pocket , 0.786 + 0.382 and fixed range .

Reddit (RDDT) – Technical + Earnings + Macro Breakdown Just finished breaking down Reddit (RDDT) after today’s big move, and I think it’s worth laying out the full picture — technicals, earnings, macro — because this one’s got real substance underneath the headline jump.
TL;DR: this is a real breakout, not meme hype, but it's happening in a fragile macro context, and you absolutely shouldn't chase it blindly.
Let’s start with the chart. Today’s candle, so far, is textbook bullish — almost marubozu-style — opening near the lows and closing near the highs, up 4.74% on serious volume. No upper wick, which means buyers were in control all day. This came right after earnings and broke out of a multi-month range that had been holding since April. Price smashed through the $170–175 zone, which was the prior swing high from March. That’s a legitimate breakout. And the volume confirms it’s not retail FOMO. Technically, it’s a continuation move, not a reversal, but it’s also coming at the tail end of a very sharp thrust. This is a bullish continuation pattern, but one where you start looking for digestion, not acceleration.
Momentum-wise, everything is flashing green — but maybe too green. MACD just made a fresh bull cross with an expanding histogram, and RSI is screaming at 88.69. That’s extreme, no two ways about it. But when you get this kind of breakout on strong earnings, RSI can stay overbought for days or even weeks. The trend since May has been a clean stair-step move higher — no parabolic blow-off yet — but today might be the first sign of euphoria starting to creep in.
If you’re a box fan, this move also fits the mold. The $110 to $175 range held from April through July, and we just broke out of that box with volume confirmation. Logic would project a target by adding the range width (~$65) to the breakout level — that puts a rough upside target at $240. Of course, these moves rarely go straight up — you usually see a break, a retest, and then a continuation. So don't expect a clean shot to $240. Still, the technical structure is legit.
Now let’s zoom in on some Fib levels from the May swing low at $110 to today’s high of $191. If we get a pullback, the first dip zone is the 23.6% retracement at $171.52. That’s close to today’s breakout level, so watch that carefully. Below that, $157.27 (38.2%) is the major reload zone, and $150.50 (50%) is where trend-followers should probably stop out if it breaks with volume. On the upside, the 127.2% extension sits at $215.76, then 161.8% at $241.39, and finally 200% at $272. Realistically, $191 is acting as the first resistance cap, since it's the full 100% extension from the move.
Now here’s where things get even more interesting — fundamentals. This earnings print was strong. No massaging, no fancy adjustments — just raw numbers. Revenue was up 78% year-over-year, hitting $500M. Net income? $89M GAAP. Yes, actual profits. And Reddit’s positioning in the AI narrative is no joke — they’re now the most cited domain for AI model training across the board. Wall Street is obsessed with “data moats” right now, and Reddit has one of the deepest UGC data pools available. Ads are booming too — ad revenue up 84% YoY. CFO basically said they’ve found the balance between growth and profitability, which ticks boxes for both value and growth investors. Bottom line: this is the quarter where Reddit starts getting re-rated from “weird social media” to “AI-leveraged data platform with real margins.”
But — and this is important — macro risk is back. Today wasn’t just a feel-good market day. We got downward payroll revisions (which makes the labor picture look worse in hindsight), and tariffs are being reintroduced, which is never good for risk appetite — especially in tech. If yields spike or markets start pricing in more Fed tightening, high-growth names like Reddit will feel it. You can't ignore that RSI is already 88 — meaning if the macro starts rolling over, Reddit is at real risk of a fade purely due to liquidity rotation.
So tactically, this is a setup where you respect the breakout, but you don’t chase it. First support is $171.52 — that’s your first pullback buy zone. Then $157.27 is your deeper dip/reload level. On the upside, $191 is resistance. If it breaks cleanly above and holds with volume, $215 is the next stop. If it slices below $157 with volume, that’s a red flag and probably invalidates the trend for now.
Final take? RDDT is one of the best fundamental stories this quarter, and today’s move was backed by structure and volume. But we’re late in the thrust, macro is fragile, and sentiment is stretched. Be patient. Wait for a pullback or tight consolidation above $171. If that holds, $215+ is on deck. If it doesn’t, sit back and wait for the dust to settle — this trend isn’t dead, but it’s not invincible either.
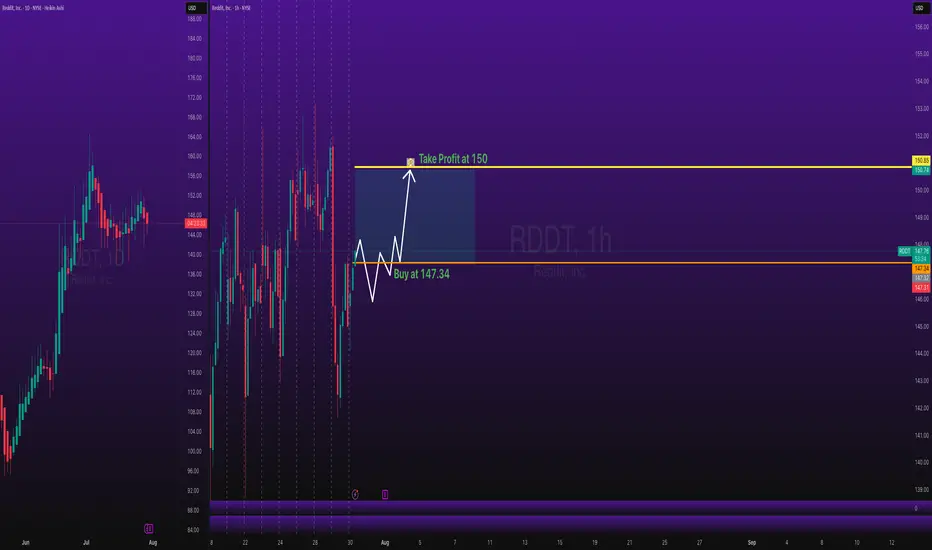
Stocks SPOT ACCOUNT: Reddit stocks BUT ENTRY with TAKE PROFITStocks SPOT ACCOUNT: NYSE:RDDT stocks my buy trade with take profit.
This is my SPOT Accounts for Stocks Portfolio.
Trade shows my Buying and Take Profit Level.
Spot account doesn't need SL because its stocks buying account.
RDDT - Ready for Round 2?RDDT is setting up a base here, let's see if it holds this previous support level around 80.
Target 1 - 160
Target 2 - 180
Stop loss - 75

Wallstreetbets and Markets: Is there a correlation? Preface:
As a self proclaimed “market statistician”, I like to do a lot of random research, sometimes useful, sometimes not so useful.
Here is a post about some “not so useful” research I did. Though not so useful, the results are truly interesting.
The results of this analysis are, in my opinion, pertinent in a post GME and AMC world, where retail have gained huge momentum and presence within the market as a whole and have been able to even tackle hedge funds and win!
Purpose and Aim:
The aim of this was to identify whether Wallstreetbets (heretofore referred to as WSB) data had any meaningful impact on market mechanics, moves, volume etc.
I have been tracking WSB data for some time and have amassed a database of over 300 saved files, consisting of exactly 104 trading days of data.
This is a great amount to actually run analysis on and run some predictive tests!
The main questions I wanted answered are:
a) Does WSB data impacted market moves and Volume? If so,
b) Is WSB reactive to market moves (i.e. the market moves and the ticker trends); or
c) Is WSB proactive in moving the market (i.e. mentions increase and the market move follows).
These questions can be somewhat answered, albeit not flawlessly, using math.
Approach:
To analyze the data, I used:
a) Regression (simple linear);
b) Correlation;
c) Lagged correlation; and
d) Granger Causality
Tickers chosen
I quickly scripted an algorithm to scan through all of the 300+ WSB data and identify the top 10 tickers that were consistently mentioned across all saved data. The data Spans from mid 2024 to current.
The results were as follows, the top 10 tickers which were present in every single saved datafile were:
1 AAPL 104
2 AM 104
3 AMD 104
4 DTE 104
5 GOOG 104
6 MSFT 104
7 NVDA 104
8 PLTR 104
9 QQQ 104
10 SPY 104
Selection for Analysis were:
AAPL, AMD, PLTR and SPY
Raw Results:
NASDAQ:AAPL
NASDAQ:AMD
NASDAQ:PLTR
AMEX:SPY
Oh yeah, let’s see how retail competes with huge indices, this should be really good!
Explanations and Implications
The data presented is all incredibly “mathy”, but let’s break it down to what we can ascertain.
First and foremost, let’s outline the major limitations:
In this analysis, I used large cap stocks and limited to only 4 stocks. The results for these will be greatly different from, say, doing this on small cap or penny stocks (which will be a potential study next!).
As well, we are shy of 1 full year of trading data, which would have more impact on analysis. I do plan to repeat this study with approximately 1 full trading year of WSB data (i.e. 252 days).
So essentially 148 more days and I will have collected 1 full trading year for analysis.
Now that we have that out of the way, let’s discuss what we can say from these results, what we are unsure of and what are the implications for the broader group of traders, MMs and everyone in between.
What we Know
WSB logically has a strong relationship with trade volume. We can see that in most of the analyzed tickers. The correlations tend to be positive and tend to be substantial. More mentions (i.e more hype) leads to greater trade volume, likely as a result of people following the most mentioned or “hot” ideas on WSB.
This is not hard to fathom and its easy to accept as a logical consequence of trending tickers to a large audience of market participants ready to jump at anything.
What we are unsure of
This title is kind of a misnomer. While I phrase it as “what we are unsure of”, the fact remains that we can deduct that there is a significance and a relationship exists; but we can’t be sure as to how deep and profound this relationship extends, owning to the limited amount of data available.
But what we are unsure of is the extent to which WSB is impacting returns and market movement.
In 2 out of 4 tickers, we see that there is a pretty substantial lagged correlation between stock movement/returns and WSB trending status. This implies that WSB may be pushing market movement. However, in both of these cases, the results are short lived. This could be the result of either:
a) The greater market taking over and profit taking on the WSB pump; or
b) The WSBers taking profits themselves after pushing the stock in a direction.
The 2 cases were of AMD and SPY. The results indicated effect of roughly 2 consecutive days before tapering off.
The other 2 tickers, PLTR and AAPL, did not show a very strong relationship or evidence of WSB greatly impacting stock movement, but of WSBers likely “trend following” momentum.
What this means for the broader market?
Its no secret that retail is having a substantial impact on the market and changing the way market dynamics work.
For “experienced” or “senior” traders who have been trading for longer than 4 years, these people would tend to notice that the market dynamics have changed this year and have been changing slowly over the recent years.
One could offer the explanation of changing market sentiment; but perhaps the real explanation is an influx of retail and social media.
If you think about the number of “pump and dump” scams that were successful through the use of social media over the last few years, it’s not hard to believe that the advent of social media and easy access to markets can be a recipe for “disrupting” a routine and destabilizing the market that one once knew.
The NYSE is traded by millions worldwide. Its not just Americans participating, but those globally, leading to participants that surpass even the US population. As we advance in a global information highway that is the internet and social media, its not hard to rally forces to impact change, be it political or financial.
So what does this all mean?
The face of markets is changing and changing fast. No longer are markets strictly influenced by the elite, but by the average Joe who likes to read social media and buy a few options or shares. The implication is essentially the democratization of the market, removed from the grasps of the bourgeoisie and shifted to that of the layman.
Implications for Further Research
This should be repeated on low cap, low float, penny stocks to really analyze the impact of social media on markets and the implications of manipulation and “pump and dump” scams.
Thank you for reading!
This information is for interest sake only and not suggestive of any financial advice of suggestions.
Trade at your own risk and use your own strategies!
Used for this analysis:
R Language
Tradstie API
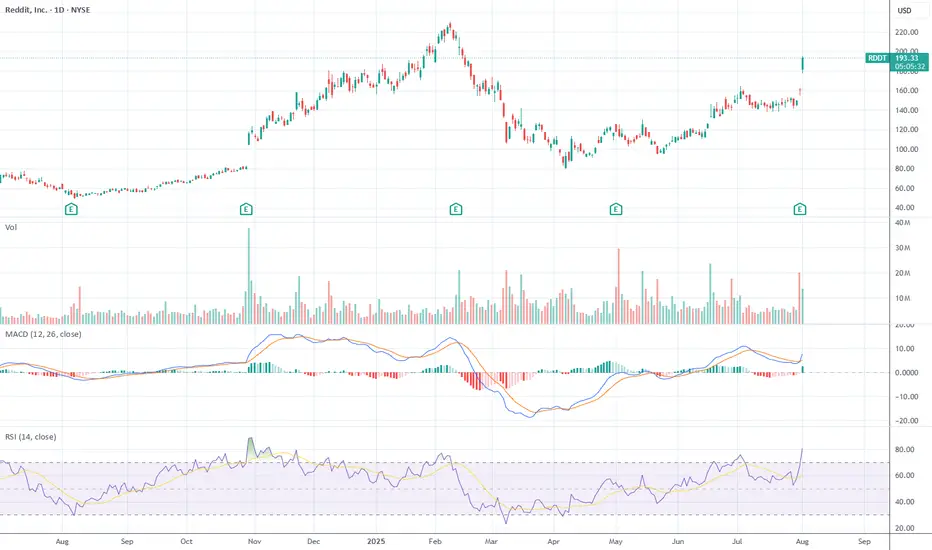
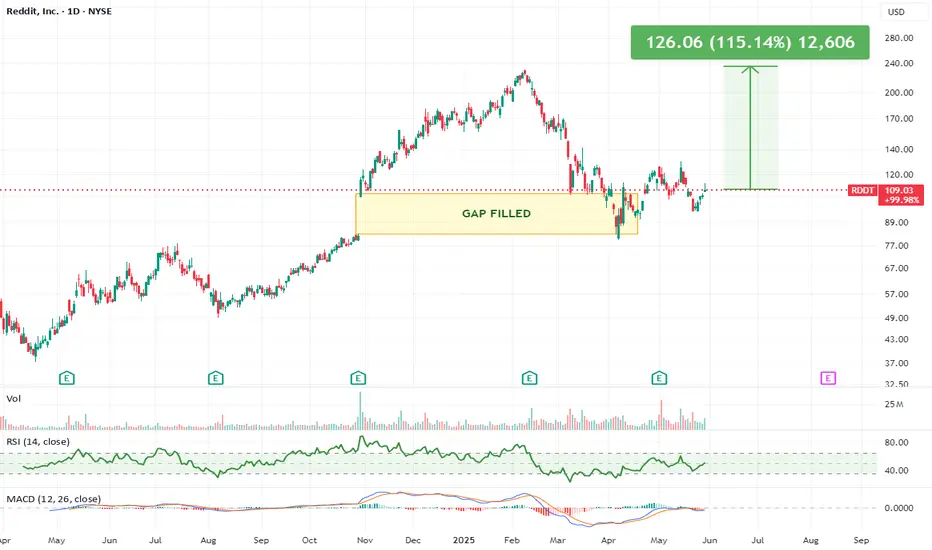
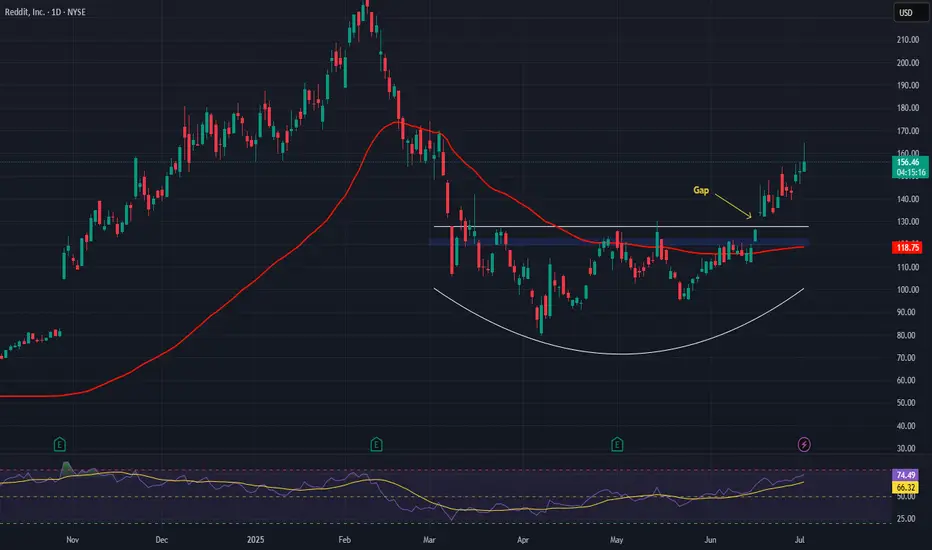
Feel like Reddit might be worth a watch. Managed to fill that gap where it ran hard from previously.
MACD below that 0 line and looks like its showing signs of momentum coming back in.
Might be worth keeping an eye on.
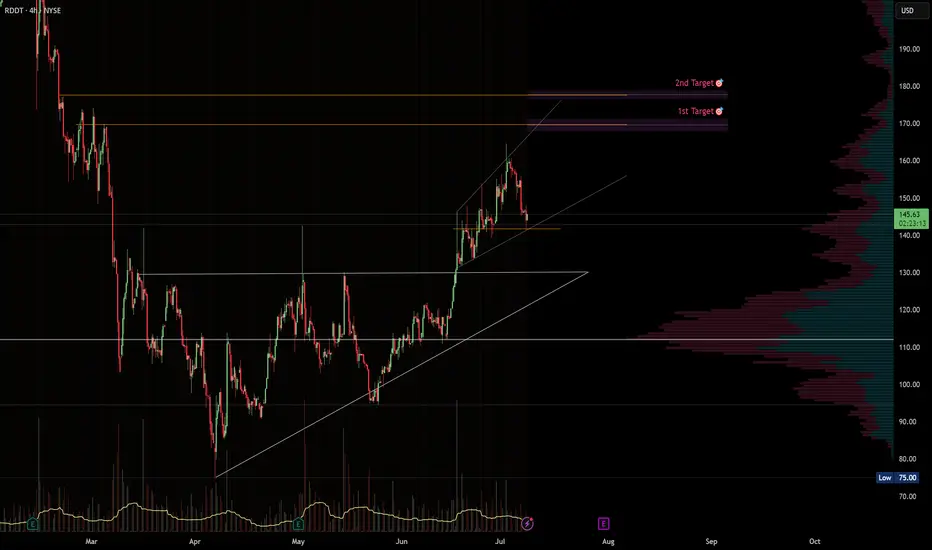
RDDT · 4H — Rising-Wedge Setup with Targets at $172 and $185Setup Summary
Rising wedge structure forming since late June. Price recently pulled back to test support at ~$144–145, where the rising trendline intersects horizontal structure.
Momentum remains bullish: The prior move from $110 to $165 was impulsive, and this consolidation appears corrective so far.
Volume profile (VPVR) shows a thin liquidity zone between $150 and $172, suggesting a strong move is likely if the $150 level is reclaimed.
---
🎯 Target Zones
Target Level Rationale
1st Target $169 Matches wedge breakout projection + aligns with prior IPO supply and volume gap resistance.
2nd Target $177 Psychological round number + coincides with IPO opening print and the highest rejection wick seen so far.
---
🛠️ Trade Plan
Component Level
Trigger Entry on bounce from $144 or breakout/reclaim of $150.
Invalidation Close below $142 breaks wedge structure.
TP-1 $172 – take 50–70% off, move stop to breakeven.
TP-2 $185 – runner target; exit if price shows rejection.
---
⚠️ Risk Notes
Wedge patterns can fake out — wait for confirmation (e.g. a 4H bullish engulfing or volume reclaim above $148–150).
Earnings or lock-up expiration could introduce volatility (check calendar).
If support at $143 fails, look for next demand at $134–135 (prior breakout base).
---
✅ Checklist
Structure: Rising wedge in uptrend
Support: Held above previous breakout zone
Volume profile: Favorable thin zone toward $172
Risk defined below $142
> Disclaimer: This idea is for educational purposes only. Trade your own plan and always use proper risk management.
Reddit, how much further?NYSE:RDDT might want to consolidate here and build a flag before launching further
down trendline from ATH is acting as resistance
also there is some supply from 160-180 to go through
forming quite a nice rounding bottom here
could go straight up too... who knows
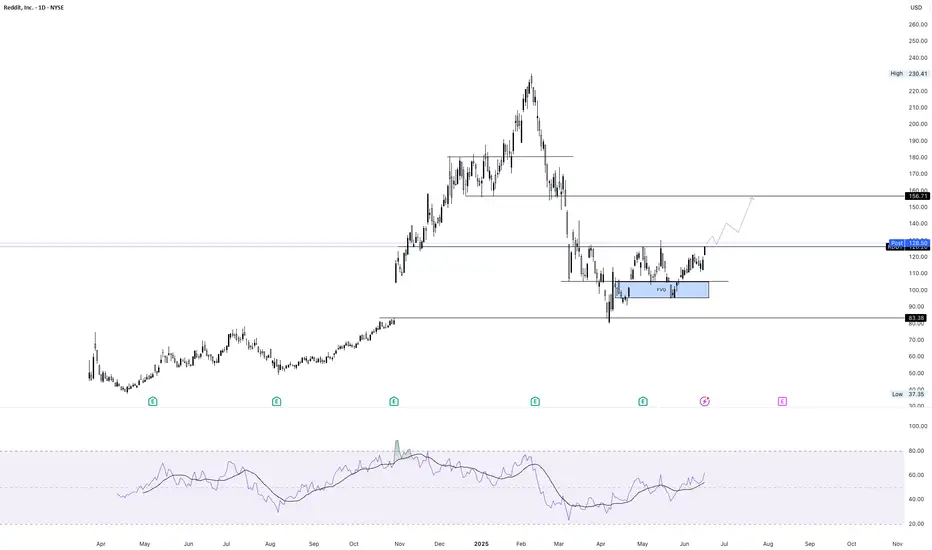
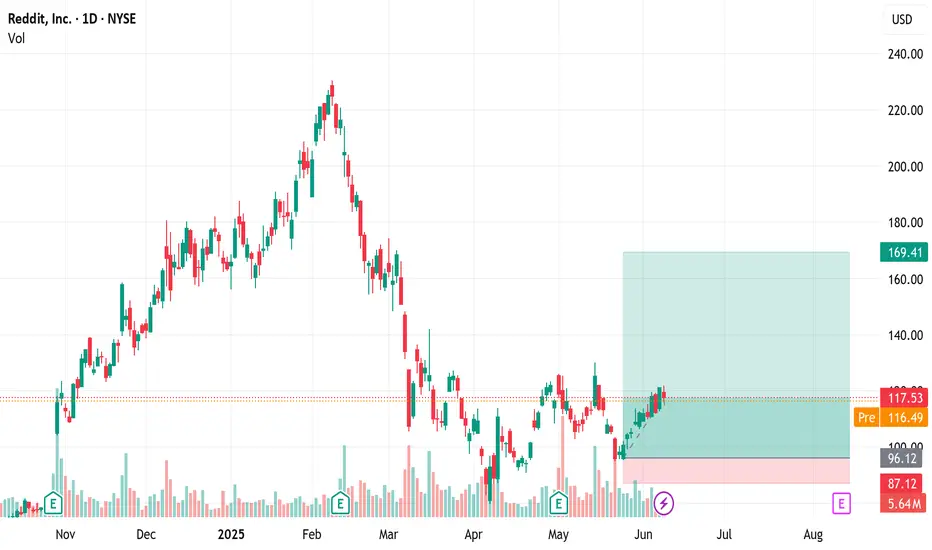
Reddit Long ideaReddit stock filled the earnings gap from Oct 2024 — clean bullish reversal + retest. Looks like it's heading for the next resistance zone. Planning to swing this one up toward the $150–156 range.
Reddit, Inc. (RDDT) – Global Growth & Monetization TailwindsCompany Snapshot:
Reddit NYSE:RDDT is a community-centric social media platform, uniquely positioned through user-generated content and authentic engagement. With over 100,000 active communities, Reddit is a magnet for targeted brand advertising and premium ad formats.
Key Catalysts:
AI-Driven International Expansion 🌐
Launched AI-powered post translation in 35+ countries, including Brazil, Germany, and Italy.
This unlocks new audiences and ad monetization in high-growth global markets.
High Margin Business Model 💸
Reported a 90.5% gross margin—highlighting Reddit’s asset-light infrastructure and operational efficiency.
Sets the stage for significant operating leverage as revenue scales.
Ad Revenue Acceleration 📊
Brands increasingly view Reddit as a premium ad environment, given its contextual targeting and deep user engagement.
Expanding tools for advertisers (e.g., Dynamic Product Ads) may enhance monetization per user.
Investment Outlook:
Bullish Entry Zone: Above $120.00–$122.00
Upside Target: $190.00–$195.00, supported by global reach, margin strength, and ad revenue tailwinds.
🧠 Reddit isn’t just a social platform—it’s a monetizable network of influence, fueled by community trust and scalable technology.
#Reddit #RDDT #SocialMediaStocks #AIExpansion #GrossMargin #AdTech #CommunityEngagement #TechStocks #Bullish #DigitalAds #UserGeneratedContent #GlobalGrowth #FreeCashFlow #GrowthStocks
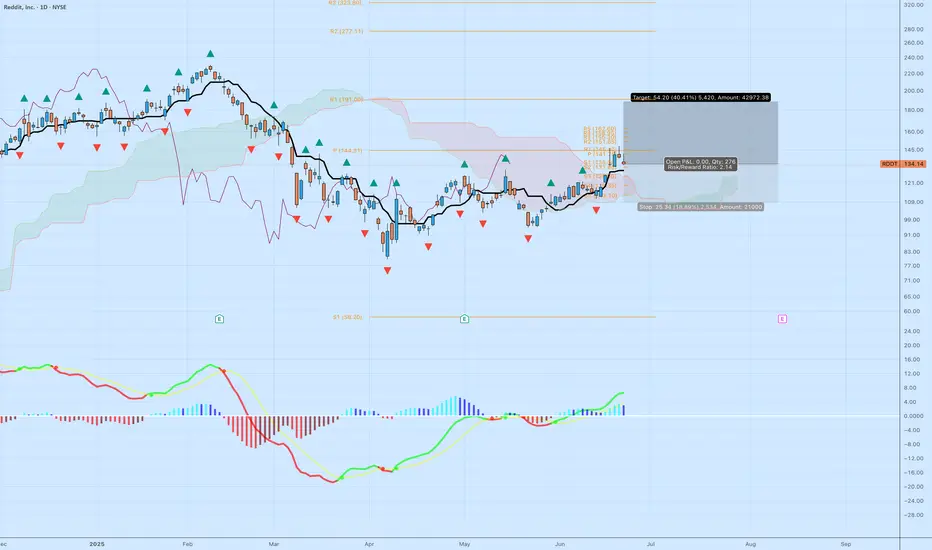
$RDDT Long Setup – Bullish BreakoutReddit ( NYSE:RDDT ) has broken out above the Ichimoku Cloud on the daily chart, signaling a potential shift in trend. Momentum is building with MACD pushing higher and no signs of divergence, showing continued strength. While this trade offers a solid 2.1 risk/reward setup (entry at $134.14, stop at $108.80, target at $188.34), the current entry is not ideal—price is extended from support, and the breakout has already moved significantly. However, the structure still points to bullish continuation. If RDDT can hold above the $130–$135 zone, there’s room to run into the $180s and potentially beyond. A pullback toward the breakout zone would offer a stronger entry, but the upside here remains attractive for a swing trade. This setup is best approached with smaller size or added confirmation if chasing.
Reddit - Long & StrongOn the 10th of March I posted about Reddit, as it lost the $120 level I advised the bulls to get ready to buy in at $80, which was the gap fill area met with the confluence of the 0.786 Fib level. We remained patient at went long at $82, with a stop loss under the 0.786 at $78. That move is now paying off, as we are up 50% from these levels. Congratulations to those paying attention, we are reaping the rewards of this trade. We had the initial strong bounce to $130, I also said at this point we will likely have another chance to accumulate under $100 - check the minds section - indeed that happened and here we are again 18% from $100.
So what's next? I am seeing continued sign of strength on the charts. This was aided by the recent development that Reddit is suing Anthropic for using their data, despite repeated warnings from Reddit. This stock has a strong technical and fundamental reason to remain bullish.
I'm taking this one step at a time. There's no doubt it is a volatile stock, I think we have put in the lows for now and we continue the path towards $150. But this market can flip at any time, all it takes is post on X to send the entire market into chaos. So be mindful of the risks.
But we remain long and strong here. We didn't fomo into the stock, and we don't plan to panic sell out of it. That is my philosophy.
Not financial advice.
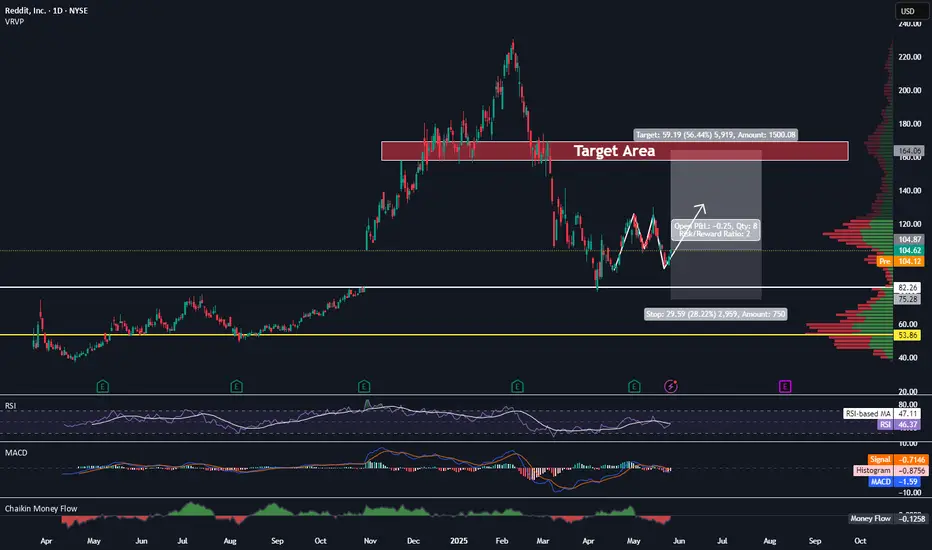
Let's Buy Reddit TodayTrading Fam,
After missing an initial entry on Reddit when my indicator gave me a buy, we double-topped and then came back down into our liquidity block. This has given me a second chance for a decent entry. I will be targeting $158-170 with a SL currently set at $75.
Stew
Bullish on RDDT - Can it clear 130 and hold this time?Key levels to watch
Support: 108–110. This zone held on the most recent pullback and aligns with prior structure.
Short-term target: 125–126. If price breaks and holds above this level, it suggests momentum is building.
Overhead Resistance: 130. Clearing and holding above this level is what would turn this from a bounce into something with more swing potential.
Upside potential: 155–166, if price can build a base above 130
While the structure is building constructively, and a decline from here isn't my first pick, it is possible that we just continue to chop. But, for now I am bullish on RDDT for the next few weeks, and I will continue to update you here as it plays out.

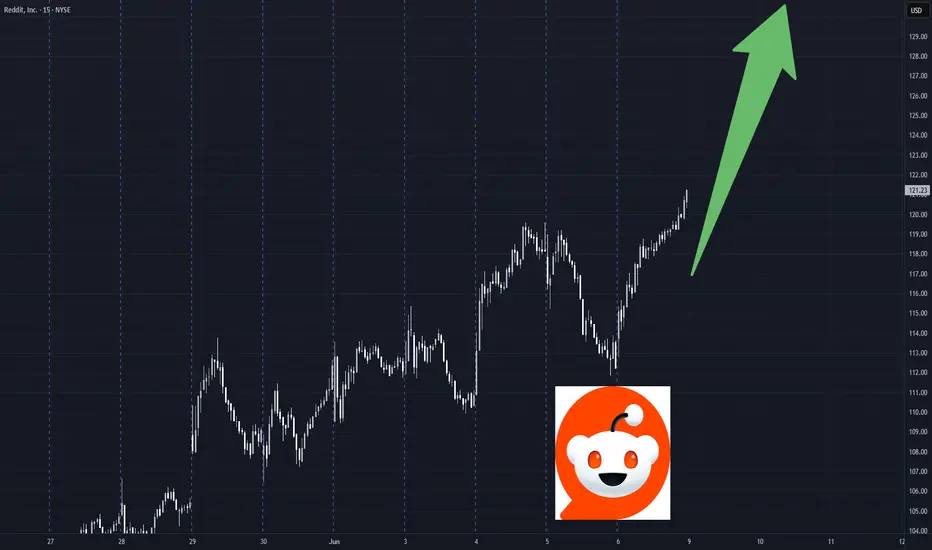
RDDT Weekly Trade Plan – 2025-06-06🚀 RDDT Weekly Trade Plan – 2025-06-06
Bias: Moderately Bullish
Timeframe: 1-day (0DTE)
Catalyst: Momentum continuation, supportive VIX, strong short-term technicals
Trade Type: Naked call option
🧠 Model Summary Table
Model Direction Strike Entry Price Target Gain Stop-Loss Confidence
Grok Moderately Bullish $118 CALL ~$0.68 +25% –30% 75%
Claude Moderately Bearish $115 PUT ~$0.74 +50–100% –50% 72%
Llama Moderately Bullish $119 CALL ~$0.66 +10–15% support break 70%
Gemini Moderately Bullish $120 CALL ~$0.58 +50–100% –50% 65%
DeepSeek Moderately Bullish $118 CALL ~$0.68 +50% –50% 65%
✅ Consensus: Momentum-driven upside with support from trend, RSI, MACD
⚠️ Disagreement: Claude bearish due to max pain gravity and fading M5 momentum
📉 Technical & Sentiment Summary
Trend: Price above EMAs, RSI positive, MACD confirms momentum
Resistance: $117.30–$117.73 zone to clear before $119 strike in play
Sentiment: VIX falling, news cycle supportive
Max Pain: $113 – downside gravity risk if momentum stalls
Liquidity: Decent OI on $118–$120 strikes; spreads could widen at open
✅ Final Trade Setup
Parameter Value
Instrument RDDT
Direction CALL (LONG)
Strike $119
Expiry 2025-06-06 (0DTE)
Entry Price $0.66
Profit Target $0.99 (≈+50%)
Stop Loss $0.33 (≈–50%)
Size 1 contract
Entry Timing At market open
Confidence 70%
💡 Rationale: Balanced strike with reasonable premium and realistic target before EOD, while staying inside momentum breakout range.
⚠️ Key Risks & Considerations
Theta decay: Time erosion steep on 0DTEs—move must be fast and early
Max pain: $113 could anchor the stock if resistance isn’t cleared
Resistance: Cluster around $117.30–$117.73 needs break for $119 test
Open volatility: Bid-ask spreads could widen—consider limit entry
📊 TRADE DETAILS SNAPSHOT
🎯 Instrument: RDDT
🔀 Direction: CALL (LONG)
🎯 Strike: 119.00
💵 Entry: $0.66
🎯 Target: $0.99
🛑 Stop: $0.33
📅 Expiry: 2025-06-06
📏 Size: 1
📈 Confidence: 70%
⏰ Entry: Open
🕒 Signal Time: 2025-06-06 11:29:24 EDT
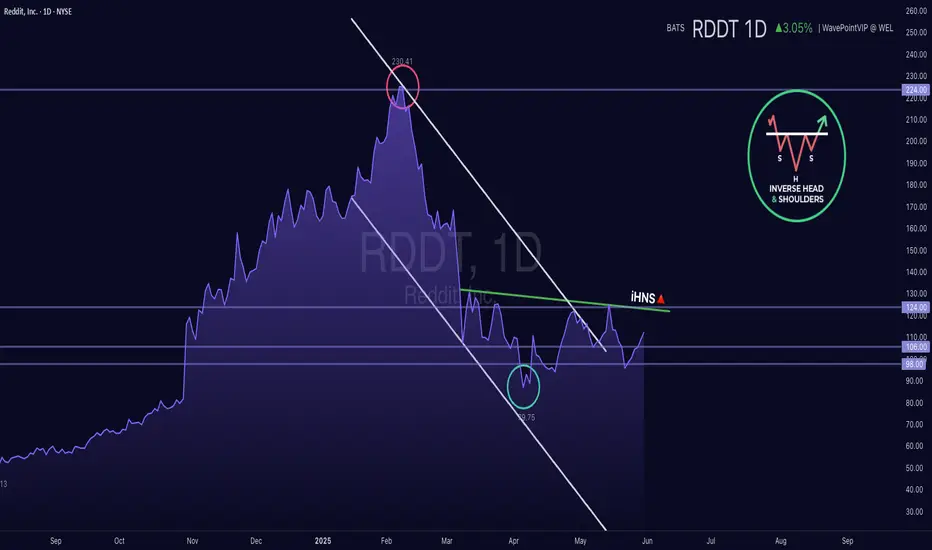
RDDT - Inverse Head & Shoulder [MID-TERM]NYSE:RDDT Reddit broke through a falling trend channel, suggesting a potential inverse head & shoulder pattern. Support is at $87 and resistance at $224.