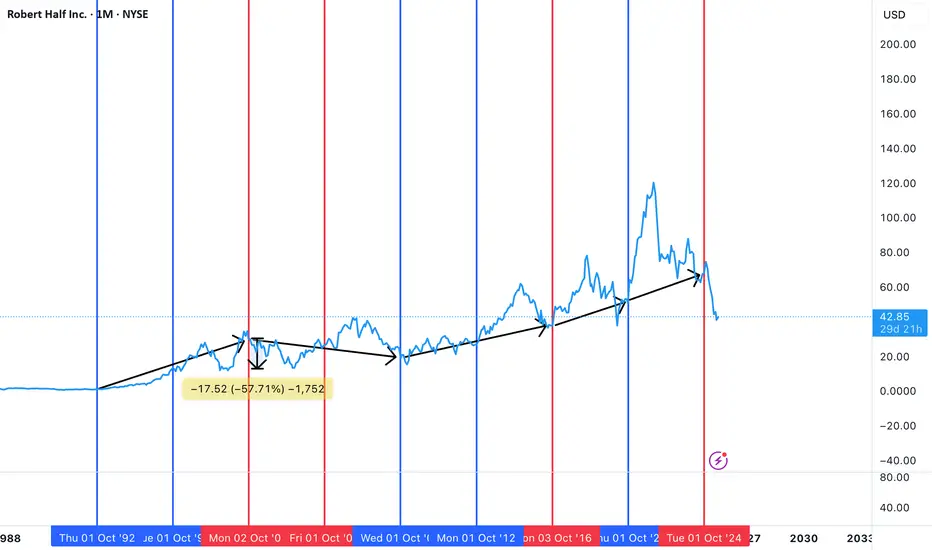
White Collar job sentiment has been plunging since 2022Robert Half has been around for quite sometime...I look at this chart as a sentiment indicator for "white collar workers". While white collar workers and the American middle class are not synonymous you could say that many people in the middle class are employed as white collar workers so it is a chart to study when considering how the American middle class is "feeling" about their job situation which in turn leads to consumption habits either falling or rising.
Needless to say this chart has been plunging since early 2022 and is off to the worst start of a presidential turnover since Bush in 2000 (if you study only the last 25 years).
Typically once a president has been elected or re-elected this chart generally has gone up during the first 2 years after election or re-election...it then either continues upwards or begins to go down after the 2nd full year. As you can see during the Bush presidential term sentiment actually went down.
This chart is one of the reasons I believe charts like Target, Lululemon, LVMH, etc have been suffering.
Anyways, RHI is actually not a bad company...pays a pretty good dividend and has a solid balance sheet. Could this be the quarter for the turn around? Today had a very strong bullish reversal candle, not only for this company but also for the others I mentioned above. Only time will tell but this chart will eventually turn around.
RHI trade ideas
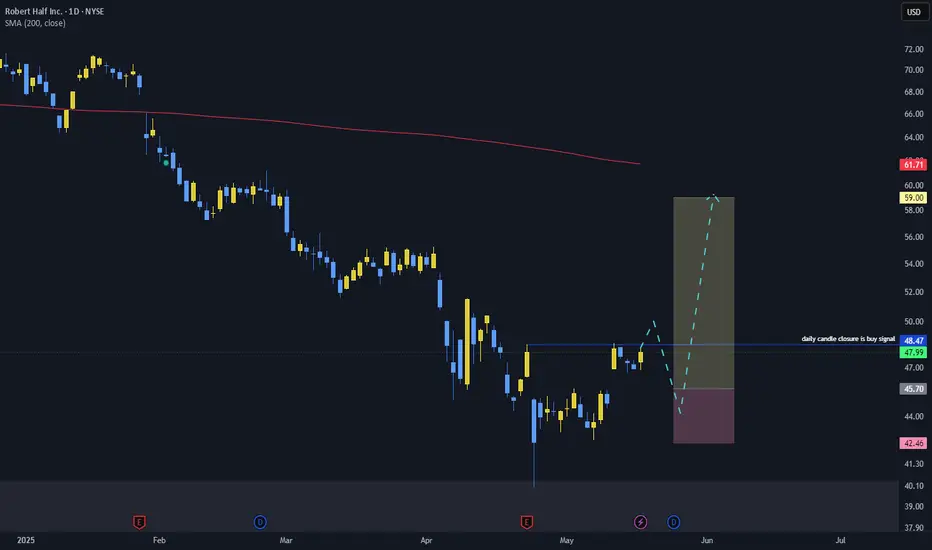
bullish setupAfter daily candle closure above blue line, price may go directly to the target or down to 45.7 $ for a better entry
SL is 7% (better daily candle closure only)
take profit at 59$ (29%)
RHI long term support and uptrendTheres an extension, long term support and and even longer uptrend. I anticipate almost a 50% retracement.
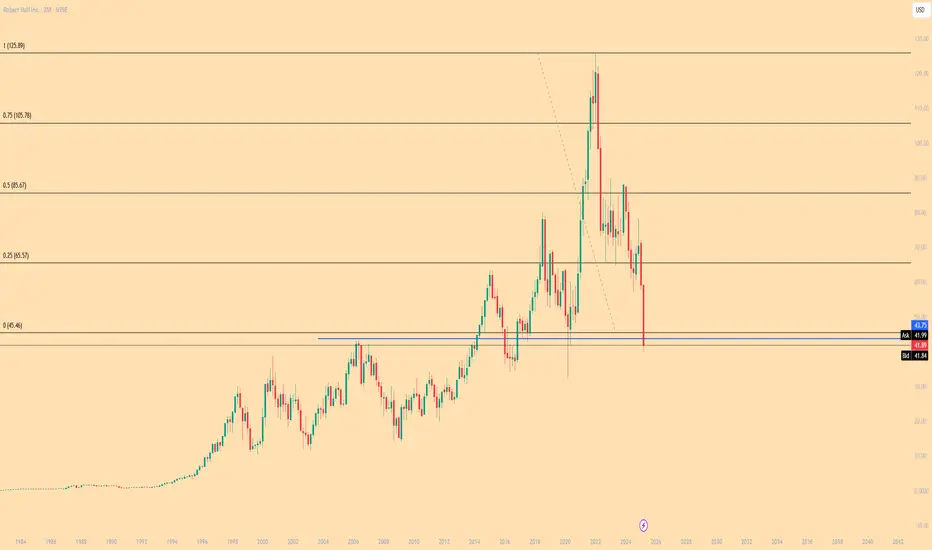
Another ABC corrective wave.Measured move, long term support and a significant ABC. I would long here.

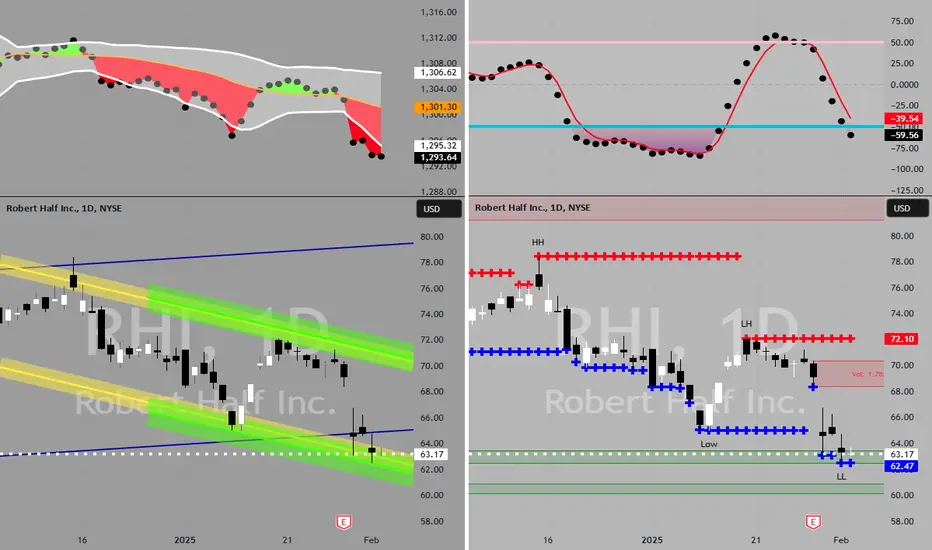
RHI to $68My trading plan is very simple.
I buy or sell when price tags the top or bottom of parallel channels.
I confirm when price hits Fibonacci levels.
So...
Here's why I'm picking this symbol to do the thing.
Price in channel zones at bottom of channels (period 100 52 & 26)
Stochastic Momentum Index (SMI) at oversold level
VBSM is spiked negative and under bottom of Bollinger Band
Entry at $63.17
Target is $68 or channel top
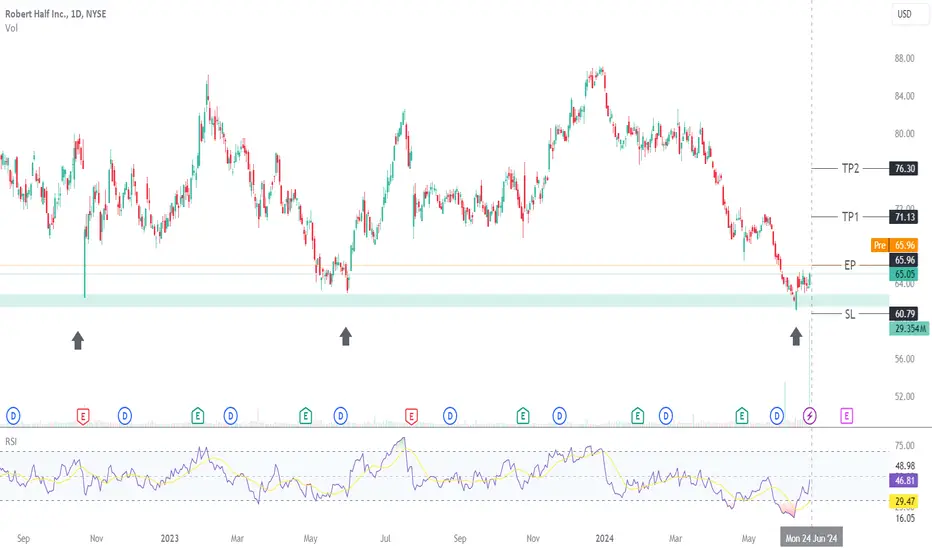
RHI at weekly supportReasons for bullish bias:
- Price is at weekly support
- Weekly bullish engulfing and hammer formation at support
- Volume Pump
- No divergence
Entry Level(CMP): 65.96
Stop Loss Level: 60.79
Take Profit Level 1: 71.13
Take Profit Level 2: 76.3
Take Profit Level 3: Open
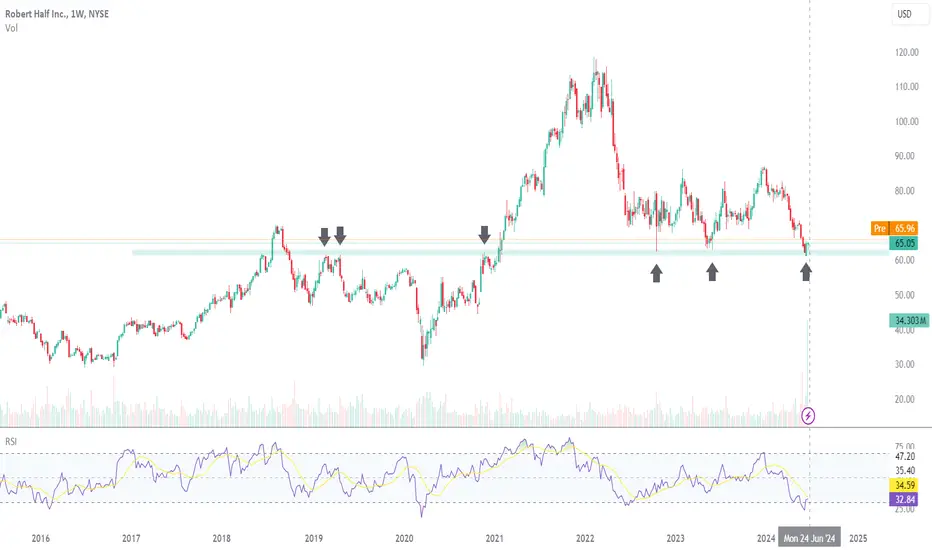
RHI weekly outlookRHI is at strong weekly support and bullish engulfing candle and hammer is also formed! Let's see!
5/30/24 - $rhi - detailed thinking: i'd remain greedier to buy.5/30/24 - vrockstar - NYSE:RHI - doing a follow up comment here given the stock now at 52wk lows and was flagged to me by a friend to take a look.
1) my valuation comments vs. the 4/25/24 comment don't change much. you're looking at a situation where it's a matter of where bottom EPS is and what lift off is from there. $3 of EPS seems low to me this yr, but is 3.5$ the trough? do we go to $4 or is it more like $4.5 next year. this matters - BUT - the problem is we don't have ANY visibility toward this and the macro holds all the cards, mgmt is simply steering the ship. so what multiple do you put on a scale but still-haven't-hit-cycle-bottom HIRING business? i'd posit 15x on $4 of EPS power remains generous, that's $60.
2) BUT we're in an environment that is being particular brutal to anything that's not mega-scaled-ai-will-eat-your-brains tech. and unfortunately even with net cash for RHI (that's a good factor), it's one of the marginal losers if we still get higher rates for longer, unemployment curve has JUST started to inflect. so the stock is anticipating this already - it's not as if this px correction hasn't happened at all.
3) looking back in history, you'd want to own this business anticipating the anticipation of the peak of unemployment. i'd argue that since we just started inflecting that UNLESS we get some sort of obvious pivot with gusto immediately (let's see what the jobs report brings next week - this could be a trading catalyst for a name like RHI), we can't even approximate what's going to happen.
4) vs. the SPY (do RHI/SPY) in trading view, we're at the most oversold readings in history. arguably the company remains on solid balance sheet footing, but it faces the above challenges AND consider the type of roles it helps hire for are becoming more and more consolidated into AI-at-risk-replacements in the coming cycle. while i'd argue it will take wall street a while to figure this out, i don't think RHI is a 10Y compounder. we play this just one more cycle.
5) i've set a greedy target to own this in the low GETTEX:50S , but have a flag set to begin a 50 bps starter position at ~$55. I still don't want to buy it today given my oppty set, $60 still seems like a compromise per the above (and considering if we get there - we also probably have a bunch of other companies on my short list I prefer). So bc it's not a "must own" name for me, my thinking on compounded for a long-term being low conviction - i need a good entry.
GL to the holders. lmk if you think differently. hope this helps frame thinking as we enter the balance of the year on this name.
-V
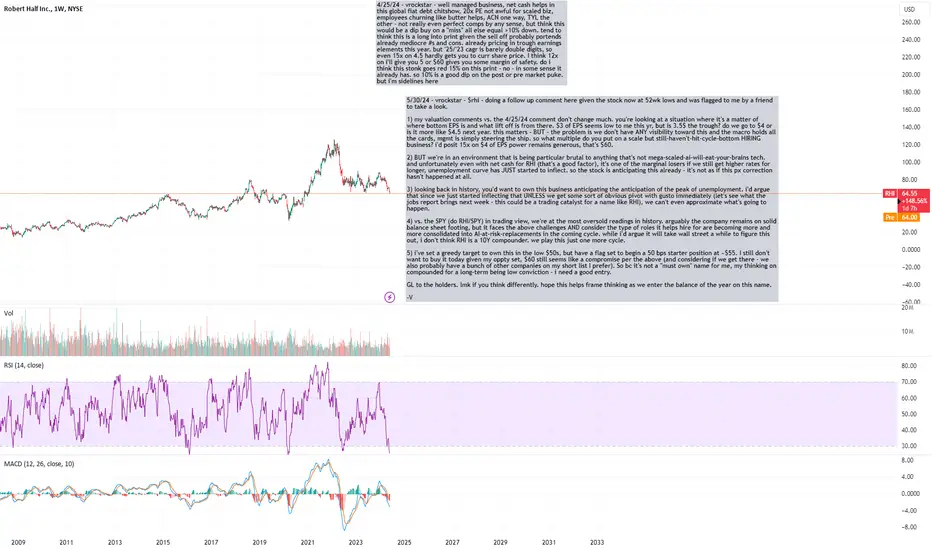
4/25/24 - $rhi print - +ve bias but only dip byr - vrockstar4/25/24 - vrockstar - well managed business, net cash helps in this global fiat debt chitshow, 20x PE not awful for scaled biz, employees churning like butter helps, ACN one way, TYL the other - not really even perfect comps by any sense, but think this would be a dip buy on a "miss" all else equal >10% down. tend to think this is a long into print given the sell off probably portends already mediocre #s and cons. already pricing in trough earnings elements this year. but '25/'23 cagr is barely double digits, so even 15x on 4.5 hardly gets you to curr share price. I think 12x on i'll give you 5 or $60 gives you some margin of safety. do i think this stonk goes red 15% on this print - no - in some sense it already has. so 10% is a good dip on the post or pre market puke. but i'm sidelines here

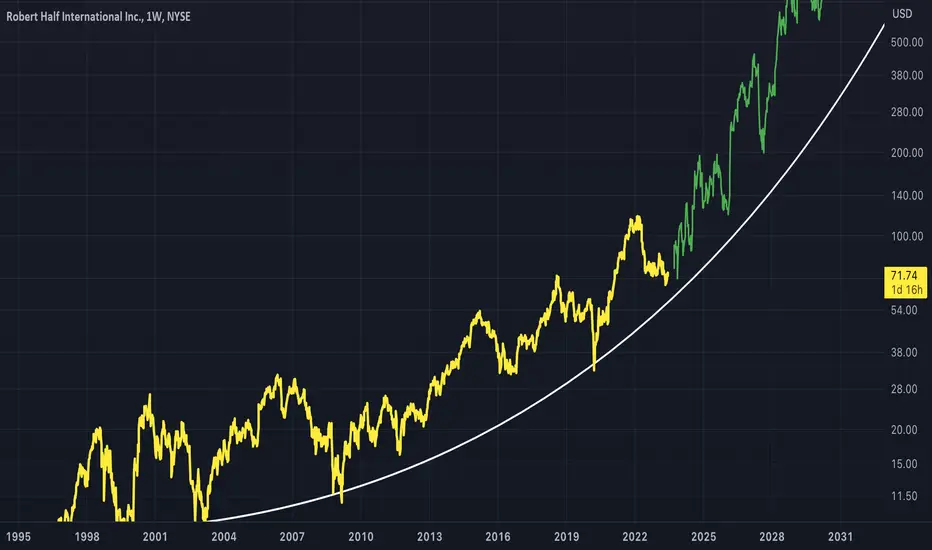
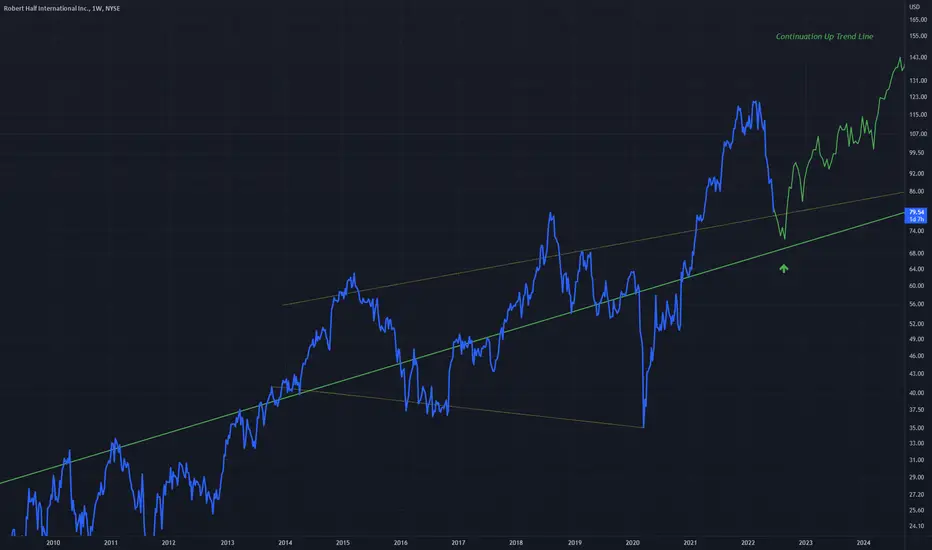
RHI - Might Take OffAn idea showing a curved trend on the log chart weekly.
Price may possibly continue up the curve as it gets closer to vertical.
As it climbs volatility may increase.
Bullish.
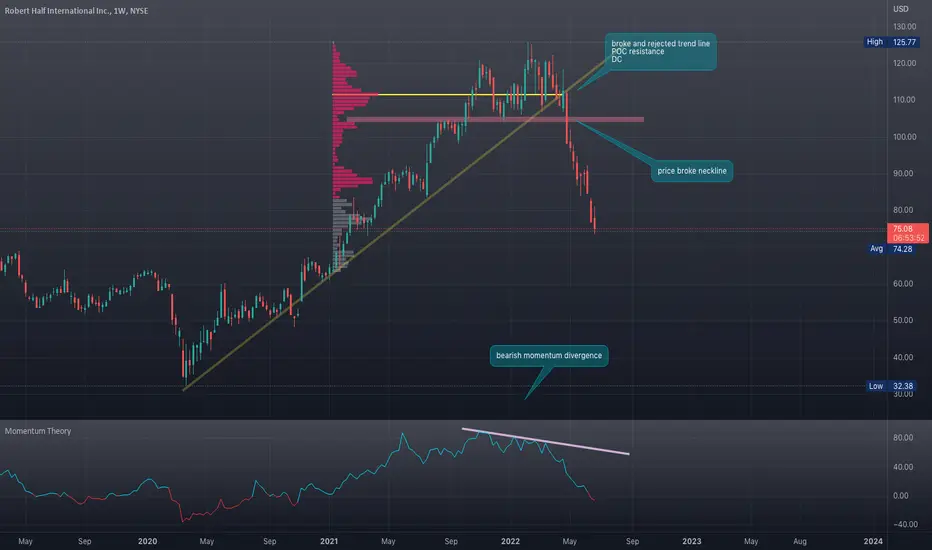
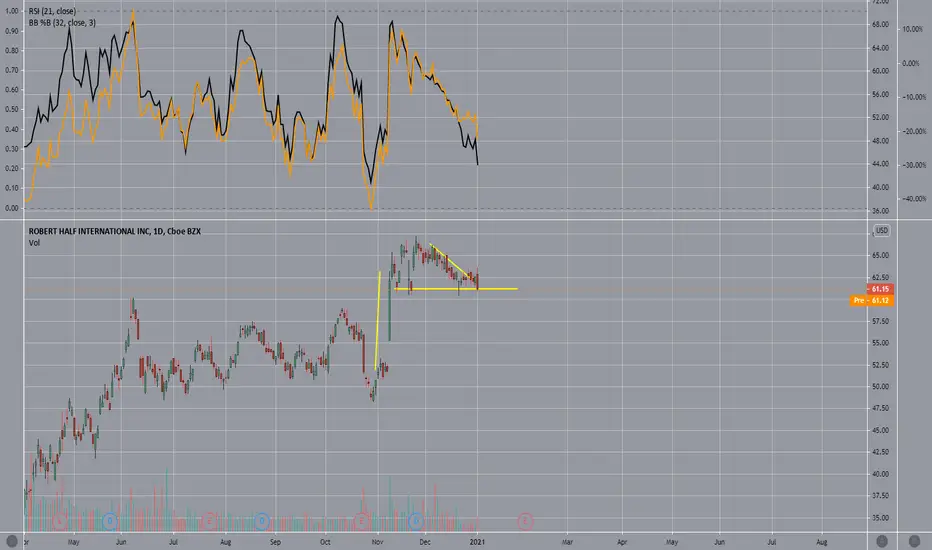
REVIEW $RHIBearish
Fundamental
- Funds distributing
- Decent earnings
TA
- Bearish momentum divergence
- Momentum diving
- Broke trendline
- Rejected trendline
- Rejected POC
- Broke neckline
- DC
RHI - Breakout Above FormationPrice has broken out of this wedge formation, and it is also above the major up trend line (in green)
Price will continue up the green trend line
Bullish above the current formations upper trend line
US Stock In Play: $RHI$RHI a 2021 market darling until the last week of November, where it undercut its 50MA for the rest of the year. currently established a higher low with cup and handle pattern. weekly chart, it capture back its 10MA for the first time in 7 weeks.
actionable trade for today
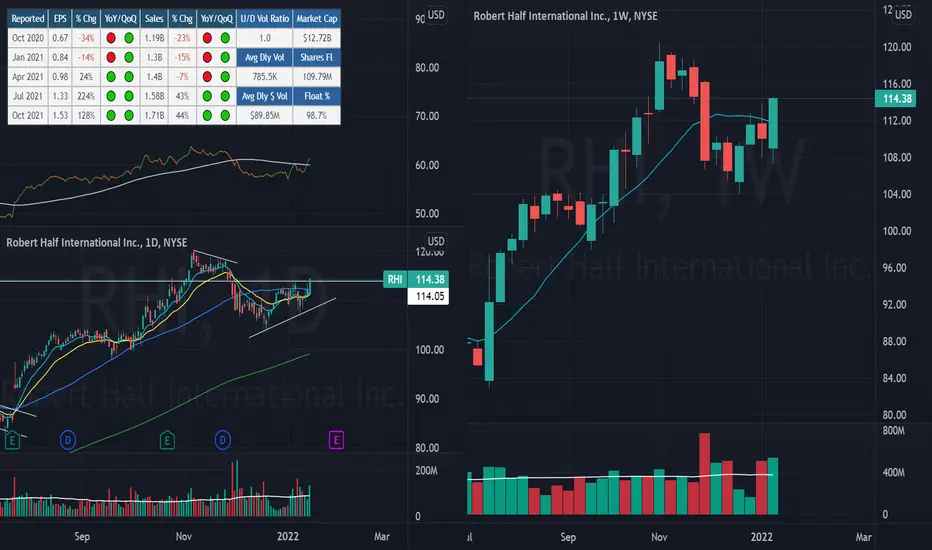
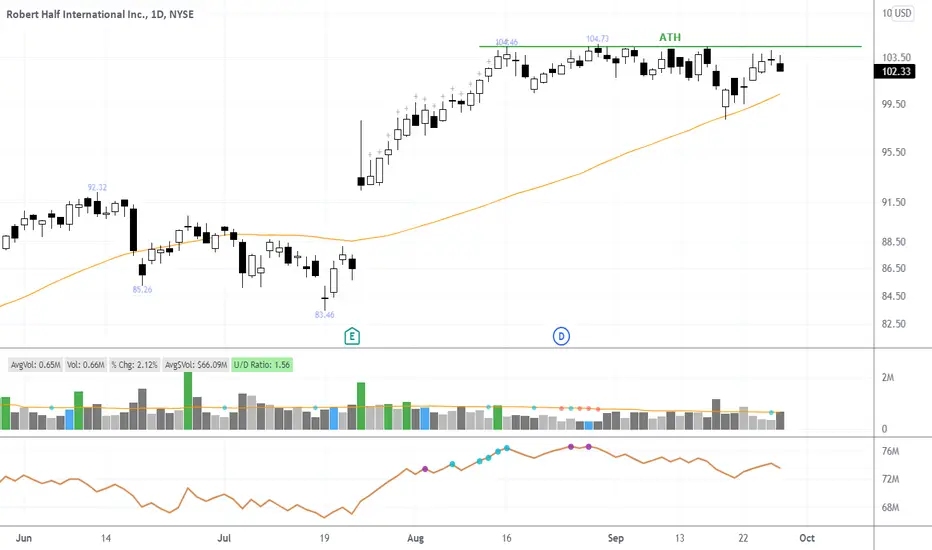
$RHI to head higher after breaking out of a tight 3week range?* Great earnings
* Very strong up trend
* High 3-month relative strength of 1.41 in the Healthcare sector
* High U/D volume ratio of 1.51
* Breaking out of a very tight 3 week consolidation of ~3.85% with higher than average volume
* If you have access to Volume Profiles you can see that the $113.04 area has tonnes of volume.
* We can expect the $113.04 area to serve as support moving forward.
Trade Idea:
* Looking at the weekly, this seems like a great time to enter as it's recovering from the pull back.
* If you are looking for a better entry you can wait for an opportunity around the $113 area as that should serve as support moving forward.

Go to the ATH!Do NOT buy now! In the case of a return to the support level, we buy with a target in the area of . Technically a very good picture will turn out.
❤️ If you find this helpful and want more FREE forecasts in TradingView
. . . . . Please show your support back,
. . . . . . . . Hit the 👍 LIKE button,
. . . . . . . . . . . Drop some feedback below in the comment!
❤️ Your Support is very much 🙏 appreciated!❤️
💎 Want us to help you become a better Stock trader?
Now, It's your turn!
Be sure to leave a comment let us know how do you see this opportunity and forecast.

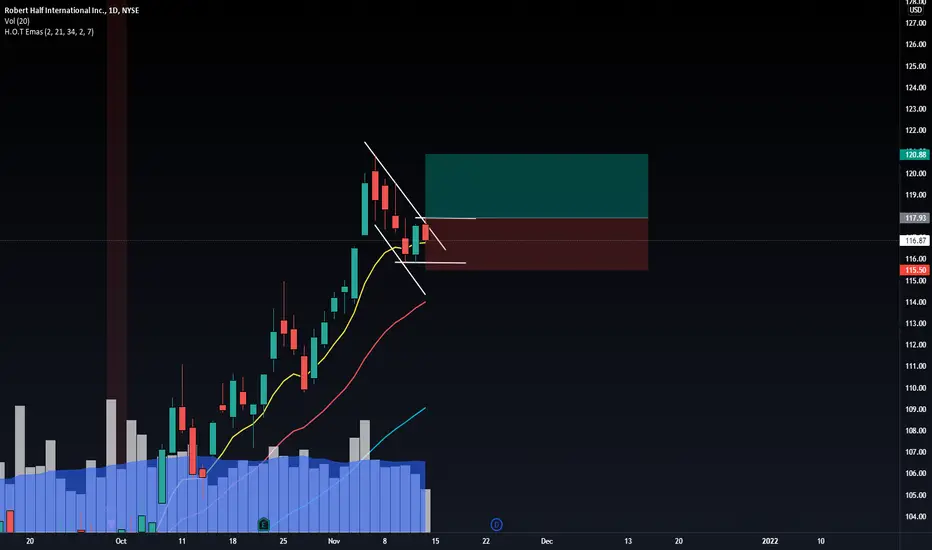
RHI Keeps going
Flagging after massive run,
Also making new H.H , H.L
Watching it above 117.90 / 118

RHI Earnings Flag setting up for a Blue Sky BreakoutRHI Earnings Flag setting up for a Blue Sky Breakout up through $105 in time

$RHI Potential Breakout Into ATHsWhile many broken setup were axed out of my watchlist, new merchandise is making its way in.
$RHI with great setup that help up like a champ today. Will be breaking out into All Time Highs (ATH)
ROBERT HALF INTERNATIONAL Idea DailyHello traders, ROBERT HALF INTERNATIONAL is in a false bearish push with low sell volume made and a hammer candle shape. The TIMEFRAME M1 we see a kind of marubozu provided with a shadow with a high volume of purchase issued, it goes to the base of the bollinger to test it. Then the same VWAP before coming on the top of the bollinger and going on the top of the stabilization zone. Great potential for price breakout with the return of buying volume then at the same time zone the zone and reach the next one and land on the last higher. To come on the last one with three higher in front adjustment (on MULTI TIMEFRAME H4 and H1). Not enough buying force to test the middle mid-half of ANDREWS PITCHFORK.
Please LIKE & FOLLOW, thank you!

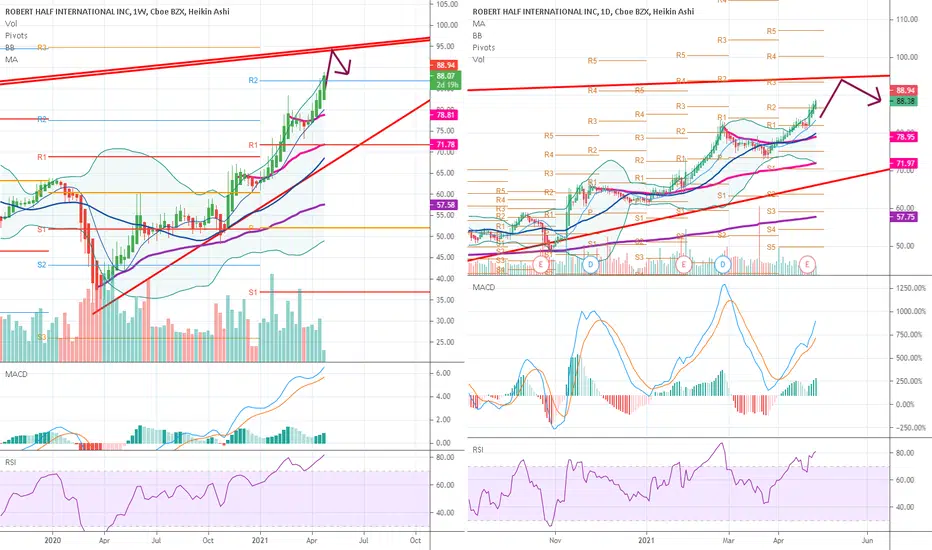
$RHI descending triangles on weekly #chart #tradingBeautiful weekly chart here for $RHI
Stock has formed the first descending triangle in 2018 (bottom line support is the FEB'18 low and top of the triangle is the AUG'18 high)
After the DEC'18 correction stock is forming a second descending triangle ( DEC'18 support line and APR'19 high top of the triangle)
Price action last week saw the breakout from the first triangle on the back of good earnings report and yesterday on the back of the strong overall market the stock is trying to breakout from the second triangle
MACD and RSI both support the move up
Ideally look for a close this week above the descending line of the second triangle to participate
Targets:
T1 - measured move from the small triangle around 75.44
T2 - measured move from the big triangle around 84.86
Good luck,
TA
