AUDNZD Technical + Fundamental Align for DownsideToday I want to analyze a short position on the AUDNZD ( OANDA:AUDNZD ) pair, first, let's look at it from a fundamental analysis perspective .
Fundamental View on AUDNZD
Key reasons to short AUDNZD:
Australian weakness:
Recent data show weakening consumer sentiment and declining building approvals. The RBA seems hesitant to hike further, putting pressure on the Aussie.
New Zealand resilience:
The RBNZ maintains a relatively hawkish stance. Inflation is still a concern, and the central bank is committed to keeping rates high, supporting NZD strength.
Monetary policy divergence:
The divergence between RBA’s dovish stance and RBNZ’s hawkish approach supports further downside in AUDNZD.
----------------------
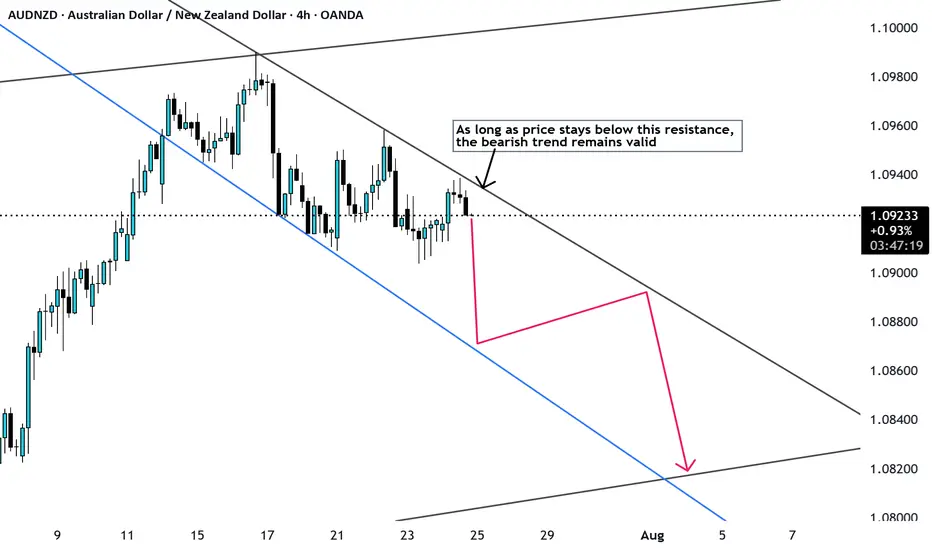
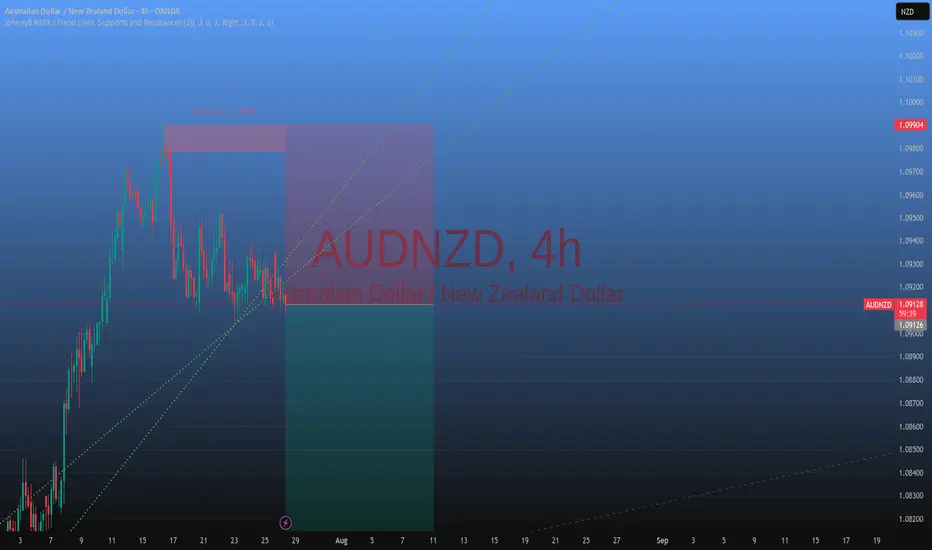
Now let's take a look at AUDNZD from a technical analysis perspective on the 4-hour timeframe .
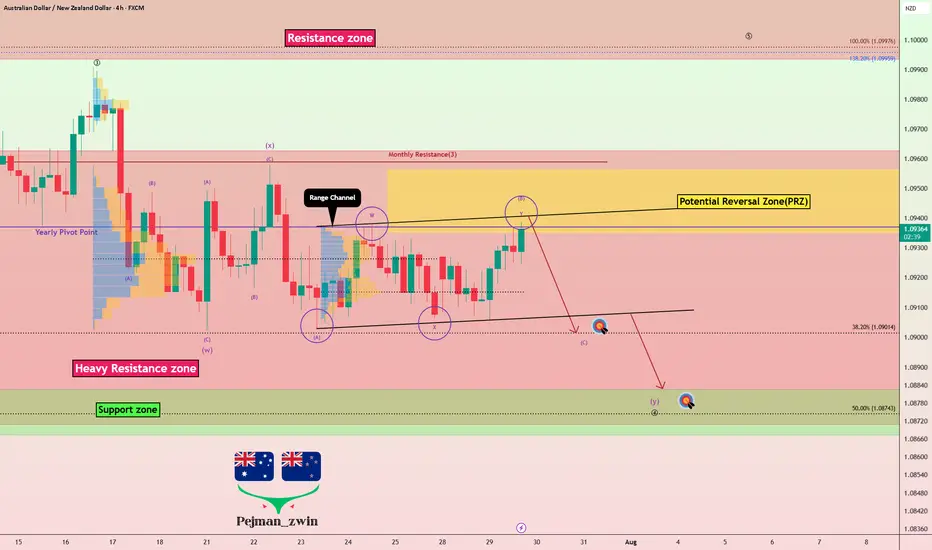
AUDNZD is currently trading in a Heavy Resistance zone(1.0963 NZD-1.0870 NZD) near the upper line of the Range Channel , Potential Reversal Zone(PRZ) and Yearly Pivot Point .
In terms of Elliott Wave theory , AUDNZD appears to be completing microwave B of microwave Y of the main wave 4 .
I expect AUDNZD to drop to at least 1.0904 NZD(First Target) based on the above explanation .
Second Target: 1.0886 NZD
Note: Stop Loss(SL): 1.0963 NZD
Please respect each other's ideas and express them politely if you agree or disagree.
Australian Dollar/New Zealand Dollar Analyze (AUDNZD), 4-hour time frame.
Be sure to follow the updated ideas.
Do not forget to put a Stop loss for your positions (For every position you want to open).
Please follow your strategy and updates; this is just my Idea, and I will gladly see your ideas in this post.
Please do not forget the ✅' like '✅ button 🙏😊 & Share it with your friends; thanks, and Trade safe.
NZDAUD trade ideas
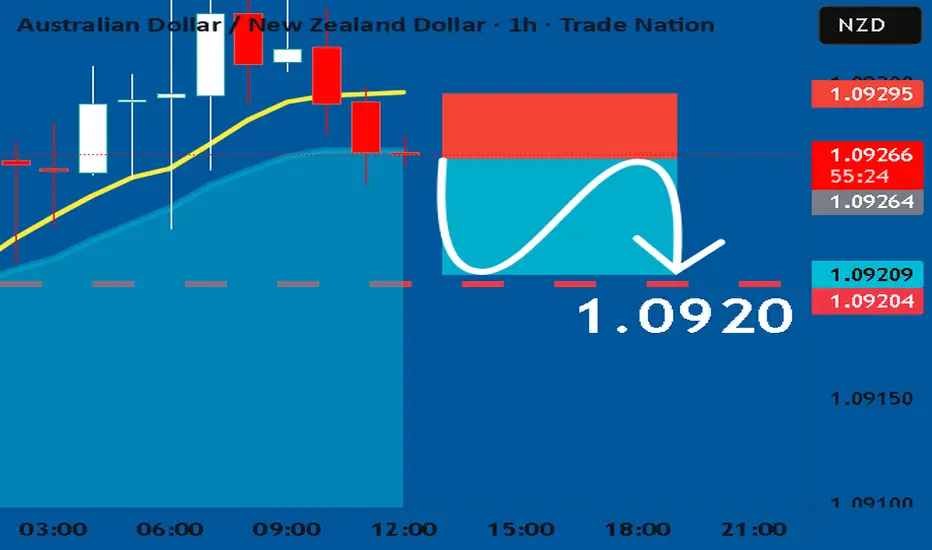
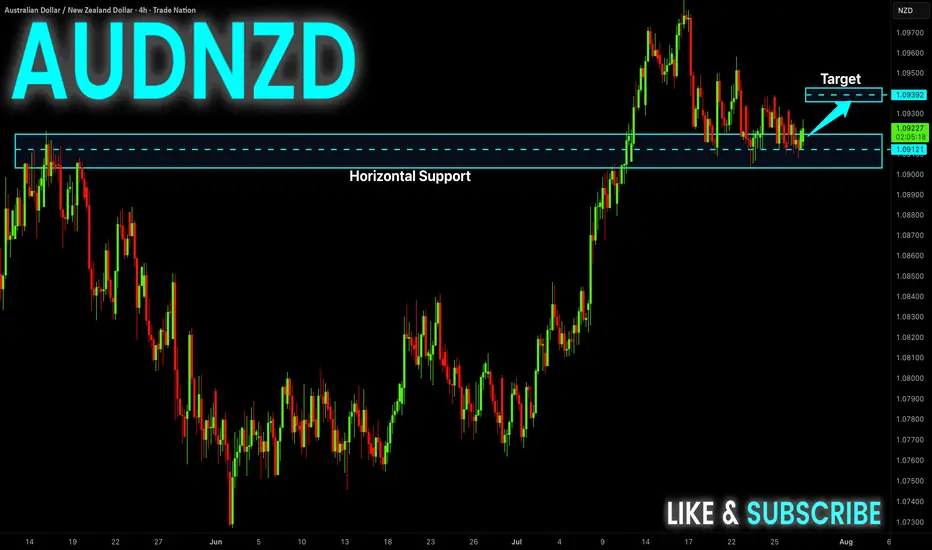
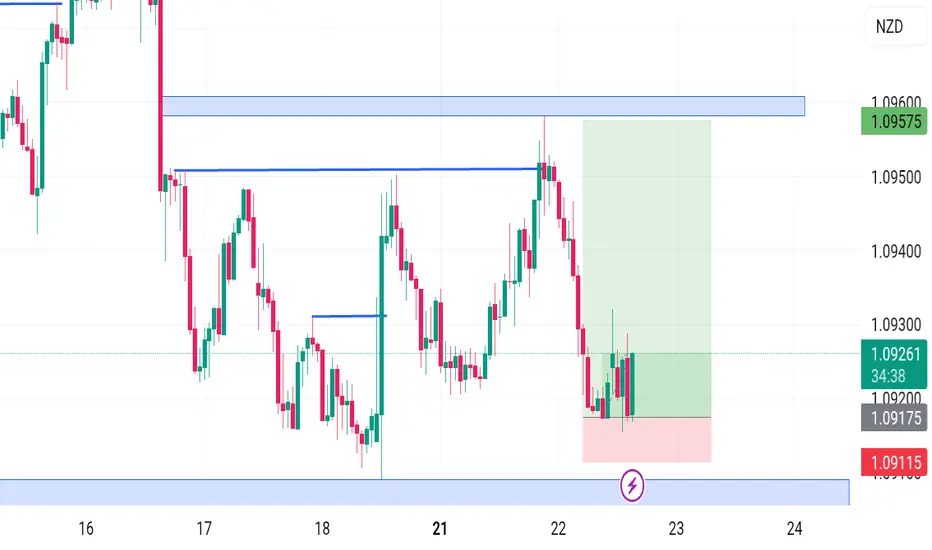
AUDNZD: Short Signal Explained
AUDNZD
- Classic bearish formation
- Our team expects fall
SUGGESTED TRADE:
Swing Trade
Sell AUDNZD
Entry Level - 1.0926
Sl - 1.0929
Tp - 1.0920
Our Risk - 1%
Start protection of your profits from lower levels
Disclosure: I am part of Trade Nation's Influencer program and receive a monthly fee for using their TradingView charts in my analysis.
❤️ Please, support our work with like & comment! ❤️
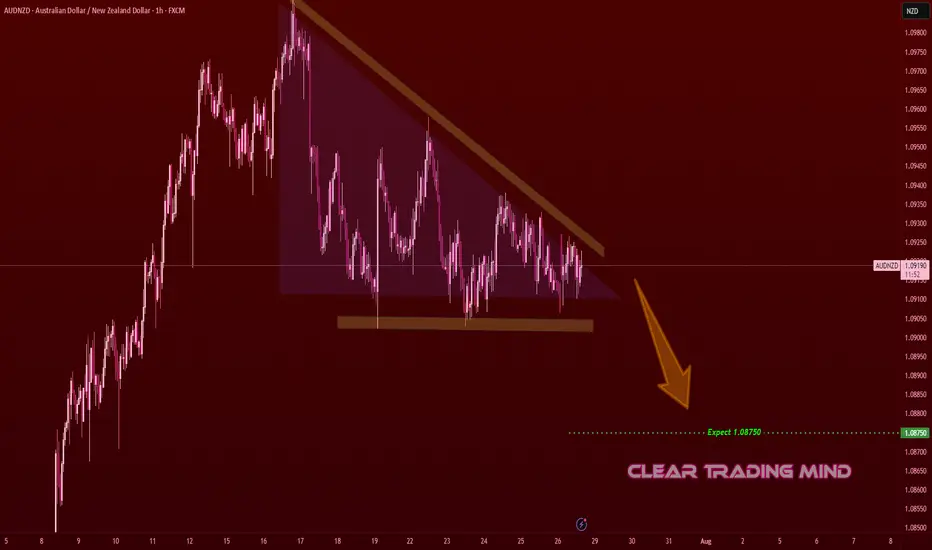
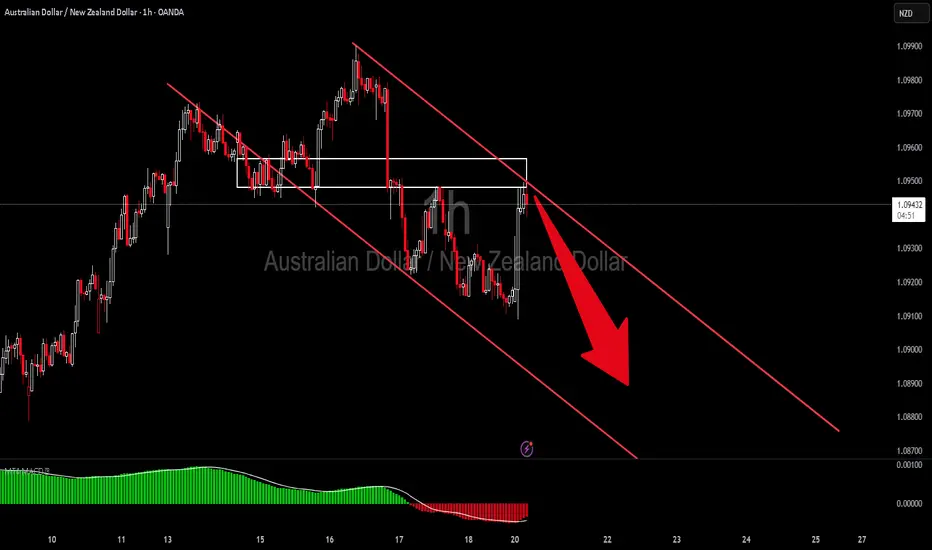
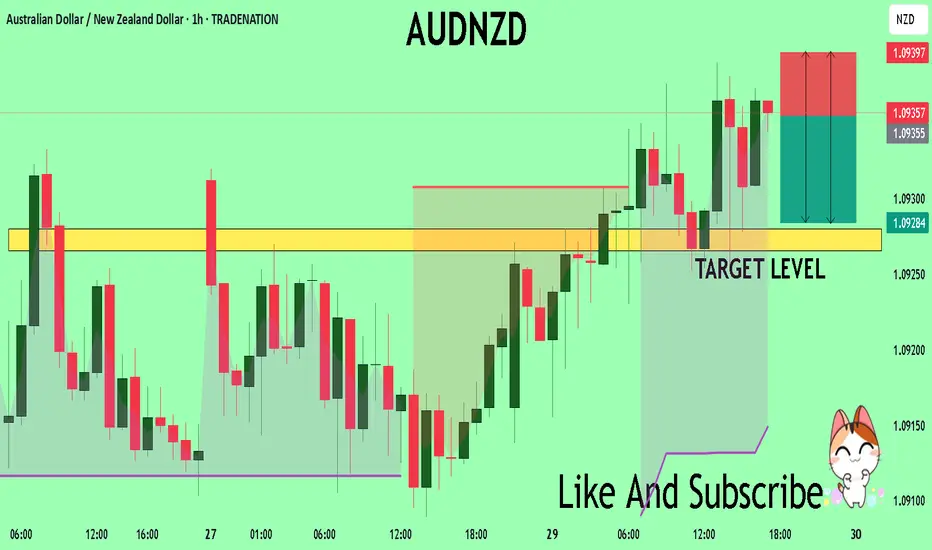
AUDNZD Descending Triangle – Bearish Breakout SetupOn the 1-hour chart, AUDNZD is forming a descending triangle 📐, a bearish continuation pattern.
- Horizontal support is holding but getting repeatedly tested
- Lower highs indicate selling pressure
Plan:
- Break and close below support may trigger a bearish continuation
- Target: 1.08750 🎯 (≈ 35 pips from current price)
- Invalidation if price breaks above descending trendline and holds
Reasoning:
- Descending triangle often leads to breakdowns when tested multiple times
- Lower highs show sellers gaining control
- Short bias remains as long as price respects the triangle resistance
(Personal chart study, not financial advice)
AUD-NZD Rebound Ahead! Buy!
Hello,Traders!
AUD-NZD made a retest
Of the wide horizontal support
Level again at 1.0909 and we
Are already seeing a bullish
Reaction so a local bullish
Rebound can be expected
Buy!
Comment and subscribe to help us grow!
Check out other forecasts below too!
Disclosure: I am part of Trade Nation's Influencer program and receive a monthly fee for using their TradingView charts in my analysis.
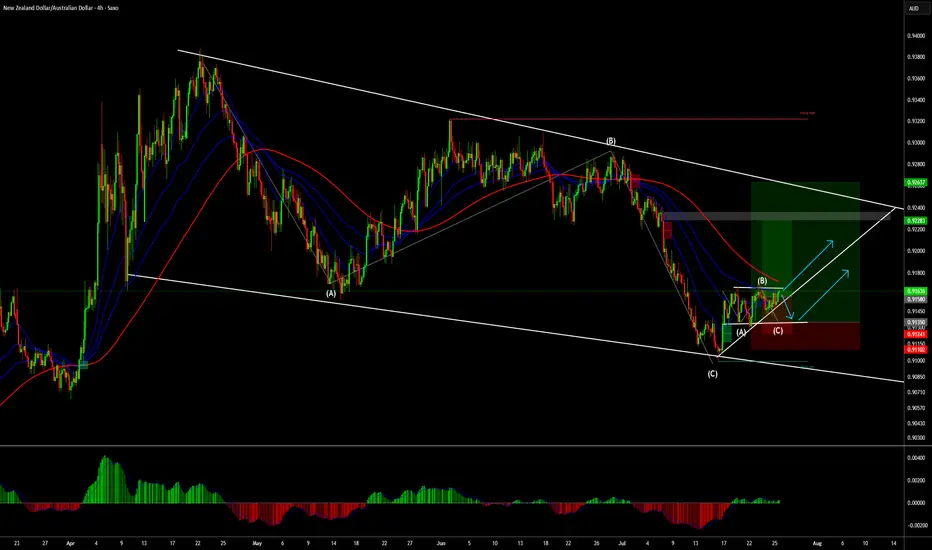
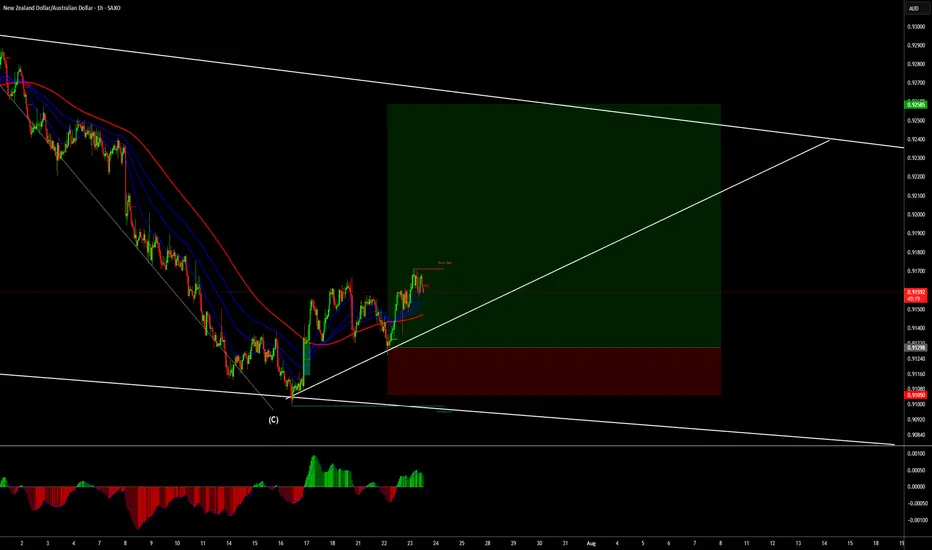
NZD/AUD update for the weekend and trade management ideas.Both the main and add-on positions are in a secure spot and can be protected by tightening the stop loss if one chooses. In the longer-term picture, the analysis is the same. I am expecting this to complete the push to the top of this channel. We could exit now around 1.7 : 1 RR. Not bad for a trade taken a couple days ago, but I like the hold here personally.
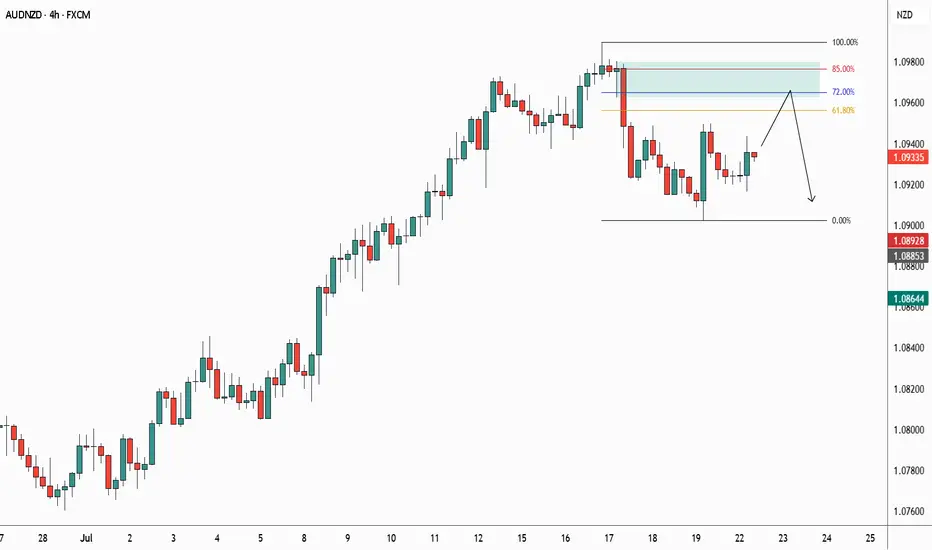
AUDNZD Short-sell IdeaAfter price made a BOS (Break of Structure), it entered a correction phase. Possibly we are looking at a short around the supply zone.
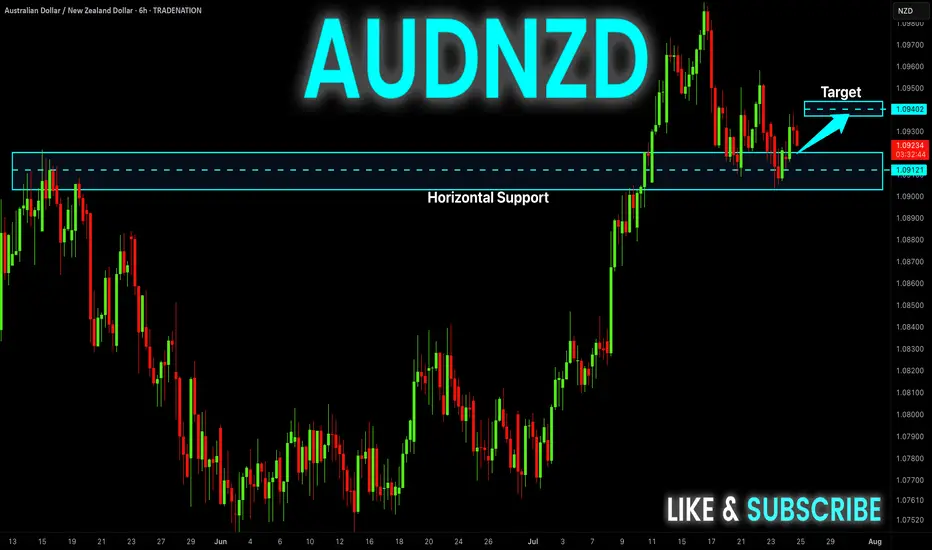
AUD-NZD Local Long! Buy!
Hello,Traders!
AUD-NZD is about to retest
A strong horizontal support
Level of 1.0912 and as we are
Bullish biased we will be expecting
A local bullish rebound
Buy!
Comment and subscribe to help us grow!
Check out other forecasts below too!
Disclosure: I am part of Trade Nation's Influencer program and receive a monthly fee for using their TradingView charts in my analysis.
AUDNZD Channel Trading Scenario AUDNZD is Trading down trend and the Price rejected from he recent resistance trendline and is likely go down.
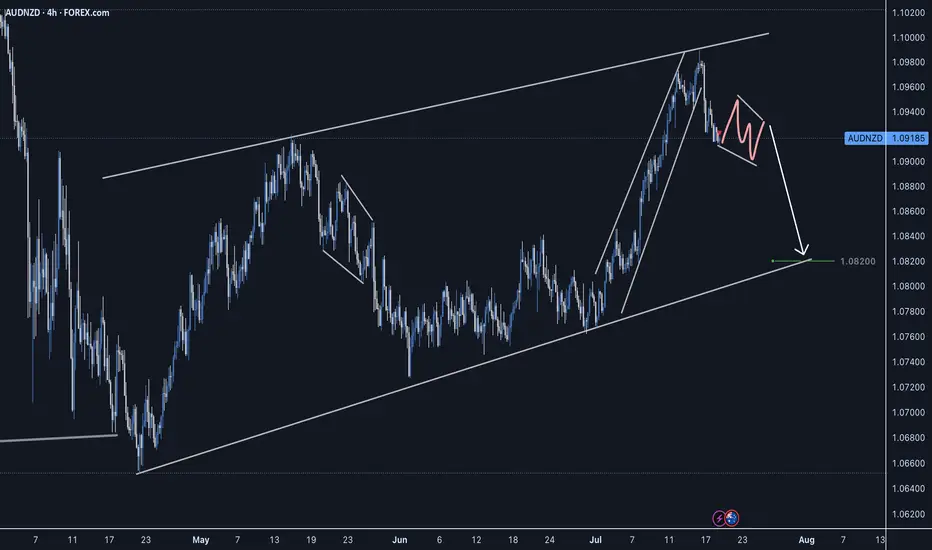
AUDNZD Forming Rising Wedge PatternAUDNZD has formed a textbook rising wedge pattern on the 8H chart and has now broken to the downside, signaling potential bearish continuation. This setup typically indicates a loss of momentum in the prevailing bullish trend, and with the clean structure break now confirmed, the bears seem ready to take control. I’ve already entered short positions from the top edge of the pattern and am currently floating in profit, anticipating further downside toward the 1.0780–1.0800 zone.
From a fundamental perspective, the Australian dollar has been relatively stable but lacks a strong bullish catalyst at this point. The Reserve Bank of Australia is holding a cautious tone amid mixed inflation signals, while New Zealand’s economy is showing signs of potential resilience. The RBNZ remains committed to tighter monetary conditions for longer as inflation continues to hover above their comfort zone, which provides some support to NZD in the near term.
Technically, the break of the lower wedge support is significant. Price failed to sustain higher highs near 1.1000 and quickly retraced, showing bearish rejection. With the RSI diverging and volume fading near the top of the wedge, this was a high-probability reversal zone. As long as price stays below 1.0950, the bias remains bearish, and further sell pressure is expected.
I'm targeting 1.0780 as the next key liquidity level. It aligns with previous structure support and provides a favorable risk-to-reward setup. This setup is a clear example of price-action-driven reversal trading, paired with macroeconomic alignment. I’ll continue to trail stops as price progresses, but so far, AUDNZD is playing out exactly as anticipated.

NZD/AUD We were at the bottom of a longer term ABC correction, so on the one-hour we waited for the impulse which we got around 7/16 and then the correction which ended on 7/22 at the trendline. Trade entered on 15 minute time frame, and it is timeto move the stop loss to break even.
AUDNZD finding support on critical EMAsAUDNZD is finding support at the daily 200EMA (overlayed on 4H chart) and, more significantly, above the monthly 20EMA (overlayed). Break and hold the daily 10EMA (overlayed) will be key.
If the momentum continues we could see a continuation of the ongoing rally however recent AUD monetary policy meeting minutes seemed to lean dovish.
I'm a cat not a financial advisor.

BULLISH BIASPrice previously broke upper structure to form new high before a pullback to support to sweep liquidity.
Right now, support having been touched became a demand zone pushing price up.
Price incidentally came back down to it's present zone to form double bottom which right now is a goid place to enter buy and target new high as take profit.
audnzd long trade in my opinion this is a good trade with a good r/r hope hit the tp consider this is my trade not your trade and i just like to share my trades with world
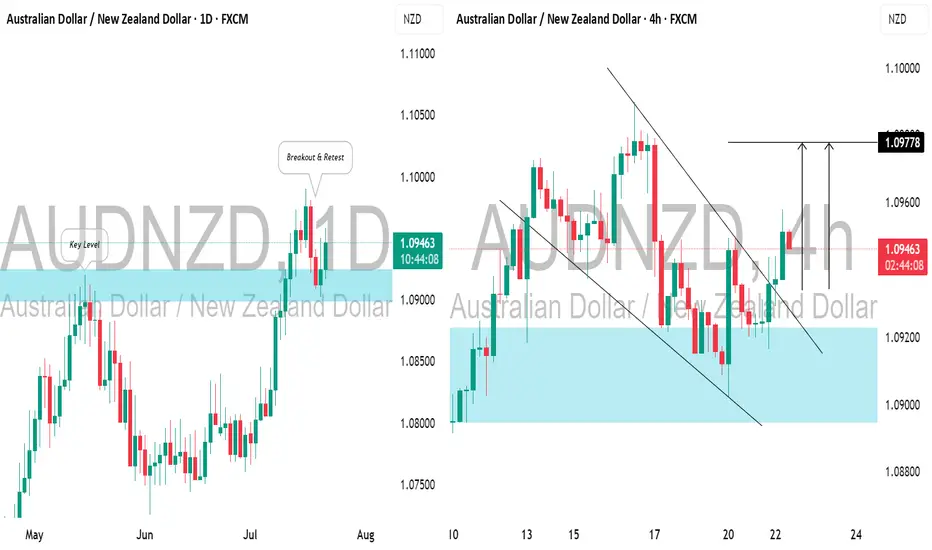
AUDNZD: Bullish Move After Breakout📈AUDNZD has surpassed and closed above a key horizontal daily resistance level.
After retesting this broken structure, the price rebounded and broke above a resistance line of a falling wedge pattern, suggesting a strong likelihood of a bullish trend resumption.
The price is expected to reach the 1.0977 level soon.
AUDNZD Short Setup - CAB EntrySellers stepping in, strong reversal impulse. Waiting for a slight correction before taking a short entry on the LTF.
Good Luck
AUD/NZDAccording to the COT report this pair is selling this week with a break of a support zone which is now a major resistance zone.
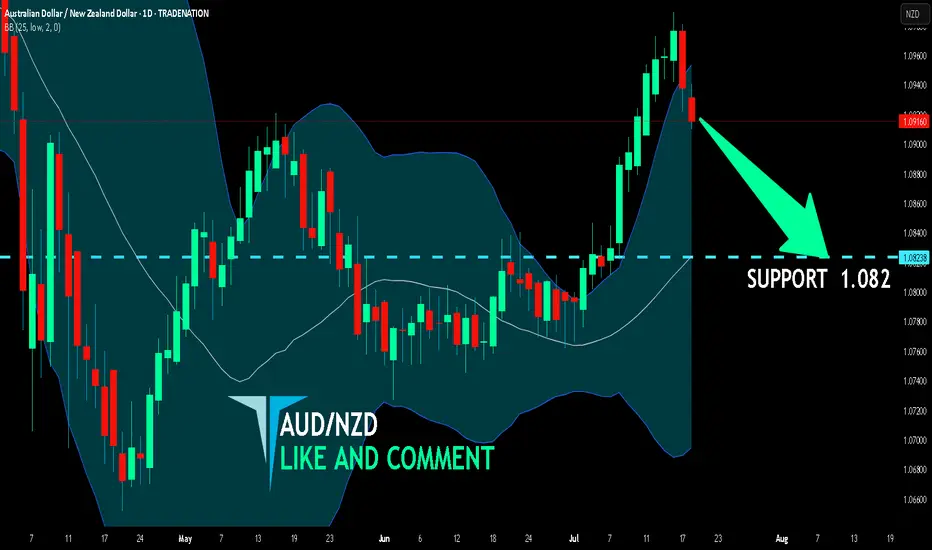
AUD/NZD SHORT FROM RESISTANCE
Hello, Friends!
The BB upper band is nearby so AUD/NZD is in the overbought territory. Thus, despite the uptrend on the 1W timeframe I think that we will see a bearish reaction from the resistance line above and a move down towards the target at around 1.082.
Disclosure: I am part of Trade Nation's Influencer program and receive a monthly fee for using their TradingView charts in my analysis.
✅LIKE AND COMMENT MY IDEAS✅
AUDNZD still bullish trend expecting
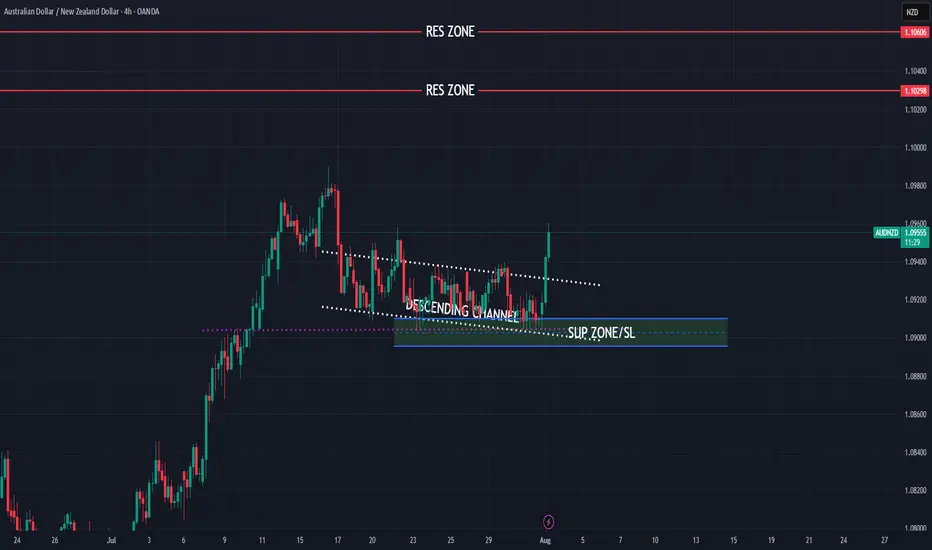
OANDA:AUDNZD last five analysis accurate (attached), here is new view on AUDNZD, still bullish expecting, price is not break strong zone, bouncing - pushing strongly from same, looks like DESCENDING CHANNEL is breaked.
Here still bullish expectations having.
SUP zone: 1.09100
RES zone: 1.10300, 1.10600
AUDNZD Technical Analysis! SELL!
My dear friends,
AUDNZD looks like it will make a good move, and here are the details:
The market is trading on 1.0935 pivot level.
Bias - Bearish
Technical Indicators: Supper Trend generates a clear short signal while Pivot Point HL is currently determining the overall Bearish trend of the market.
Goal - 1.0928
Recommended Stop Loss - 1.0939
About Used Indicators:
Pivot points are a great way to identify areas of support and resistance, but they work best when combined with other kinds of technical analysis
Disclosure: I am part of Trade Nation's Influencer program and receive a monthly fee for using their TradingView charts in my analysis.
———————————
WISH YOU ALL LUCK
Trade management for NZD/AUDThe US-EU trade deal boosted USD demand and jolted FX markets at the open. This, coupled with low liquidity during the Monday Asian session caused a gap in this pair. Our short term trade was taken out at break even, while our medium term trade narrowly survived. This was a technical play in an odd pair, opportunistic while doing some charting :) I took profit at 1:1 and will wait to deploy capital elsewhere.

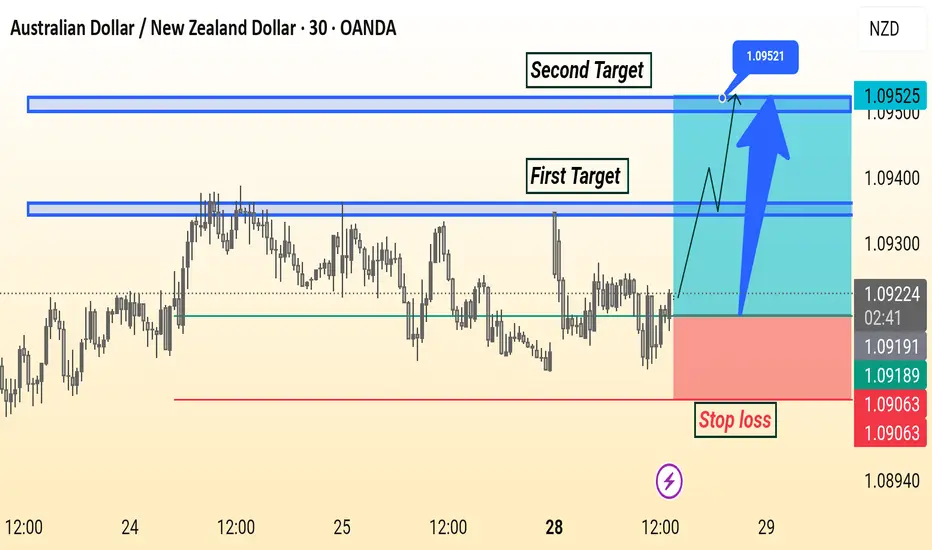
AUD/NZD Analysis is Ready Move Will Be Fly This AUD/NZD 30-minute chart shows a bullish setup with entry around 1.09216. The first target is near 1.09400 and the second target is at 1.09521. A stop loss is placed below support at 1.09063. The analysis suggests a potential upward move after a breakout.
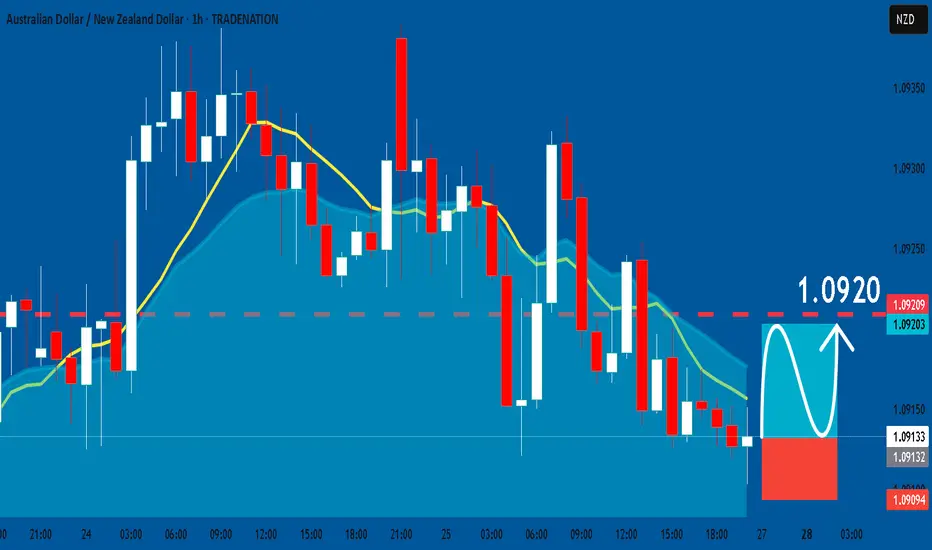
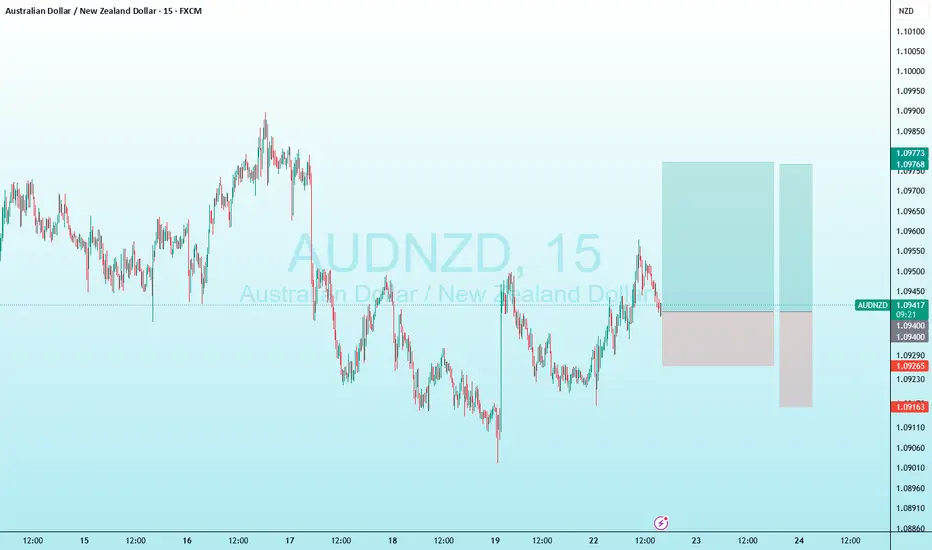
AUDNZD: Bullish Continuation & Long Trade
AUDNZD
- Classic bullish formation
- Our team expects growth
SUGGESTED TRADE:
Swing Trade
Buy AUDNZD
Entry Level - 1.0913
Sl - 1.0909
Tp - 1.0920
Our Risk - 1%
Start protection of your profits from lower levels
Disclosure: I am part of Trade Nation's Influencer program and receive a monthly fee for using their TradingView charts in my analysis.
❤️ Please, support our work with like & comment! ❤️