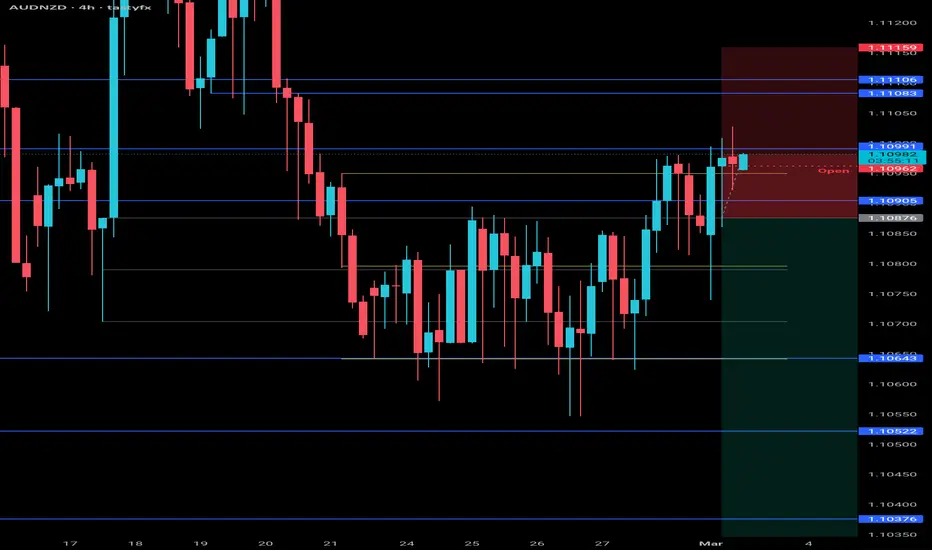
AUDNZD Buying SetupAUDNZD Buying Setup Based on Strong SNR levels being respected my Current Market. Accordingly SL and TP is choosen with tight risk management.
NZDAUD trade ideas
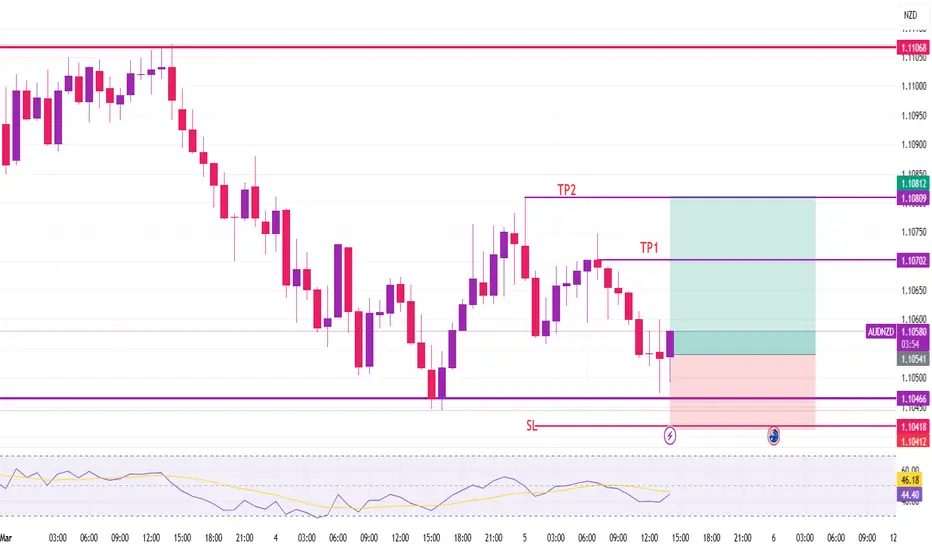
AUDNZD BUY (GDP Came Positive)AUDNZD shows a positive momentum with the news of GDP came as 0.6% Q/Q.
Entry is taken slightly above previous HL.
SL Previous LL.
TP 1:1 and 1:2
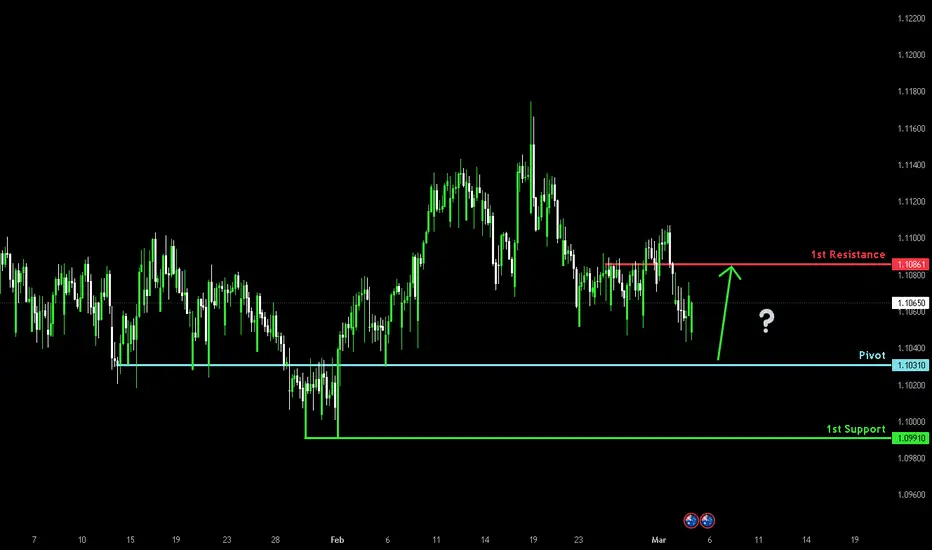
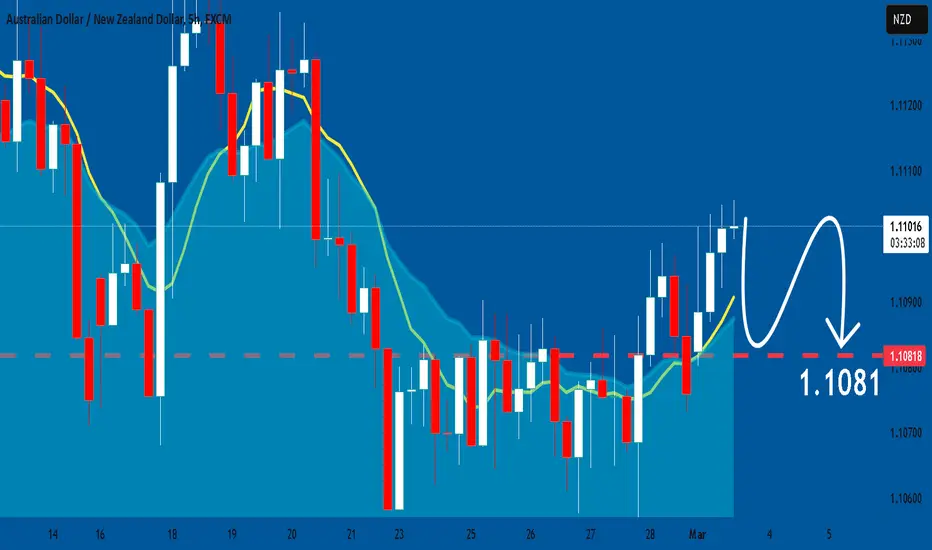
Bullish bounce?AUD/NZD is falling towards the pivot and could bounce to the 1st resistance.
Pivot: 1.1031
1st Support: 1.0991
1st Resistance: 1.1086
Risk Warning:
Trading Forex and CFDs carries a high level of risk to your capital and you should only trade with money you can afford to lose. Trading Forex and CFDs may not be suitable for all investors, so please ensure that you fully understand the risks involved and seek independent advice if necessary.
Disclaimer:
The above opinions given constitute general market commentary, and do not constitute the opinion or advice of IC Markets or any form of personal or investment advice.
Any opinions, news, research, analyses, prices, other information, or links to third-party sites contained on this website are provided on an "as-is" basis, are intended only to be informative, is not an advice nor a recommendation, nor research, or a record of our trading prices, or an offer of, or solicitation for a transaction in any financial instrument and thus should not be treated as such. The information provided does not involve any specific investment objectives, financial situation and needs of any specific person who may receive it. Please be aware, that past performance is not a reliable indicator of future performance and/or results. Past Performance or Forward-looking scenarios based upon the reasonable beliefs of the third-party provider are not a guarantee of future performance. Actual results may differ materially from those anticipated in forward-looking or past performance statements. IC Markets makes no representation or warranty and assumes no liability as to the accuracy or completeness of the information provided, nor any loss arising from any investment based on a recommendation, forecast or any information supplied by any third-party.
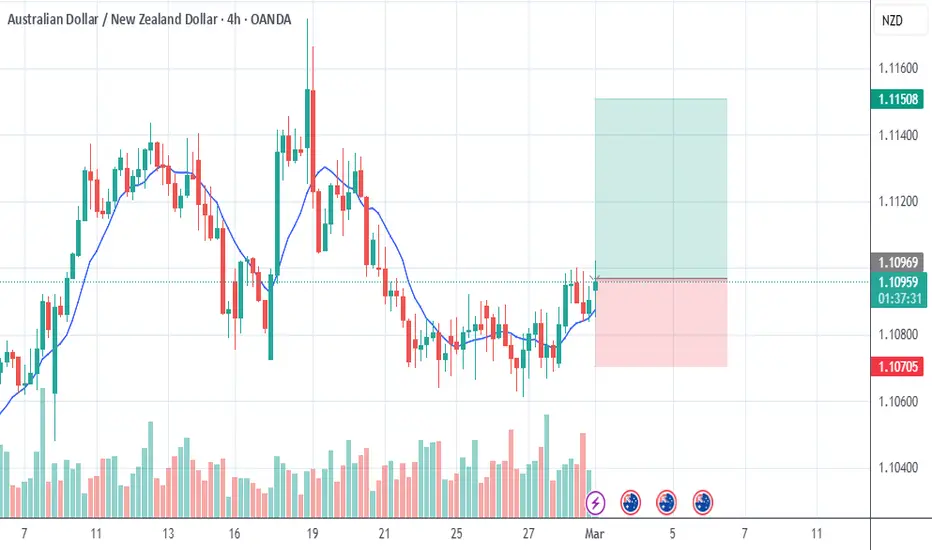
AUD_NZD RISKY LONG|
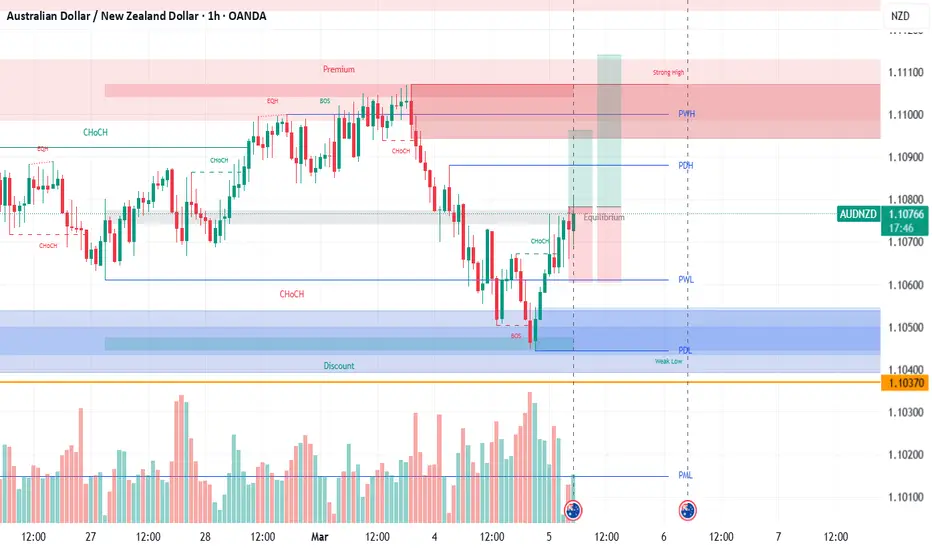
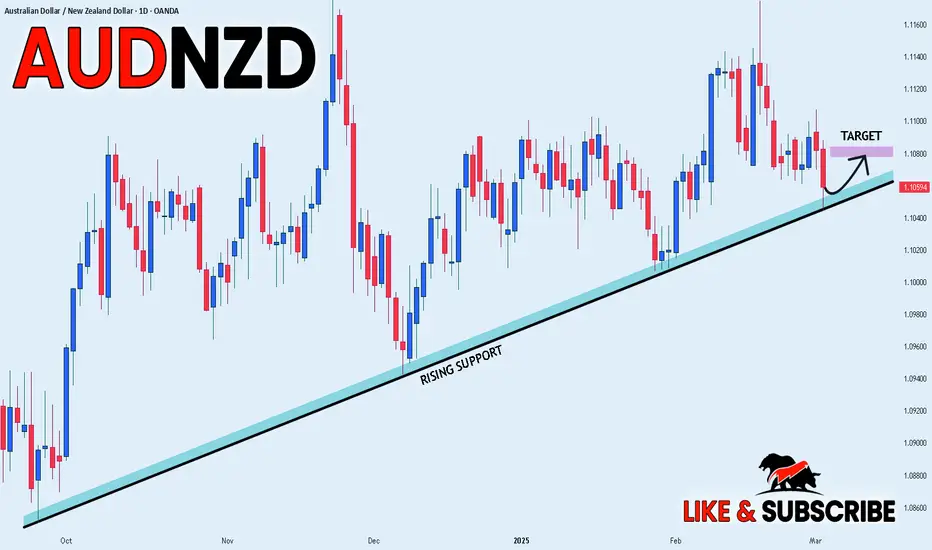
✅AUD_NZD is trading along the rising support
And as the pair will soon retest it
I am expecting the price to go up
To retest the supply levels above at 1.1080
LONG🚀
✅Like and subscribe to never miss a new idea!✅
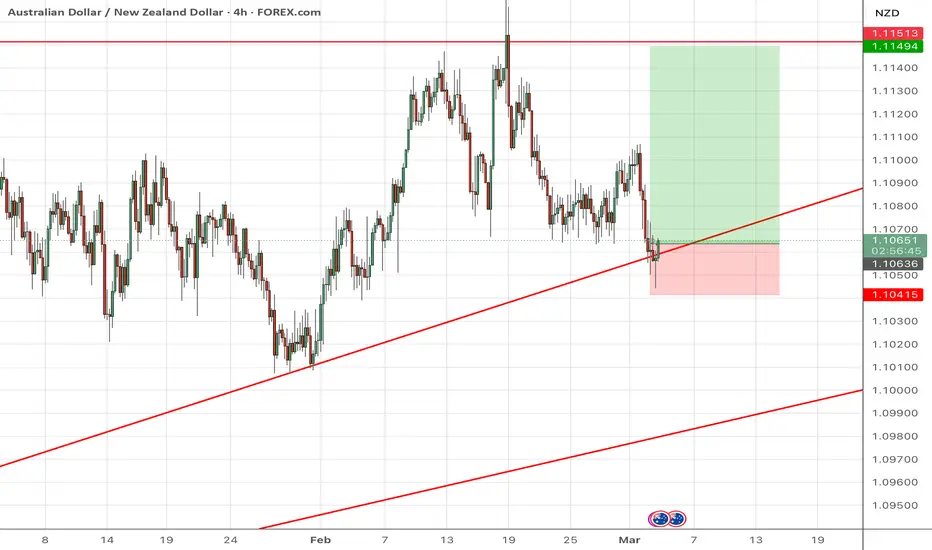
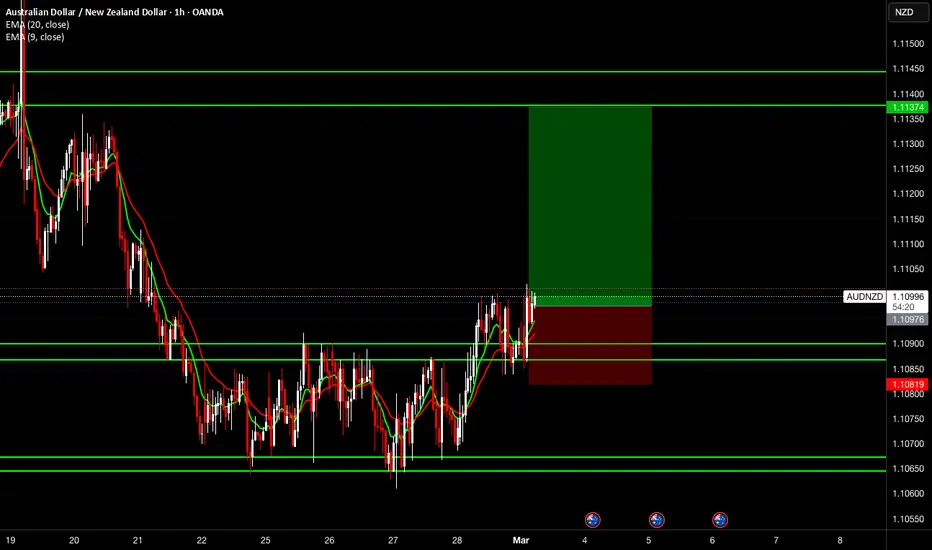
AUD/NZD - Strong sell IdeaThis chart has had some clean previous price action.
Long term we have been bullish and Im going for a counter Trend trade into a possible breakout
We have a strong sell indication with Bearish pressure failing to take out the previous high.
Id like for price to return slightly higher into our supply zone but I do believe that price will breakout before returning higher.
This will be posted in my $100-$1000 chat so many sure to message to be apart of that.
Risking 25Pips for a return of 175Pips
Good luck to any trades that might follow

AUDNZD - Waiting for bullish reversal continuation
I'm waiting for correction above the previous structure to confirm bullish continuation.
Please, share your thoughts on this.

Short ideaout of an important resistance level and confirming price action to the left. bulls eye!!!

AUDNZD: Bearish Continuation is Highly Probable! Here is Why:
Looking at the chart of AUDNZD right now we are seeing some interesting price action on the lower timeframes. Thus a local move down seems to be quite likely.
❤️ Please, support our work with like & comment! ❤️
audnzd buy tradeThe Relative Strength Index (RSI) is showing an upward trend, indicating increasing momentum. Additionally, the Moving Average Convergence Divergence (MACD) is showing a bullish crossover, further supporting the potential for an upward move.
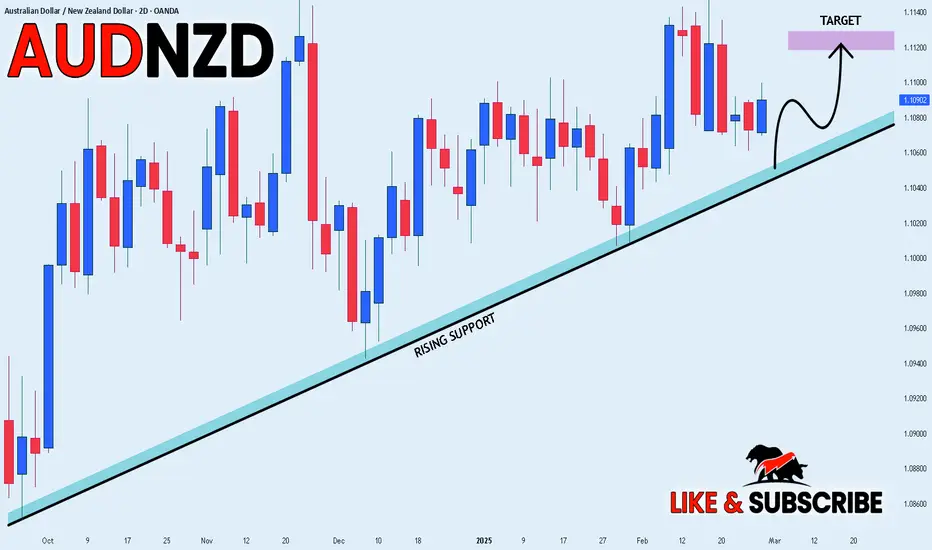
AUD-NZD Bullish Bias! Buy!
Hello,Traders!
AUD-NZD is trading in an
Uptrend along the rising support
Line and we are seeing a bullish
Rebound already so we will be
Expecting a further move up
Buy!
Comment and subscribe to help us grow!
Check out other forecasts below too!
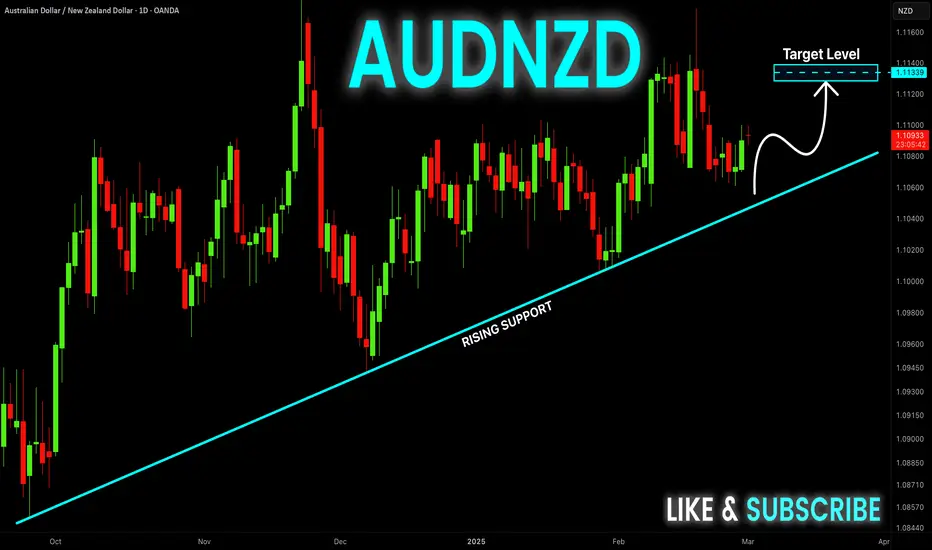
AUD_NZD WILL GROW|LONG|
✅AUD_NZD is trading along the rising support
And as the pair will soon retest it
I am expecting the price to go up
To retest the supply levels above at 1.1120
LONG🚀
✅Like and subscribe to never miss a new idea!✅
MY TOP DOWN BUY ANALYSIS ON AUDNZD. I'm seeing a clearly buy signal on FX:AUDNZD , I tried breaking down this ideas from monthlytf till h4 for clearer understanding. Pls take your time out to view the content of the post.

T/R zonesThis is idea based on transient/recurrence zones.
Price will revisit 1.10930 zone with high probability
30 min cycle (mid term duration)

28.02.25 Morning ForecastPairs on Watch -
FX:AUDNZD
FX:GBPUSD
FX:EURUSD
A short overview of the instruments I am looking at for today, multi-timeframe analysis down to what I will be looking at for an entry. Enjoy!

AUDNZD WILL BE BULLISH Technically:
AUDNZD ranging in accumulation box
AUDNZD printing bullish divergence

AUDNZD buy scenario , 90 pipsThe price recently tested the key support level at 1.0995. Despite the recent weakness in the Aussie, I anticipate a resurgence of buyer activity at this level, potentially resuming the upward trend.

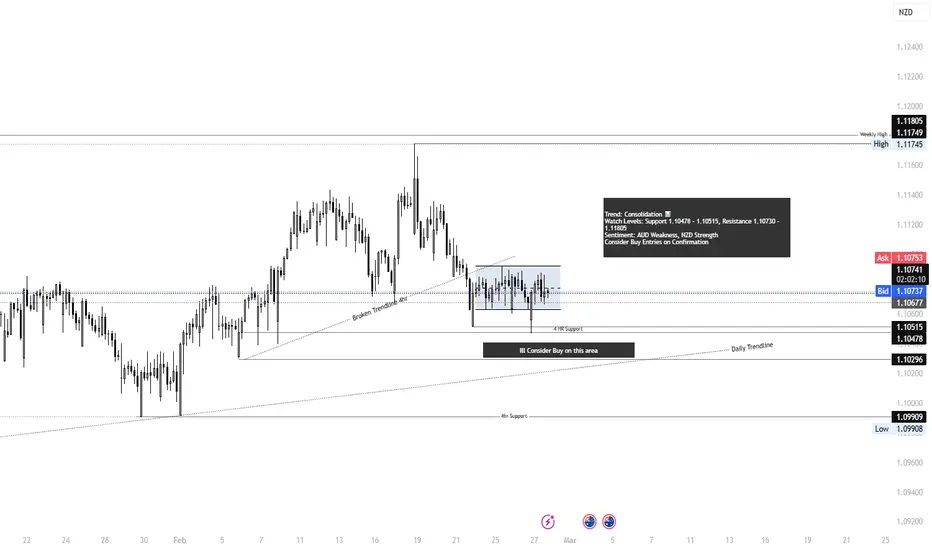
AUD/NZD - Technical Analysis & Market Sentiment📉 Bearish Bias
✅ Moving Averages (50MA & 200MA) - Price is below key MAs, signaling a downtrend. (+2)
✅ MACD - Histogram below the signal line, confirming bearish momentum. (+1)
✅ Parabolic SAR - Dots above price action, indicating a downtrend. (+1)
✅ Range Consolidation - Price stuck in a tight range, showing weak bullish momentum. (+1)
🔻 Total Bearish Score: 5
📰 Sources:
MACD & Parabolic SAR - IFC Markets
Price Action & Moving Averages - XTB
📈 Bullish Bias
✅ 1HR Support Holding - Buyers defending support level, preventing breakdown. (+1)
✅ Daily Trendline Support - Price bouncing off the long-term trendline. (+2)
✅ Stochastic Oscillator - Near oversold territory, potential reversal setup. (+1)
🔹 Total Bullish Score: 4
📰 Sources:
Trendline Support - XTB
Stochastic Oversold - RoboForex
📊 Sentiment & Market Factors
📉 RBA Dovish Tone (- Bearish) - Reserve Bank of Australia signaled potential rate cuts. Source📈 NZD Strengthening (+ Bullish) - Strong economic data supports NZD. Source
📉 Weak Commodity Prices (- Bearish) - Falling iron ore prices weigh on AUD. Source
📌 Final Bias: Slightly Bearish (Score: 5 vs 4)
27.02.25 Morning ForecastPairs on Watch -
FX:AUDNZD
FX:NZDUSD
OANDA:AU200AUD
FX:EURUSD
A short overview of the instruments I am looking at for today, multi-timeframe analysis down to what I will be looking at for an entry. Enjoy!

Bullish bounce?AUD/NZD is falling towards the pivot and could bounce to the 1st resistance.
Pivot: 1.10310
1st Support: 1.09910
1st Resistance: 1.10861
Risk Warning:
Trading Forex and CFDs carries a high level of risk to your capital and you should only trade with money you can afford to lose. Trading Forex and CFDs may not be suitable for all investors, so please ensure that you fully understand the risks involved and seek independent advice if necessary.
Disclaimer:
The above opinions given constitute general market commentary, and do not constitute the opinion or advice of IC Markets or any form of personal or investment advice.
Any opinions, news, research, analyses, prices, other information, or links to third-party sites contained on this website are provided on an "as-is" basis, are intended only to be informative, is not an advice nor a recommendation, nor research, or a record of our trading prices, or an offer of, or solicitation for a transaction in any financial instrument and thus should not be treated as such. The information provided does not involve any specific investment objectives, financial situation and needs of any specific person who may receive it. Please be aware, that past performance is not a reliable indicator of future performance and/or results. Past Performance or Forward-looking scenarios based upon the reasonable beliefs of the third-party provider are not a guarantee of future performance. Actual results may differ materially from those anticipated in forward-looking or past performance statements. IC Markets makes no representation or warranty and assumes no liability as to the accuracy or completeness of the information provided, nor any loss arising from any investment based on a recommendation, forecast or any information supplied by any third-party.

The #1 Lesson From Professional Trading Let me tell you a story about how I got a professional cobbler to fix my back pack bag....
-
When I boarded a bus leaving town, the strap on my back pack cut...it was on the right side at the bottom end.
-
I felt sad.I noticed that the straps where starting to rip about 5 months ago.My elder brother asked to use my bag.
-
"Dont carry heavy things!"
I told him.
-
About a 4 weeks ago he asked for my bag again.
-
"Will you take it to the clobber?"
He suggested.
-
You see before today I took it to an amateur clobber about 4 years ago.
It was a "shoddy" job.
He fixed it in a nick of time .
I hated the way it was fixed the straps where put on in a "cock-eye" way
One strap was shorter while,the other side longer.
"As long as I can carry stuff"
I frustratly thought to myself.
Well today, I took it to a professional and he took about 40 minutes to fix it.
Why?
Because he had to undo the bad job that the amateur cobbler did 4 years ago,and then rework the straps to their normal lengths.
On both the right side and left side.
Am happy with the new fix.The back pack bag straps are at normal lengths now.
Listen the lesson is this.
👉 Professional Trading Takes Time To Learn- Just like it took time for a professional cobbler to fix my bag.
It won't be easy in the beginning but if you keep practicing one day you will be a professional trader.
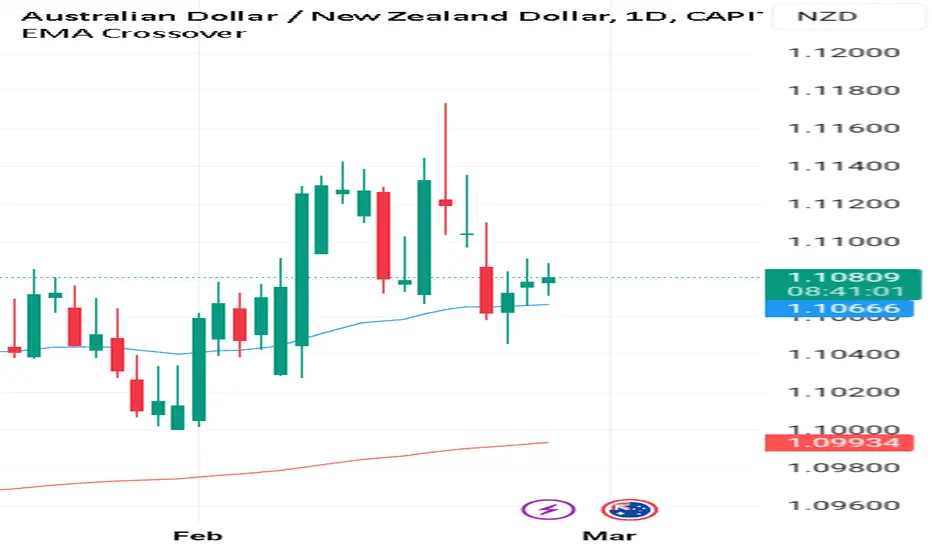
This chart CAPITALCOM:AUDNZD
Follows the 3 Step-Rocket Booster Strategy:
1️⃣ The Price has to be above the 50 EMA
2️⃣The Price has to be above the 200 EMA
3️⃣The Price has to Gap up
The last step is confirmed on a candlestick pattern called "the rising 3 soldiers"
This is according to Steve Nissan's Book Japanese Candlestick Patterns
Which is Where I learnt it from.
After a recommendation from Tim Sykes
If you want to learn more 🚀 Rocket Boost This Content
Trade safely.
Disclaimer ⚠️ Trading is risky please learn Risk Management And Profit Taking Strategies.Also feel free to use a simulation trading account.