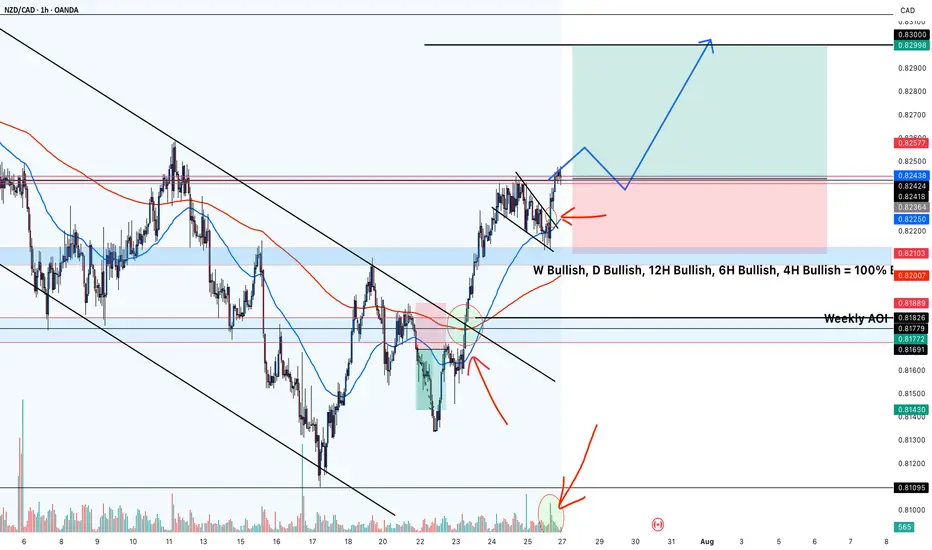
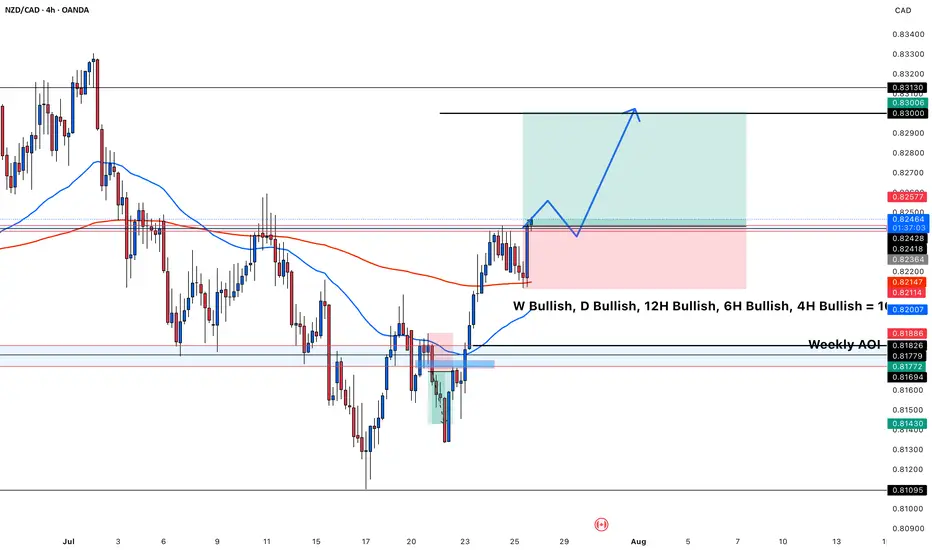
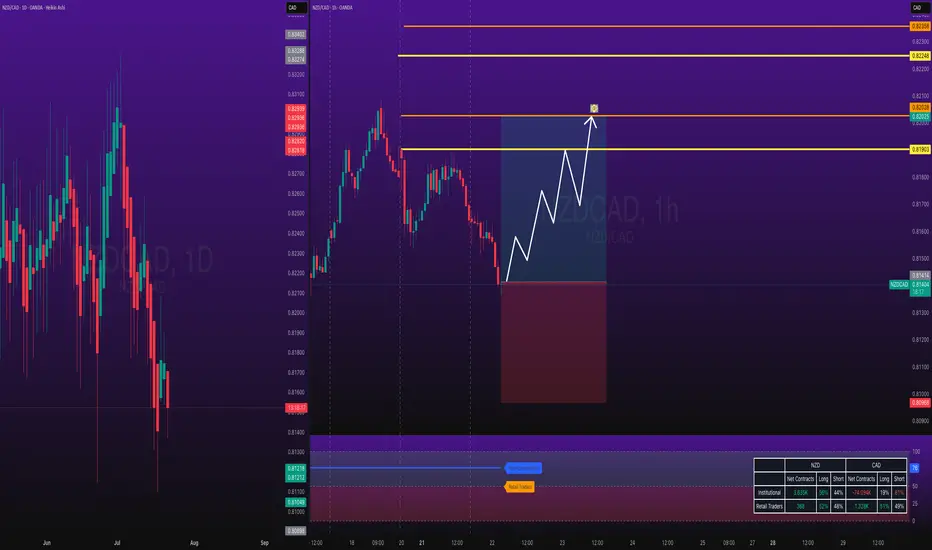
NZDCAD Long Now!I believe it will reach the 83000 target, it may still retest the level before going to the target, but I have all the confimation for a long here.
NZDCAD trade ideas
A Top Down Approach will help you spot quality tradesAll the information you need to find a high probability trade are in front of you on the charts so build your trading decisions on 'the facts' of the chart NOT what you think or what you want to happen or even what you heard will happen. If you have enough facts telling you to trade in a certain direction and therefore enough confluence to take a trade, then this is how you will gain consistency in you trading and build confidence. Check out my trade idea!!
tradingview.sweetlogin.com

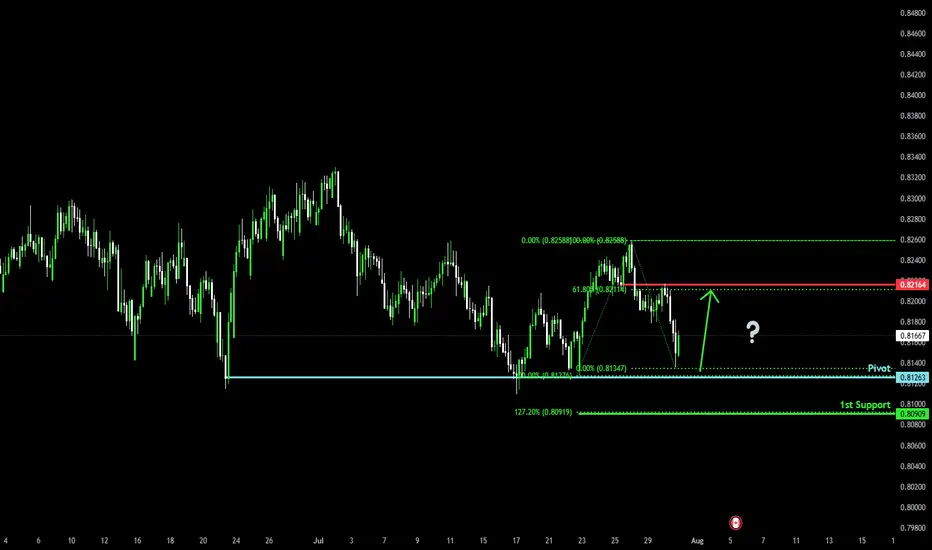
Bullish reversal?NZD/CAD is falling towards the pivot an could bounce to the 1st resistance.
Pivot: 0.81263
1st Support: 0.80909
1st Resistance: 0.82164
Risk Warning:
Trading Forex and CFDs carries a high level of risk to your capital and you should only trade with money you can afford to lose. Trading Forex and CFDs may not be suitable for all investors, so please ensure that you fully understand the risks involved and seek independent advice if necessary.
Disclaimer:
The above opinions given constitute general market commentary, and do not constitute the opinion or advice of IC Markets or any form of personal or investment advice.
Any opinions, news, research, analyses, prices, other information, or links to third-party sites contained on this website are provided on an "as-is" basis, are intended only to be informative, is not an advice nor a recommendation, nor research, or a record of our trading prices, or an offer of, or solicitation for a transaction in any financial instrument and thus should not be treated as such. The information provided does not involve any specific investment objectives, financial situation and needs of any specific person who may receive it. Please be aware, that past performance is not a reliable indicator of future performance and/or results. Past Performance or Forward-looking scenarios based upon the reasonable beliefs of the third-party provider are not a guarantee of future performance. Actual results may differ materially from those anticipated in forward-looking or past performance statements. IC Markets makes no representation or warranty and assumes no liability as to the accuracy or completeness of the information provided, nor any loss arising from any investment based on a recommendation, forecast or any information supplied by any third-party.
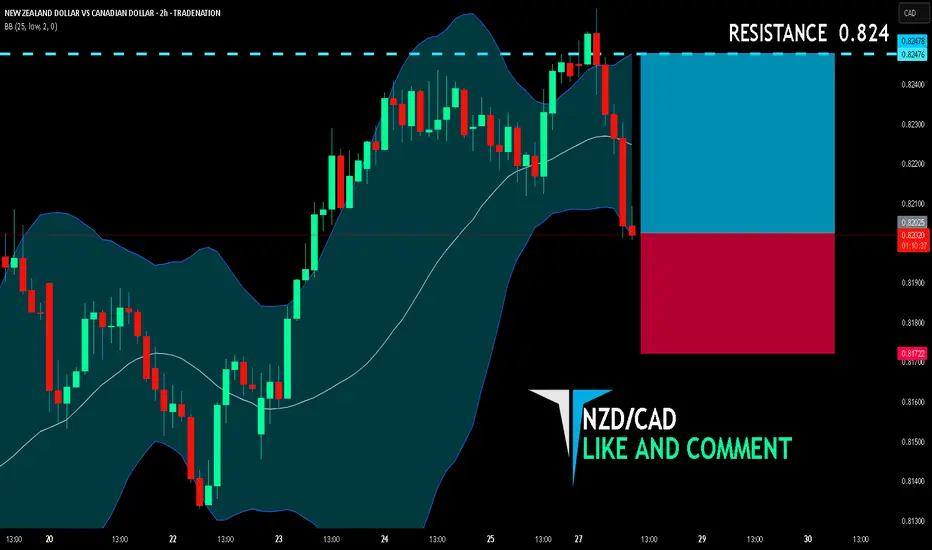
NZD/CAD BULLS ARE GAINING STRENGTH|LONG
NZD/CAD SIGNAL
Trade Direction: long
Entry Level: 0.820
Target Level: 0.824
Stop Loss: 0.817
RISK PROFILE
Risk level: medium
Suggested risk: 1%
Timeframe: 2h
Disclosure: I am part of Trade Nation's Influencer program and receive a monthly fee for using their TradingView charts in my analysis.
✅LIKE AND COMMENT MY IDEAS✅
NZDCAD: Bullish Continuation is Expected! Here is Why:
The analysis of the NZDCAD chart clearly shows us that the pair is finally about to go up due to the rising pressure from the buyers.
Disclosure: I am part of Trade Nation's Influencer program and receive a monthly fee for using their TradingView charts in my analysis.
❤️ Please, support our work with like & comment! ❤️
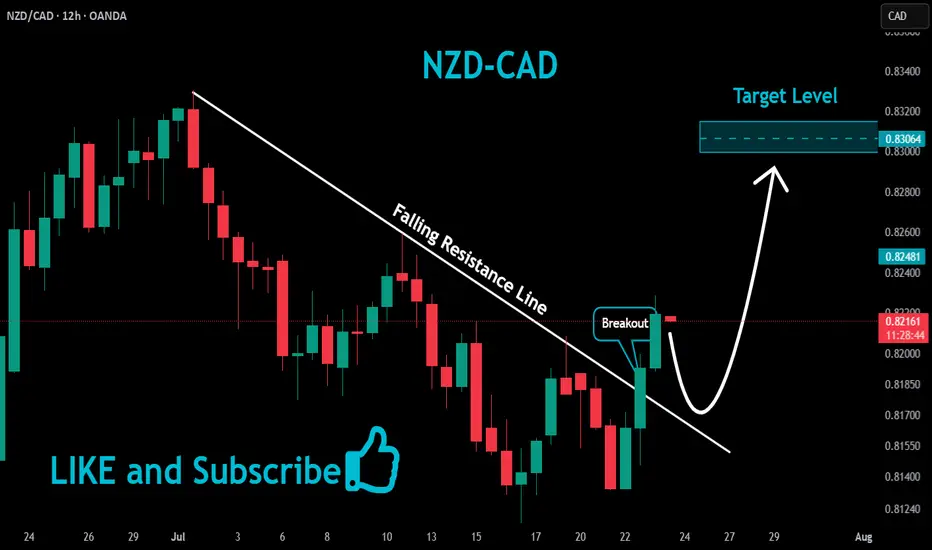
NZDCAD Bullish Breakout!
HI,Traders !
#NZDCAD was trading
Beneath the falling resistance
Line but now we are seeing a
Bullish breakout so we are
Now locally bullish biased
And we will be expecting a
Further bullish move up !
Comment and subscribe to help us grow !
NZDCAD Long Trade Risking 1% to make 1.37%OANDA:NZDCAD Long Trade, with my back testing of this strategy, it hits multiple possible take profits, manage your position accordingly.
Note: Manage your risk yourself, its risky trade, see how much your can risk yourself on this trade.
Use proper risk management
Looks like good trade.
Lets monitor.
Use proper risk management.
Disclaimer: only idea, not advice
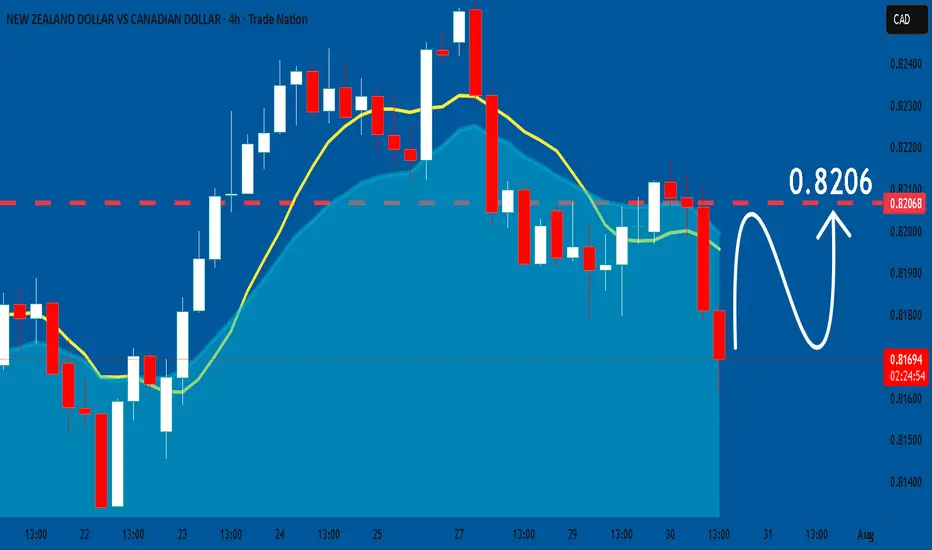
NZDCAD: A Short Term Bearish Perspective NZDCAD: A Short Term Bearish Perspective
NZDCAD reached a strong zone near 0.8205 and reached
Given that the trend is still bearish and Canada continues to print strong data the chances are that it can drop further in the short term.
The chances are that it can drop further during the U.S trading session given that the economic calendar is very poor today.
You may find more details in the chart!
Thank you and Good Luck!
PS: Please support with a like or comment if you find this analysis useful for your trading day
Disclosure: I am part of Trade Nation's Influencer program and receive a monthly fee for using their TradingView charts in my analysis.
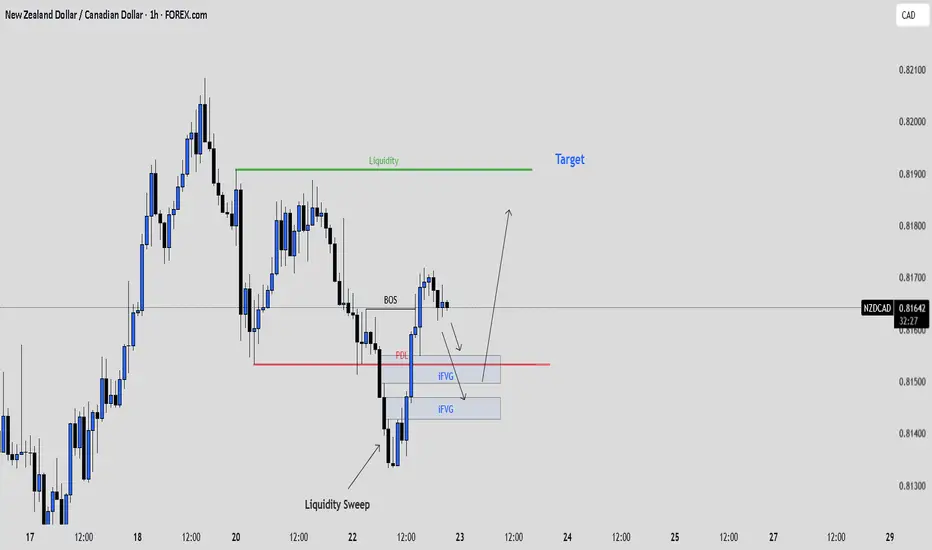
NZDCAD: Patience Before the PushNZDCAD on the 1H chart just completed a clean liquidity sweep below the previous day’s low. That long wick aggressively took out resting sell stops before price sharply reversed.
We’ve now seen a break of structure to the upside, showing a possible shift in market direction. Price is currently pulling back toward two visible imbalance zones (iFVGs), both sitting just below the previous day’s low.
If price trades into these iFVGs and gives us a clear bullish confirmation like a bullish engulfing candle, a rejection wick, or a strong break of structure on lower timeframes, we could look for continuation toward the liquidity above the highs.
📌 Key Levels
• Liquidity sweep below PDL
• Bullish break of structure
• iFVGs aligning as potential entry zones
• Final target: liquidity resting near 0.81900
🧠 Psychology Tip
The best trades don’t need to be forced. Wait for confirmation. A setup without a signal is just a theory. Protect your capital, trade your plan, and trust the process.
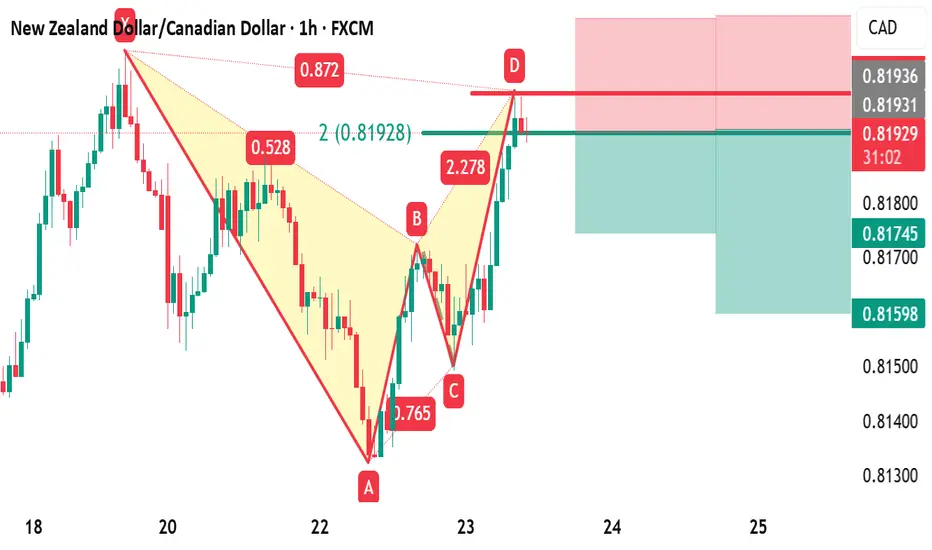
NZDCAD 1HR BAT HARMONICBAT Harmonic pattern completed on 1H timeframe.
2 Take profits shown on the chart
Trade Active
NZDCAD Buy?? it looks juicy Hello please do not aim for the top of the range!!
Now because its NZDCAD it might look choppy and it might be choppy.
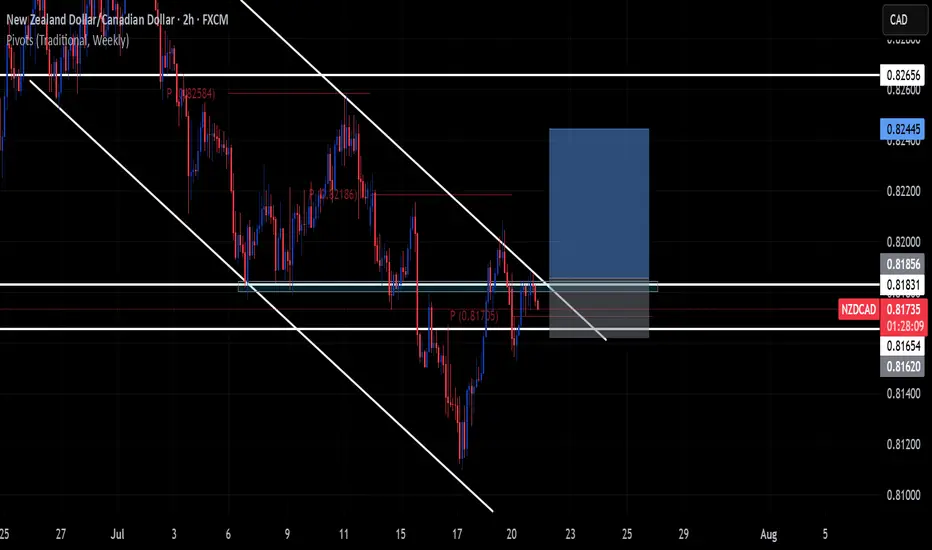
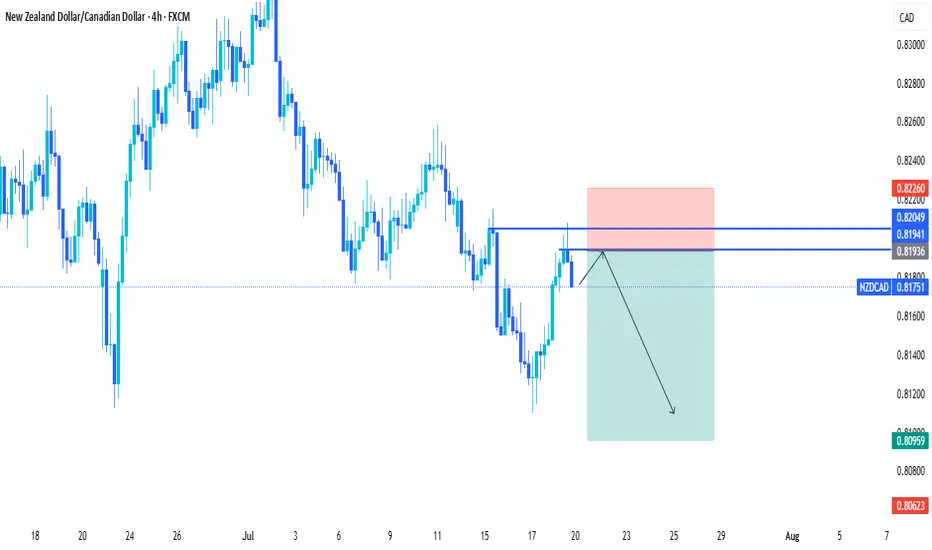
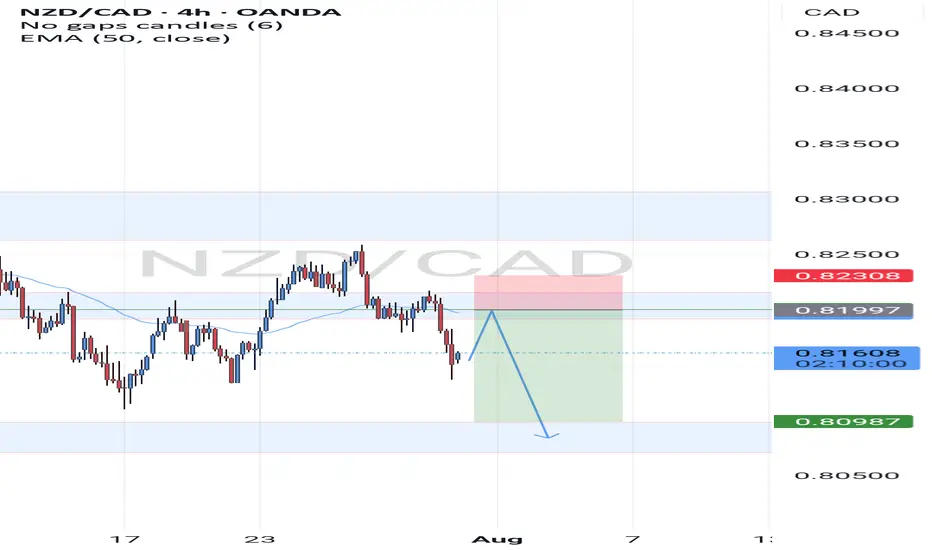
NZDCAD bearish continuatiuonPrice was consolidating in the last 2 months, now it finally broke the level and got the retest waiting for a beutiful Bearsih Engulfing 30M,1H,2H to enter this trade.
very clear trade for me this week, it has to start now the downtrend.
---
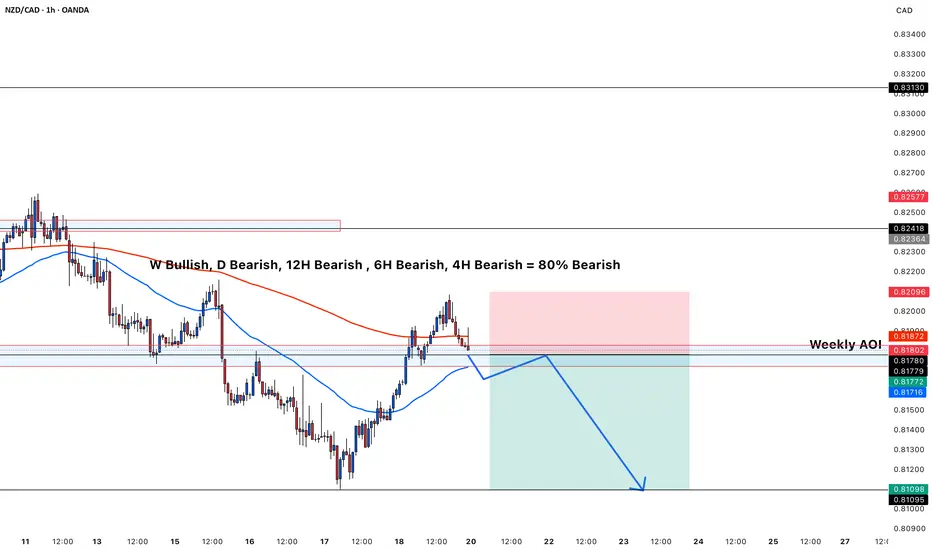
### 🔎 **Multi‑timeframe Bias**
* **Weekly:** Bullish (but higher‑timeframe bullishness often takes longer to play out; intraday moves can still be bearish).
* **Daily:** Bearish
* **12H:** Bearish
* **6H:** Bearish
* **4H:** Bearish
✅ **Result:** 80% of your major timeframes are **aligned bearish**, giving you strong confluence to look for sells rather than buys.
---
### 📉 **Structure and Price Action**
* **Market Structure:**
Price is making **lower highs and lower lows** on the 4H and 1H timeframes, which confirms a **downtrend** in the short/medium term.
* **Current Zone:**
Price is currently reacting from a **Weekly Area of Interest (AOI)**, a previous support now acting as resistance.
* **Bearish Rejection:**
The recent move up into the AOI has been rejected, shown by the price failing to break above the resistance zone and starting to turn down.
---
### 📊 **Moving Averages**
* **50 EMA (blue) is below the 200 EMA (red):** classic bearish alignment.
* Price is currently **under the 200 EMA** and testing the 50 EMA from above — if it breaks back below, this often signals momentum returning to the downside.
---
### 📐 **Risk‑Reward and Setup**
* You’ve marked a **short entry** from the AOI, with:
* **Stop Loss** above the resistance zone (red area)
* **Take Profit** targeting lower liquidity levels (green area near 0.8110)
* The projected move matches the dominant trend direction, increasing probability.
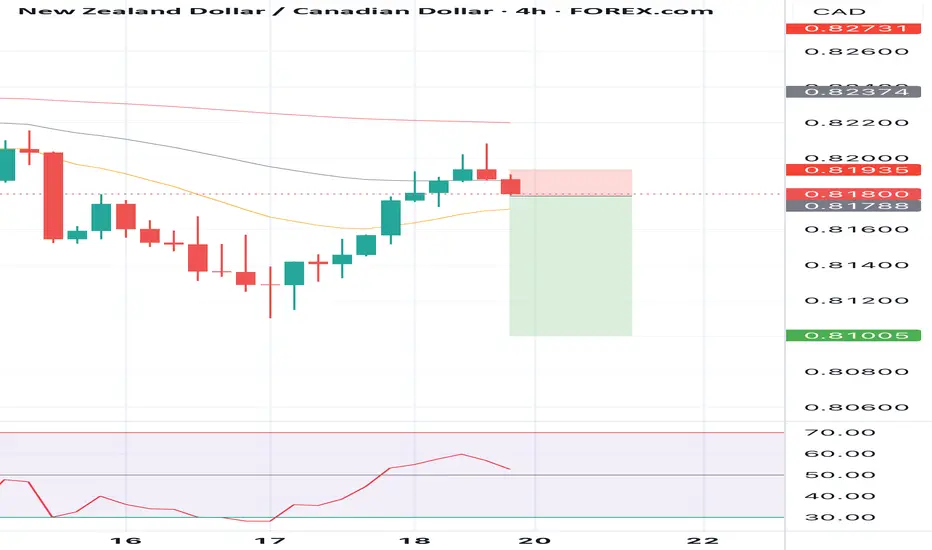
NZDCAD TRADE SETUPWait for retest the entry level and bearish momentum candle then take a trade for Sell otherwise skip this setup
SELL NZDCAD now for a 4h time frame bearish trend continuationSELL NZDCAD now for a four hour time frame bearish trend continuation..........
STOP LOSS: 0.8180
This sell trade setup is based on hidden bearish divergence trend continuation trading pattern...
Always remember, the trend is your friend, so whenever you can get a signal that the trend will continue, then good for you to be part of it
TAKE PROFIT : take profit will be when the trend comes to an end, feel from to send me a direct DM if you have any question about take profit or anything.
Remember to risk only what you are comfortable with….....trading with the trend, patient and good risk management is the key to success here
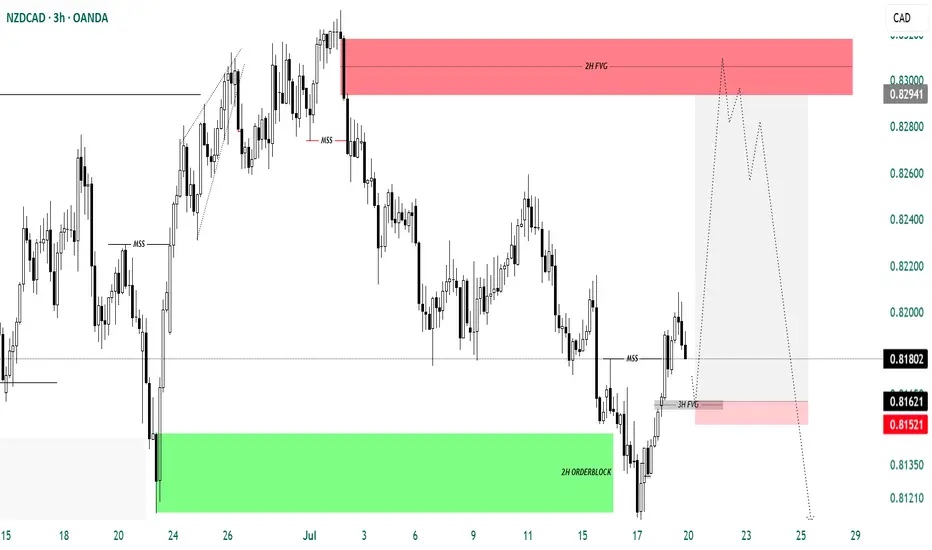
NZD/CADNZD/CAD Has Retraced Into My 2h/4h Orderblock And Made A Market Structure Shift To The Upside For A Possible Move Higher Towards The Higher Timeframe Fair Value Gap. I Will Look For Longs Form This Zone And Then Wait For A Market Structure Shift To The Downside To Look For Short Entries To My Daily OrderBlock Which Sits Between 0.79705 - 0.78667. Once There I Will Look For Long Positions.
Trade Carefully HK

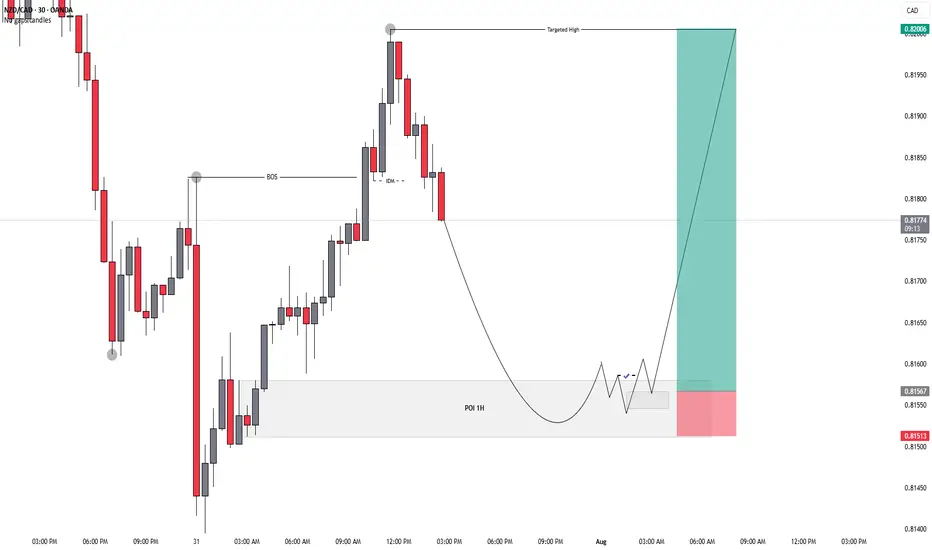
(art📊 Smart Money Concept Trade Setup (NZD/CAD – 30-Min Chart)
🧠 Market Structure Overview:
Price initially formed a Lower Low (left side of the chart).
Then, price made a clear Break of Structure (BOS) to the upside, creating a Higher High.
An IDM indicates price manipulation and confirms liquidity resting above the recent high (target).
🔍 Entry Plan:
📉 Price is currently dropping towards a marked 30-minute POI (Point of Interest) — a Demand Zone.
⏳ Once price enters this 30M POI zone, switch to the 5-minute or 1-minute timeframe for confirmation.
🔁 Look for a CHoCH (Change of Character) within the POI on the lower timeframe — this shows bullish intent and potential reversal.
📥 Enter a Buy trade right after CHoCH confirmation:
Stop Loss (SL): Just below the POI/Demand zone.
Take Profit (TP): At the Targeted High marked above (where external liquidity sits).
📐 Risk:Reward Details:
This setup offers a minimum 1:5 RR (Risk to Reward).
SL: Below the 30M POI.
TP: Just above the previous high (liquidity grab zone).
✅ Entry Checklist (English)
Entry Condition Status
Price entered 30M POI? ✅
CHoCH confirmed on 5M/1M? ✅
Bullish BOS or structure break visible? ✅
Risk:Reward at least 1:5? ✅
NZDCAD; Heikin Ashi Trade IdeaIn this video, I’ll be sharing my analysis of NZDCAD, using FXAN's proprietary algo indicators with my unique Heikin Ashi strategy. I’ll walk you through the reasoning behind my trade setup and highlight key areas where I’m anticipating potential opportunities.
I’m always happy to receive any feedback.
Like, share and comment! ❤️
Thank you for watching my videos! 🙏

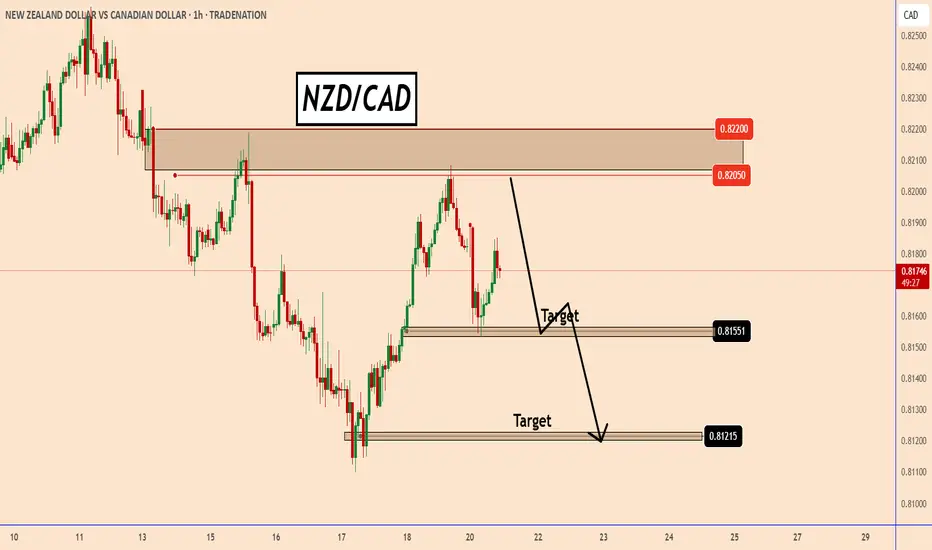
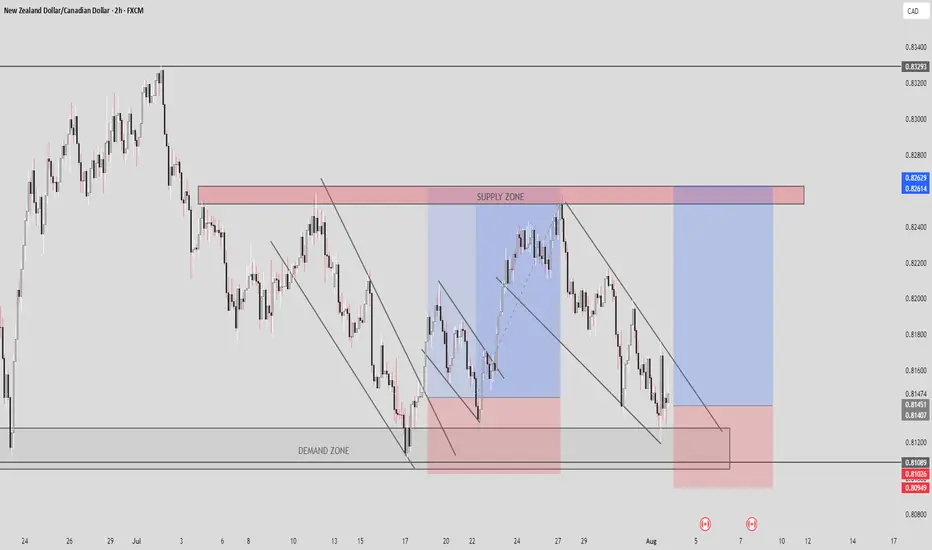
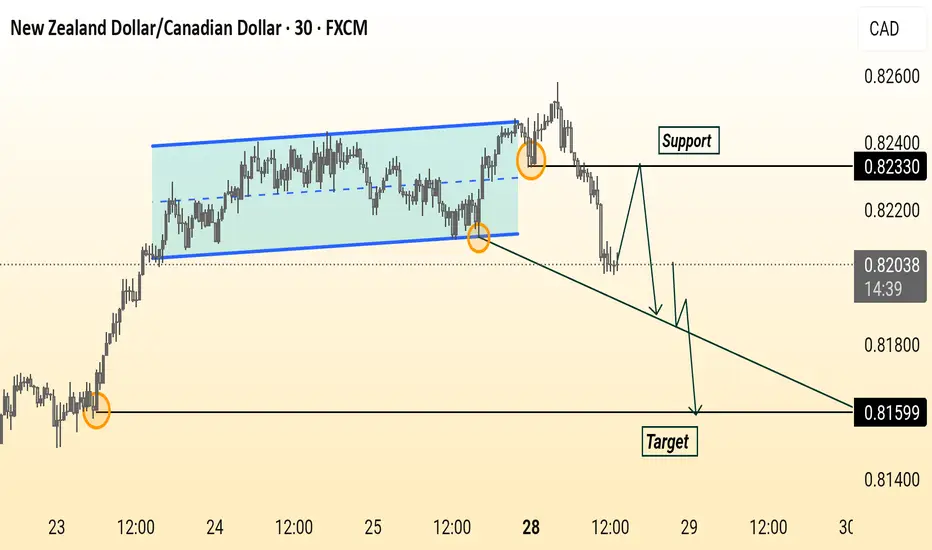
NZD/CAD Setup Price broke below the consolidation channel, retested the support at 0.82330, and is expected to continue down toward the target at 0.81599. Bearish momentum is in play.
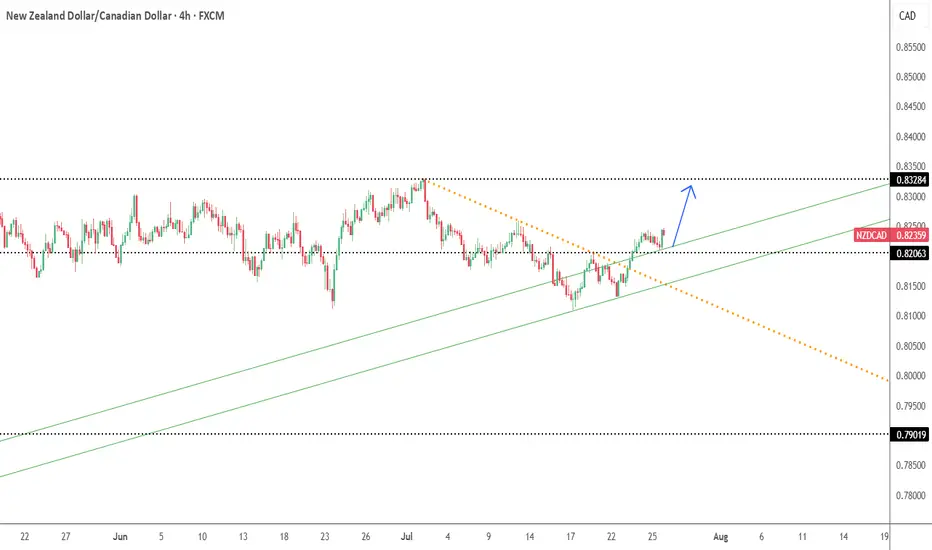
NZDCAD--LONG--27_07_25--breaking of descending trendline (orange line)
--entry around 0.82063
--TP=0.83284
NZDCAD Long Now!📌 Instrument & Timeframe
NZD/CAD – 4H timeframe
Overall trend across multiple timeframes is noted as bullish (W, D, 12H, 6H, 4H all bullish).
📈 Market Structure
Price previously moved within a descending channel (drawn by two black trendlines) but has broken out to the upside.
After the breakout, price retraced back near a key area (just above the 200 EMA / red line) and is forming a smaller bull flag or descending wedge, indicating a potential continuation.
🔥 Area of Interest
Weekly AOI (Area of Interest) marked around 0.8180 – 0.8200 zone has acted as strong support.
Price reacted bullishly from that AOI, confirming buyers stepped in.
✅ Trade Bias
All higher timeframes (W, D, 12H, 6H, 4H) are bullish, so the bias is long.