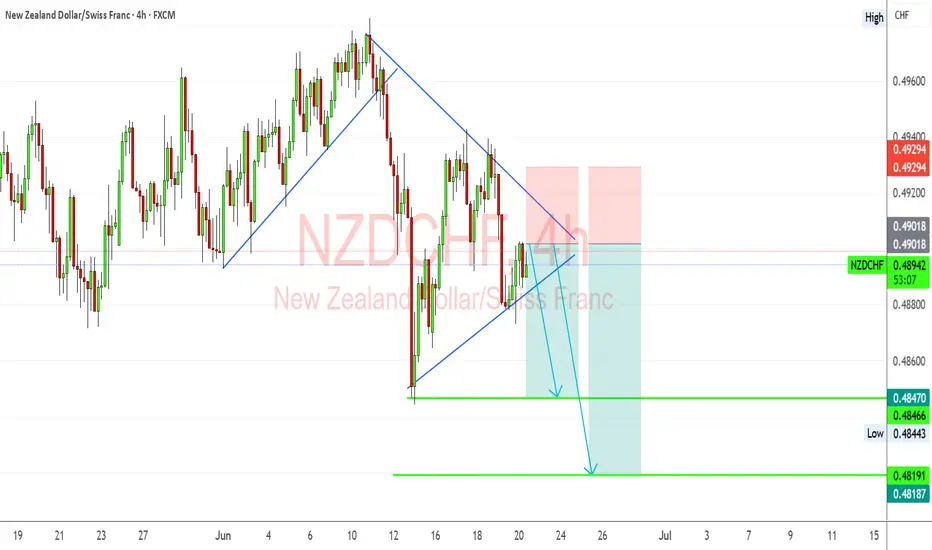
NZDCHF Analysis – “Kiwi Faces Uphill Battle Against Safe-Haven FNZDCHF Price has formed a bearish pennant / triangle after a strong drop from the highs around 0.4960.
Rejection seen from the trendline resistance at ~0.4900, suggesting limited bullish momentum.
Bearish targets are mapped to:
0.4847 (first support)
0.4819 (deeper bearish target)
Two bearish scenarios drawn, both suggesting downside pressure is likely if support breaks.
Structure Bias: Bearish as long as below ~0.4905
📊 Current Bias: Bearish
🧩 Key Fundamentals Driving NZDCHF
NZD Side (Mixed to Weak):
RBNZ held rates at 5.50%, but no additional hawkish surprises. Kiwi is underperforming against safe-havens despite resilience.
Mixed Chinese influence: Some recent recovery in China’s retail/consumption data (e.g., 618 festival) but not strong enough to fuel Kiwi strength.
Risk sentiment: Global geopolitical tensions (Israel-Iran, Ukraine) are pressuring high-beta currencies like NZD.
CHF Side (Strengthening):
Swiss Franc bid on risk-off: CHF is strengthening as a safe-haven due to escalating geopolitical concerns and volatile global markets.
SNB not cutting yet: Recent SNB assessment indicates gradual, patient stance. The central bank may ease later in 2025, but no urgency.
European proximity flows: CHF benefits from proximity to EU and low volatility in domestic economy.
⚠️ Risks That May Reverse the Trend
Surprise RBNZ hawkish speech or inflation spike
Risk-on reversal boosting NZD
Unexpected SNB rate cut or dovish surprise
🗓️ Key News to Watch
🇳🇿 NZ Trade Balance and inflation expectations
🇨🇭 Swiss inflation data and SNB commentary
Global sentiment drivers: Middle East headlines, equity volatility
🏁 Which Asset May Lead?
NZDCHF may lag behind NZDJPY or AUDCHF in volatility but offers a cleaner risk-off signal. If CHF strength and Kiwi weakness persist, this pair can trend with limited noise.
NZDCHF trade ideas
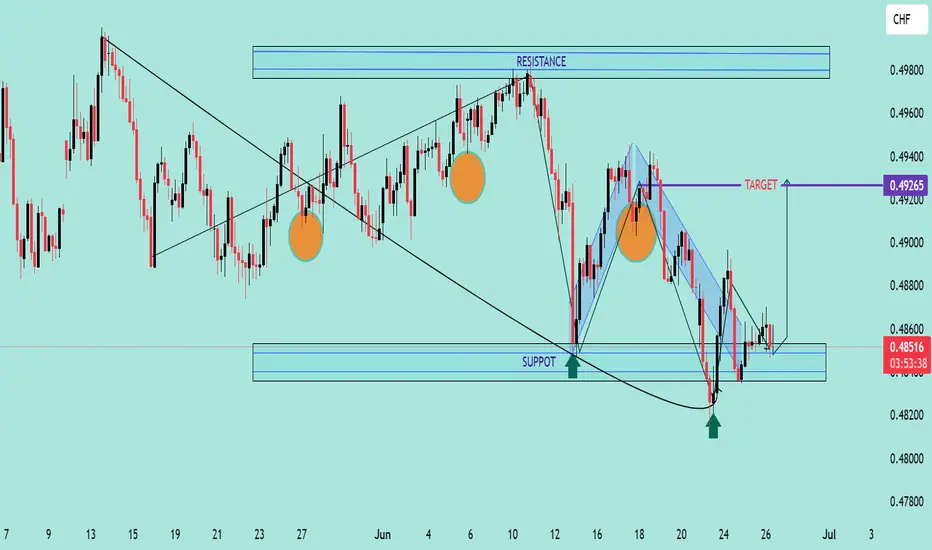
NZD/CHF Potential Bullish Reversal SetupNZD/CHF Potential Bullish Reversal Setup 🔄📈
📊 Chart Analysis:
The chart shows a potential bullish reversal for NZD/CHF, supported by technical patterns and key levels:
🧠 Key Technical Highlights:
🔹 Double Bottom Formation (🟠 Circles)
A clear double bottom pattern can be seen around the 0.48300 support zone, signaling potential reversal from the downtrend.
🔹 Strong Support Zone 📉
Price bounced from a historically respected support zone (~0.48200–0.48400), which held several times in the past (marked with green arrows).
🔹 Downtrend Breakout 🔺
A short-term bearish channel has been broken to the upside, indicating potential bullish pressure.
🔹 Target Zone 🎯
Immediate bullish target is around 0.49265, aligning with previous resistance.
🔹 Resistance Area (🔵 Boxes)
Next significant resistance lies at 0.49400–0.49800, which may act as the next hurdle if price breaks the 0.49265 level.
✅ Conclusion:
As long as price holds above 0.48400, bulls may aim for the 0.49265 🎯 target. A breakout above that level can open the path to higher resistances.
📌 Bullish Bias maintained above support zone — monitor for volume confirmation and retest strength.
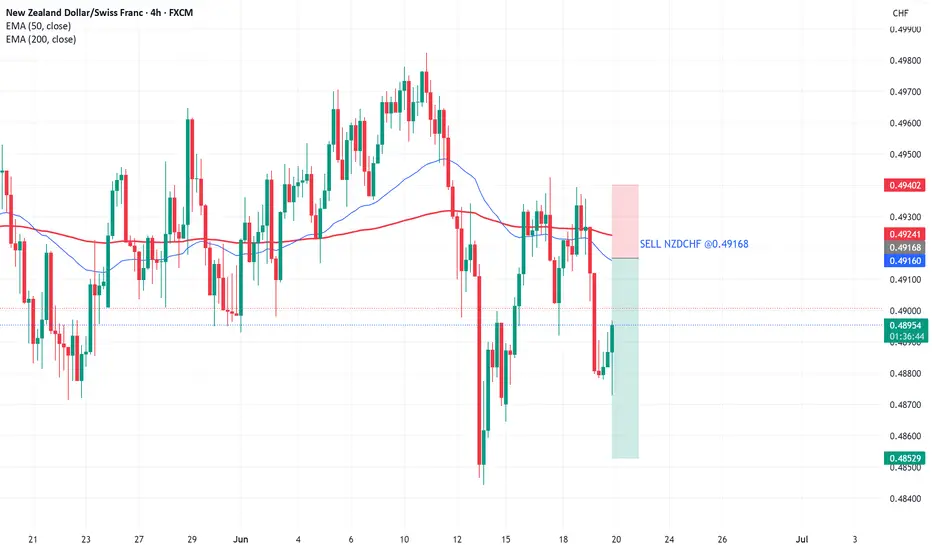
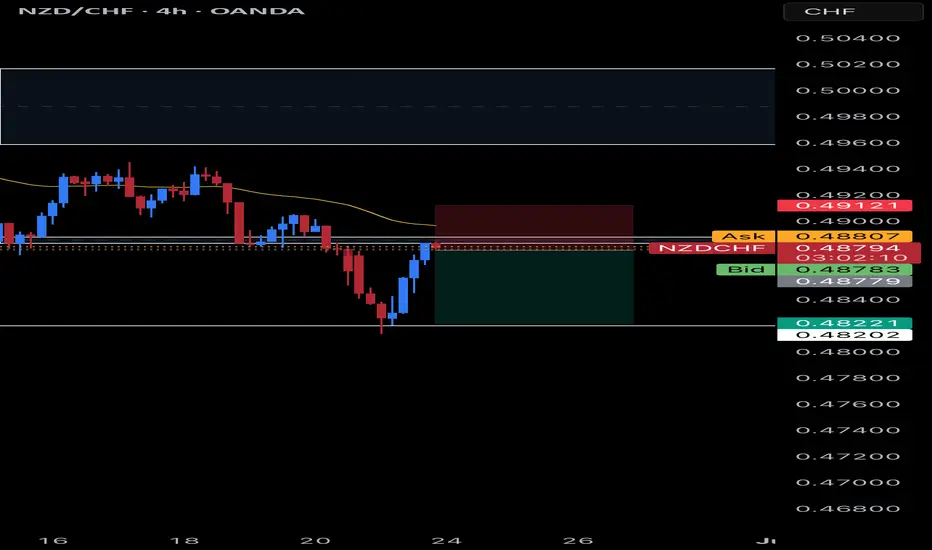
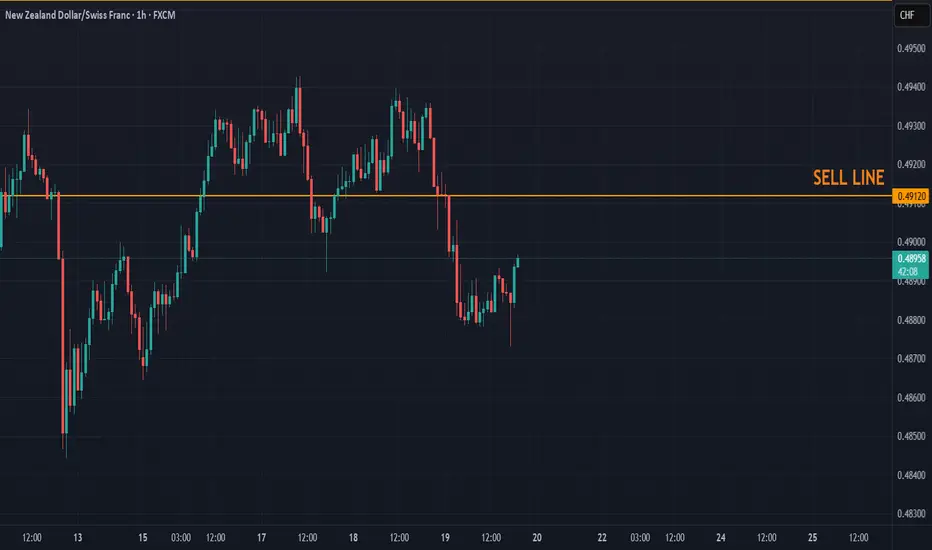
POSSIBLE SELL OPPORTUNITY ON NZDCHFPrice continues to fall on the NZDCHF pair. We have a quality supply zone formed above the on featured here. Price keeps on forming new supply zones giving us multiple opportunities to enter the trade.
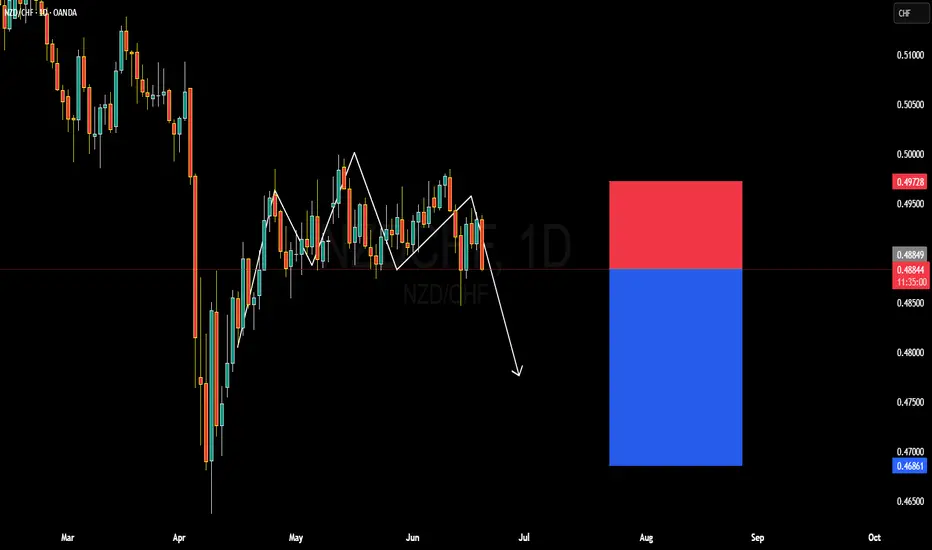
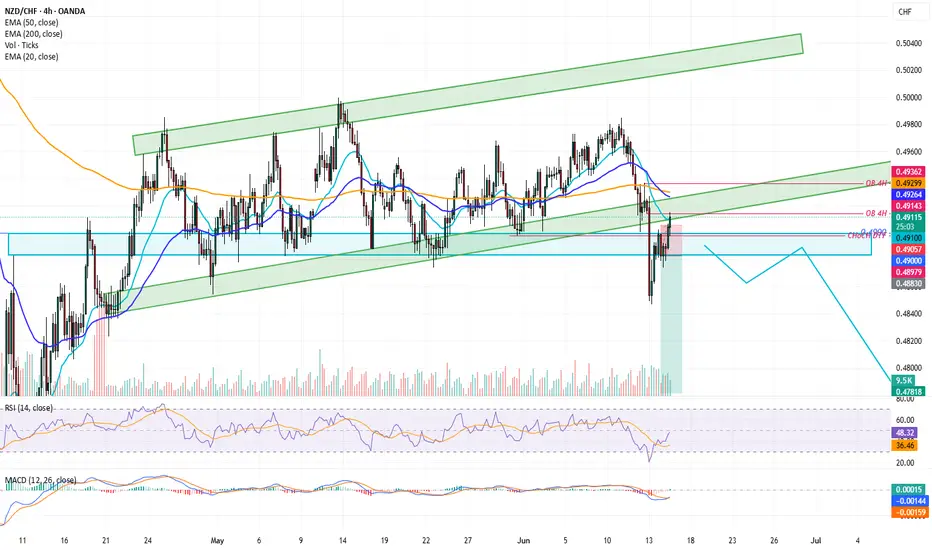
NZDCHF BULLISH OR BEARISH DETAILED ANALYSISNZDCHF is currently trading around the 0.4880–0.4900 zone, and on the daily timeframe, the pair appears to be completing an inverse head and shoulders pattern. However, unlike the typical bullish nature of this pattern, price has failed to break above the neckline and is showing early signs of bearish continuation. The right shoulder has already failed to create a higher high, and recent bearish candlesticks with strong wicks to the upside suggest rejection and downside momentum building. My short bias is supported by this structural weakness and loss of bullish steam.
From a fundamental perspective, the Swiss Franc remains strong due to its safe-haven demand amid lingering global risk aversion and slowing global growth expectations. The Reserve Bank of New Zealand, while on hold recently, has adopted a relatively dovish tone as domestic inflation trends soften. This diverging policy stance between the SNB and RBNZ provides a macroeconomic tailwind favoring CHF strength and NZD weakness. In today’s session, CHF also gained modestly following stronger-than-expected CPI revisions and cautious risk flows in the Asian and European sessions.
Technically, we’ve seen a clean break of the recent support zone near 0.4890, and the market structure has flipped bearish on both the daily and H4 charts. I expect further downside continuation toward the 0.4680–0.4700 range, especially if the current lower highs pattern persists. The bearish flag breakdown and consistent lower closes support continuation toward my 0.46 target. This offers a solid short setup with a favorable risk-reward ratio in play.
I’ll continue monitoring for any pullback toward the 0.4920–0.4950 area for potential re-entries on weakness. Momentum and volume indicators also point lower, aligning with the price action thesis. As long as we stay below 0.4970, the bearish scenario remains active, and I’m looking to capitalize on this developing bearish cycle in NZDCHF.
nzdchf long 2nd attempt, should be able to make up previous loss + more
entry .48390
sl .47700
tp .50400
NZD/CHF SENDS CLEAR BULLISH SIGNALS|LONG
Hello, Friends!
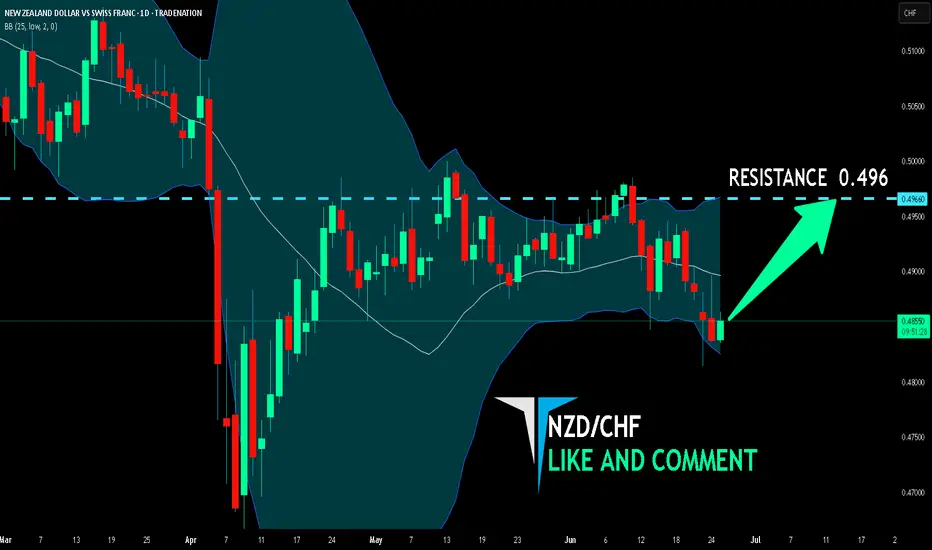
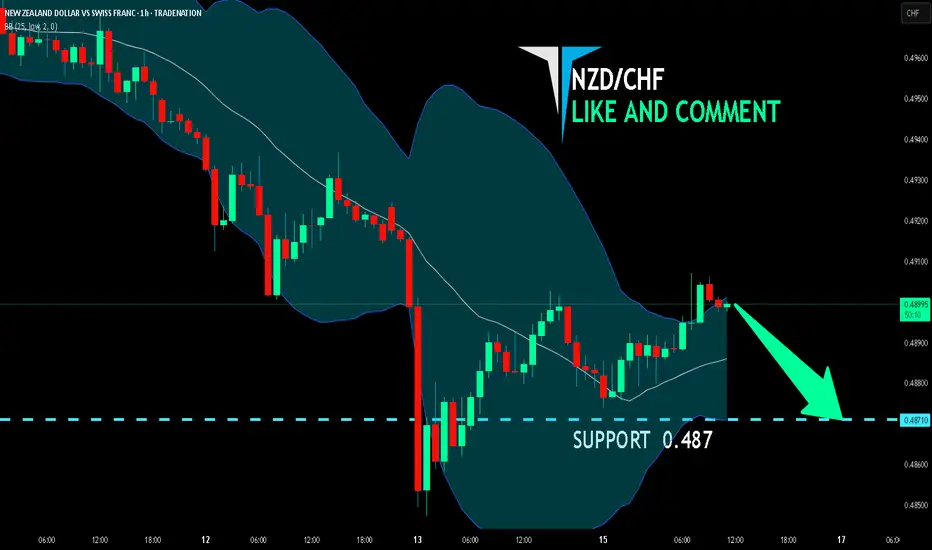
NZD/CHF pair is trading in a local downtrend which we know by looking at the previous 1W candle which is red. On the 1D timeframe the pair is going down too. The pair is oversold because the price is close to the lower band of the BB indicator. So we are looking to buy the pair with the lower BB line acting as support. The next target is 0.496 area.
Disclosure: I am part of Trade Nation's Influencer program and receive a monthly fee for using their TradingView charts in my analysis.
✅LIKE AND COMMENT MY IDEAS✅
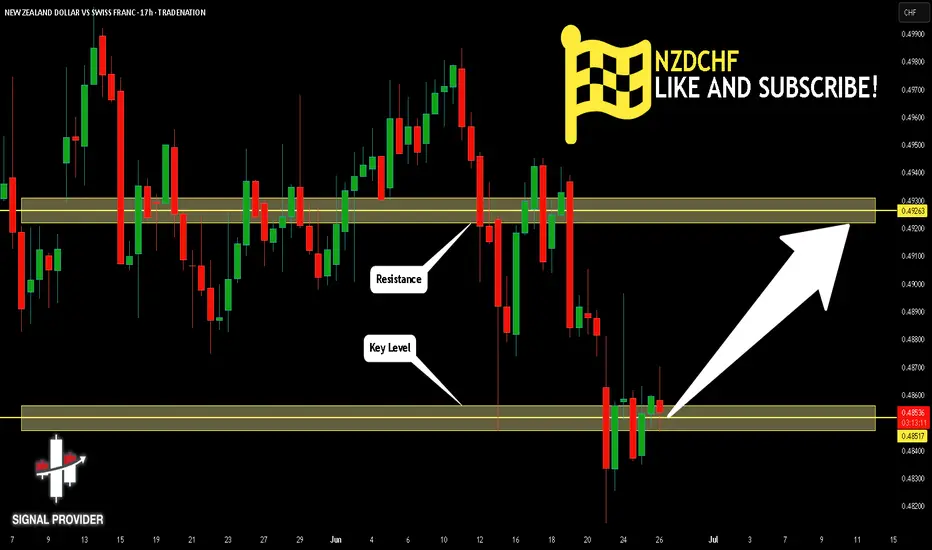
NZDCHF Is Very Bullish! Buy!
Take a look at our analysis for NZDCF
Time Frame: 17h
Current Trend: Bullish
Sentiment: Oversold (based on 7-period RSI)
Forecast: Bullish
The market is testing a major horizontal structure 0.485.
Taking into consideration the structure & trend analysis, I believe that the market will reach 0.492 level soon.
P.S
The term oversold refers to a condition where an asset has traded lower in price and has the potential for a price bounce.
Overbought refers to market scenarios where the instrument is traded considerably higher than its fair value. Overvaluation is caused by market sentiments when there is positive news.
Disclosure: I am part of Trade Nation's Influencer program and receive a monthly fee for using their TradingView charts in my analysis.
Like and subscribe and comment my ideas if you enjoy them!
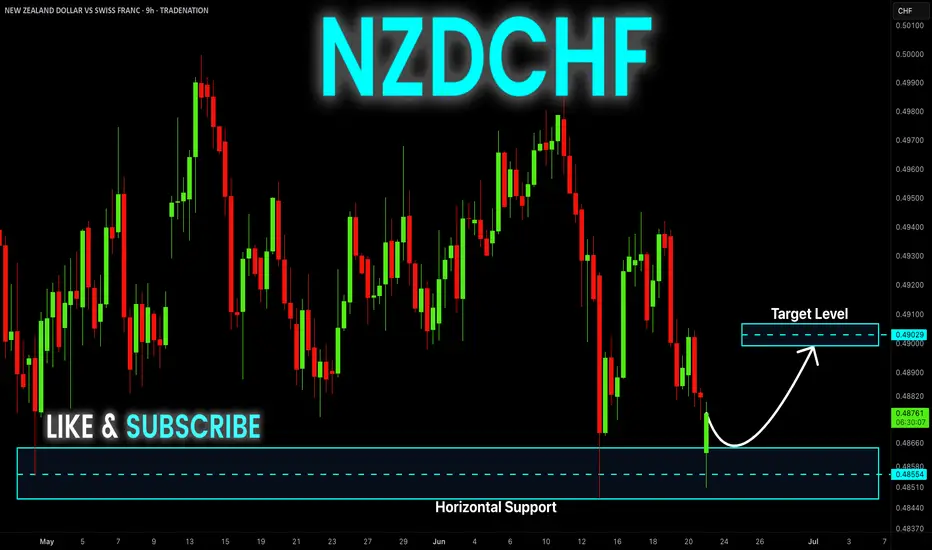
NZD-CHF Rebound Ahead! Buy!
Hello,Traders!
NZD-CHF made a retest
Of the horizontal support
Level of 0.4847 from where
We are already seeing a
Bullish rebound so we are
Locally bullish biased and
We will be expecting a
Further bullish move up
Buy!
Comment and subscribe to help us grow!
Check out other forecasts below too!
Disclosure: I am part of Trade Nation's Influencer program and receive a monthly fee for using their TradingView charts in my analysis.
NZDCHF SELLWe have officially gotten a change of trend as proven by the transition from a sequence of higher highs and higher lows to a lower low and lower high. Stacked on top of this sequence is a pullback for a retest of a key level confirming our setup.
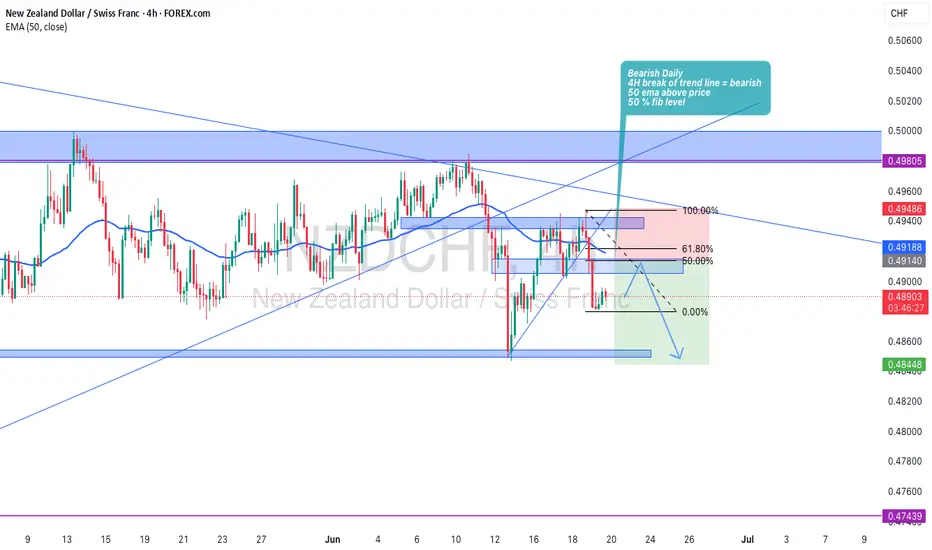
NZDCHF Bearish Bias Bearish Daily
4H break of trend line = bearish
50 ema above price
50 % fib level
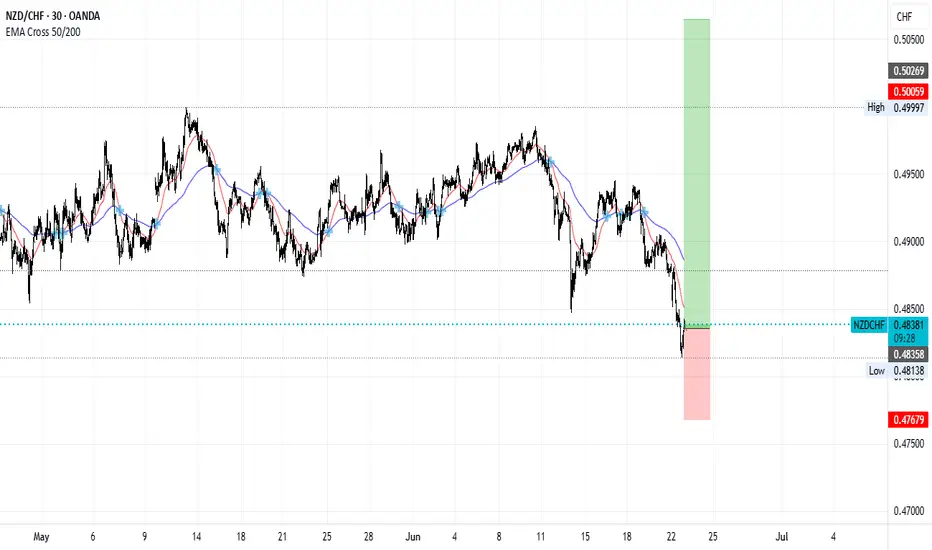
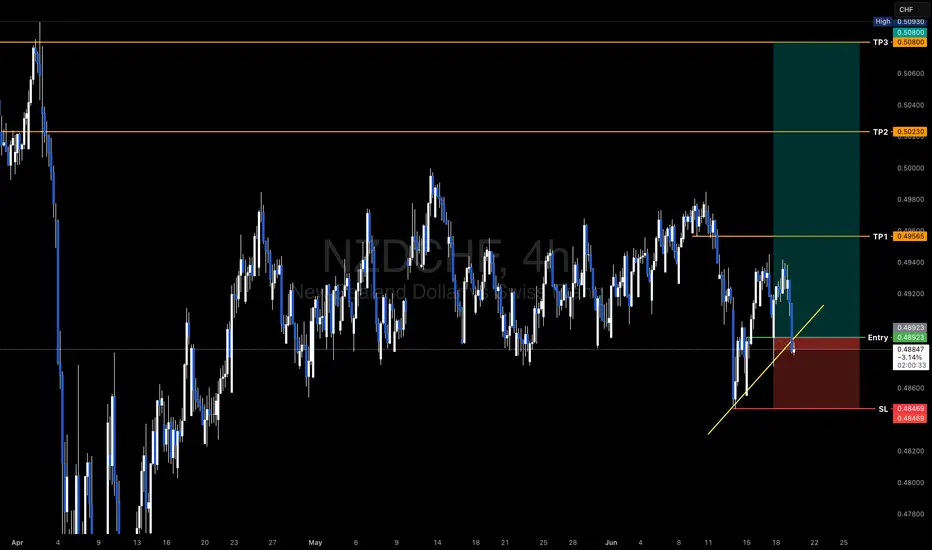
NZDCHF Swing Long – Double Bottom into Risk-On Revival🟢 LONG NZDCHF @ 0.48923 (Swing Position)
✅ Catalyst: Double bottom + RSI divergence + break above descending channel on 4H.
🛑 SL: 0.48469
🎯 TP1: 0.49565 (1:1.2 R:R)
🎯 TP2: 0.50230 (1:2.5 R:R)
🎯 TP3: 0.50800 (1:3.9 R:R)
📊 Chart: Price defended 0.4870 key structure zone. Bullish engulfing + EMA crossover signal upside continuation.
🌍 Context: CHF weakening across the board on SNB dovish tone. NZD supported by risk-on flows and commodity demand rebound.
💬 “Stacking into this swing or waiting for confirmation above 0.4950? Let’s talk setups 👇”
#Forex #NZDCHF #SwingTrading #PriceAction #SmartMoney
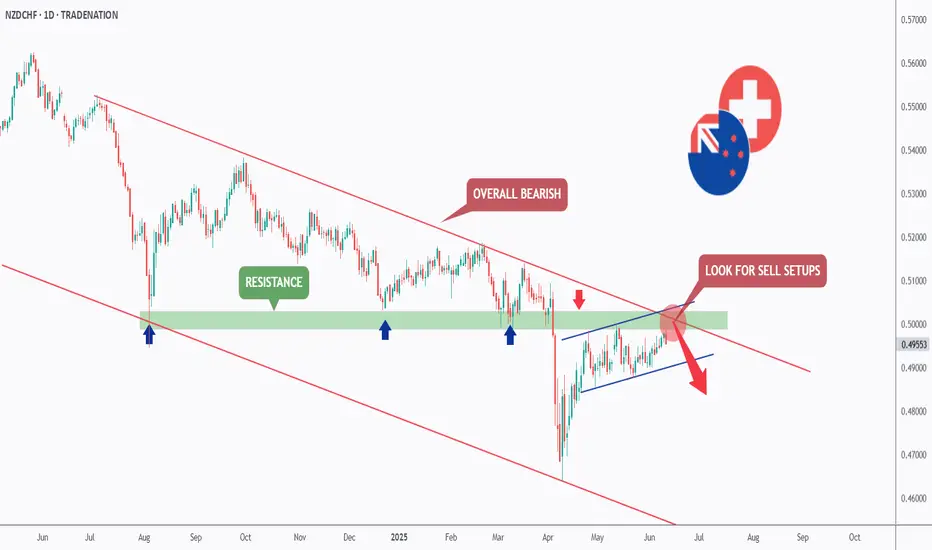
NZDCHF - The Bears Are Back!Hello TradingView Family / Fellow Traders. This is Richard, also known as theSignalyst.
📈NZDCHF has been overall bearish trading within the falling channel marked in red, and it is currently retesting the upper bound of the channel.
Moreover, the green zone is a strong resistance.
🏹 Thus, the highlighted red circle is a strong area to look for sell setups as it is the intersection of the upper red trendline and resistance.
📚 As per my trading style:
As #NZDCHF approaches the red circle zone, I will be looking for bearish reversal setups (like a double top pattern, trendline break , and so on...)
📚 Always follow your trading plan regarding entry, risk management, and trade management.
Good luck!
All Strategies Are Good; If Managed Properly!
~Rich
Disclosure: I am part of Trade Nation's Influencer program and receive a monthly fee for using their TradingView charts in my analysis.
NZDCHF SELL SETUPWe have officially gotten a change of trend as proven by the transition from a sequence of higher highs and higher lows to a lower low and lower high. Stacked on top of this sequence is a pullback for a retest of a key level confirming our setup.
NZDCHFTemporary sells on NZDCHF should follow after price tests the resistance trend line. It seems as though price is rejecting in this area, look for sells towards 0.48888
NZD/CHF BEARS ARE GAINING STRENGTH|SHORT
Hello, Friends!
It makes sense for us to go short on NZD/CHF right now from the resistance line above with the target of 0.487 because of the confluence of the two strong factors which are the general downtrend on the previous 1W candle and the overbought situation on the lower TF determined by it’s proximity to the upper BB band.
Disclosure: I am part of Trade Nation's Influencer program and receive a monthly fee for using their TradingView charts in my analysis.
✅LIKE AND COMMENT MY IDEAS✅
NZDCHFNZDCHF TRADE DONE
Reason behind trendline break down side and also sell stop trigger my entry is missed.
i will define shorter time frame with fib retracement.
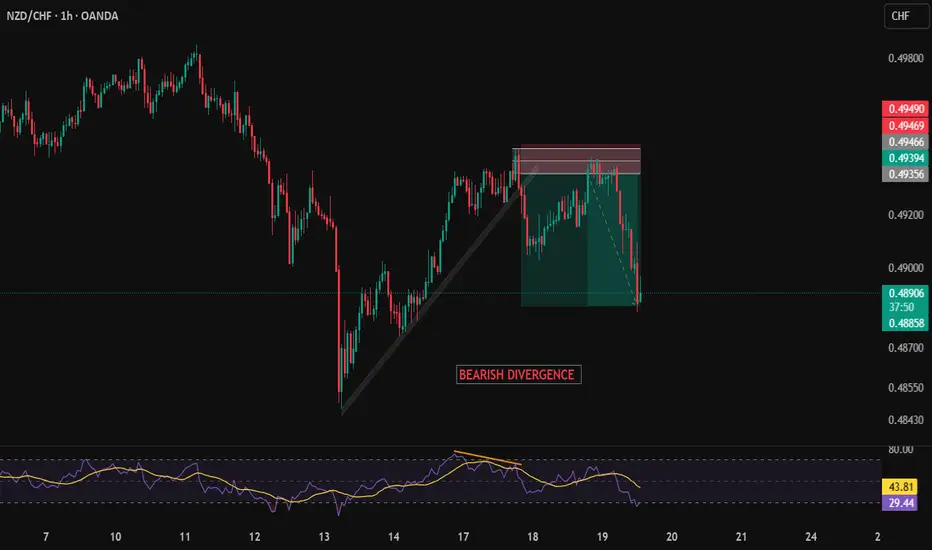
SELL NZDCHFNZDCHF displays a bearish pennant. Sell now at 0,4935
Take Profit 0,49012
Stop Loss 0,49311
NZDCHF: A LONG IDEAOANDA:NZDCHF I'm going long at the current market price targeting the 0.49712 price level

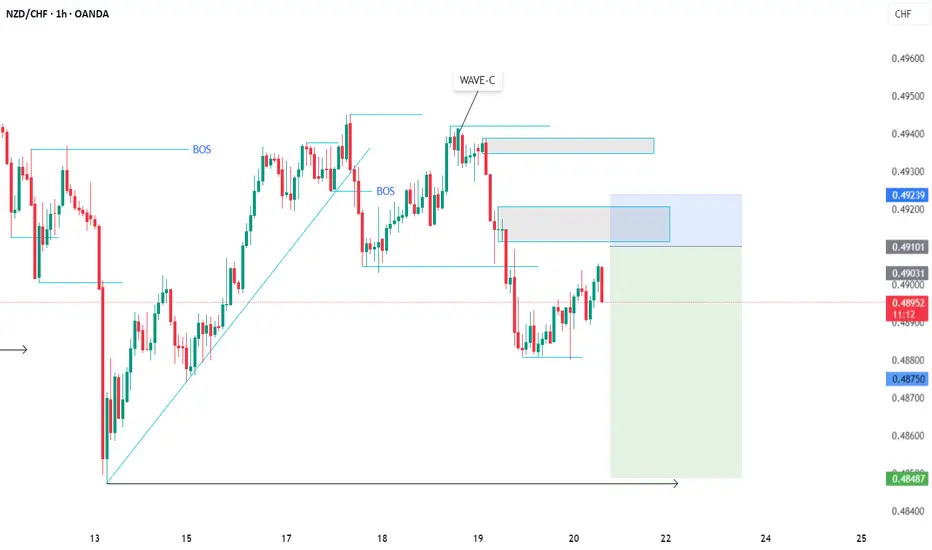
NZDCHF Trade IdeaAt 4Hr timeframe, the trend break the ascending channel and retesting it @0.4900 AOI. There is a possible valid order block @0.4920 area that the trend is heading to it. if the is any reaction with bearish candlestick pattern within the order block, then the trend will continue bearish. First target would be 0.4800.
Good Luck!
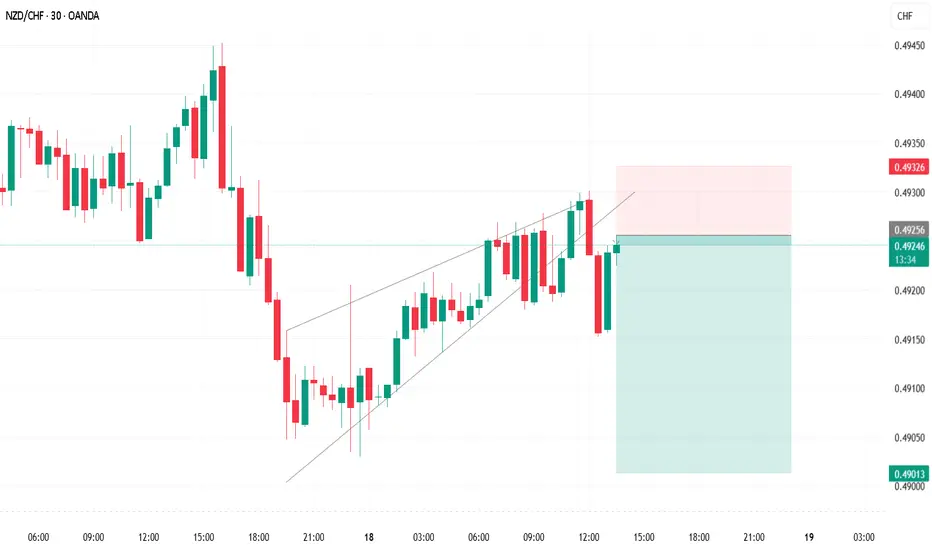
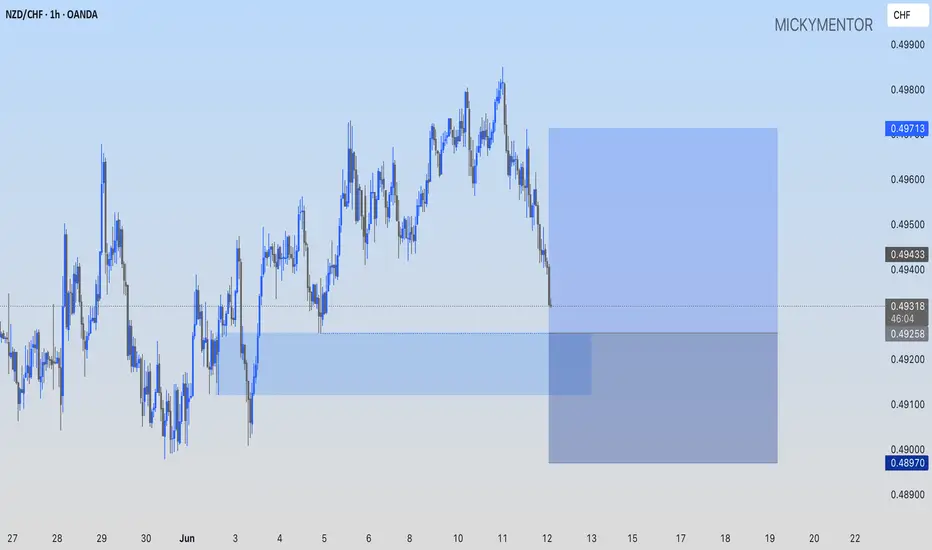
NZDCHF: A SHORT TERM BUY UNFOLDING.I'm going in for a short term buy position at 0.49258, my profit target will be at 0.49713 while I'm looking at having my stop at 0.48970.
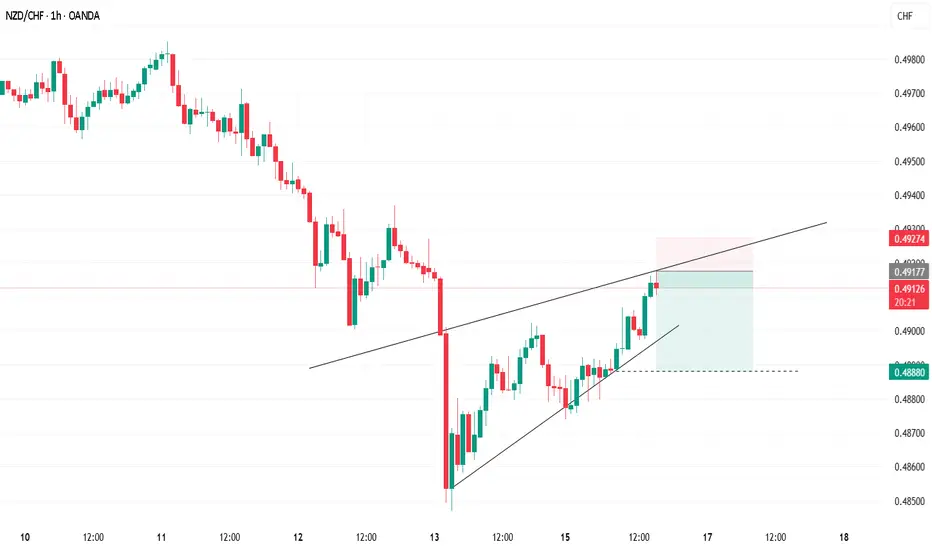
NZDCHF: Another Pullback Trade 🇳🇿🇨🇭
I see one more pullback opportunity on NZDCHF.
My confirmation is an ascending triangle pattern
formed on a key horizontal support.
Goal - 0.4896
❤️Please, support my work with like, thank you!❤️
I am part of Trade Nation's Influencer program and receive a monthly fee for using their TradingView charts in my analysis.

Shorting Trend looks to do going short matching on 3 timeframes. Just waiting for a good entry signal. We all know anything can happen. Let’s see.