NZDCHF💡Hello everyone, NZDCHF Chart Analysis The price is now touching a demand area. If the price can hold above the current support area, we may see a new bounce. ⬆️ But if the support is broken, it may be a signal of continued decline.⬇️ MACD indicator: It appears that momentum is starting to wane. If this trend continues, we are likely to see further price declines.
We monitor the chart on the lower time frame ✅
⛔️It is not investment advice, for educational purposes only.
NZDCHF trade ideas
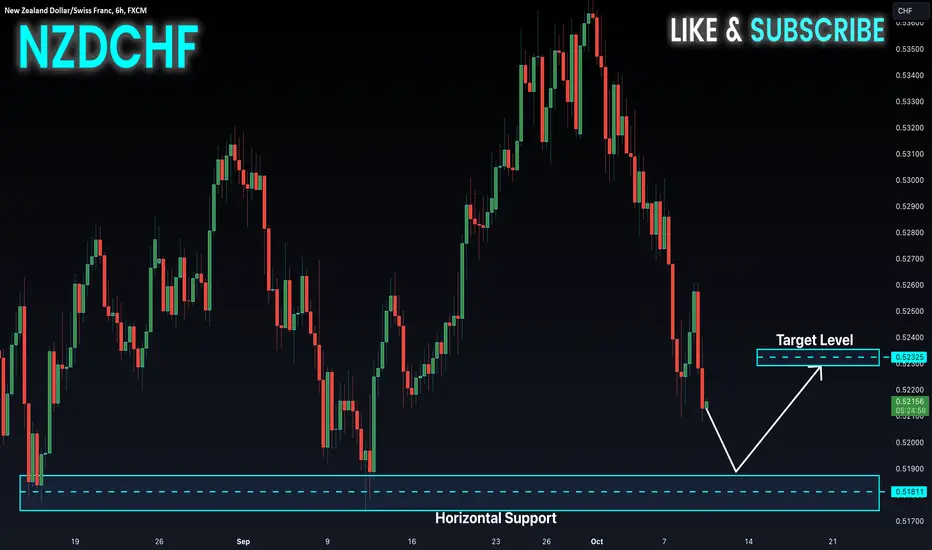
NZD-CHF Support Ahead! Buy!
Hello,Traders!
NZD-CHF keeps going
Down but a horizontal
Support level of 0.5181
Is ahead so after the
Retest we will be expecting
A local bullish rebound
Buy!
Like, comment and subscribe to help us grow!
Check out other forecasts below too!
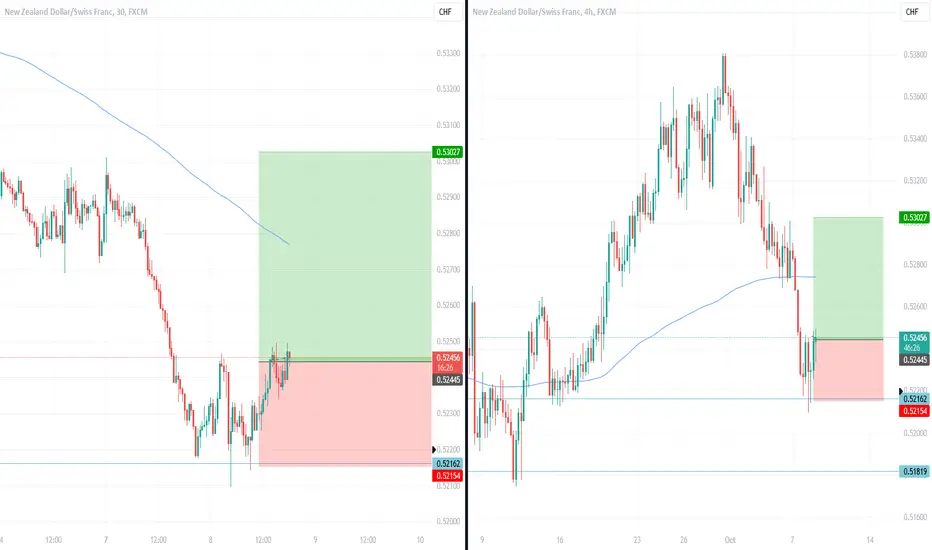
FX-Diaries: NZDCHF 4H long First setup of the week.
There is a clean downtrend reaching support.
Followed by a couple of pinbars, One deeper that the other.
That's what I like to see because it means price is searching for liquidity and stops are hit.
after the engulfing candle I entered the trade
NZD/CHF Tentative Uptrend To Continue?A little bit of CHF weakness on dovish MP and mostly an absence of risk off has caused tentative rallies across the board.
Weakness in NZD this AM finally bringing you to lower side of TL. Initial reaction is not good, so no real high risk here.
NZDCHF LONGNZDCHF is trading on a double bottom pattern, a valid break above 0.52600 will signal a buy option . Goodluck!

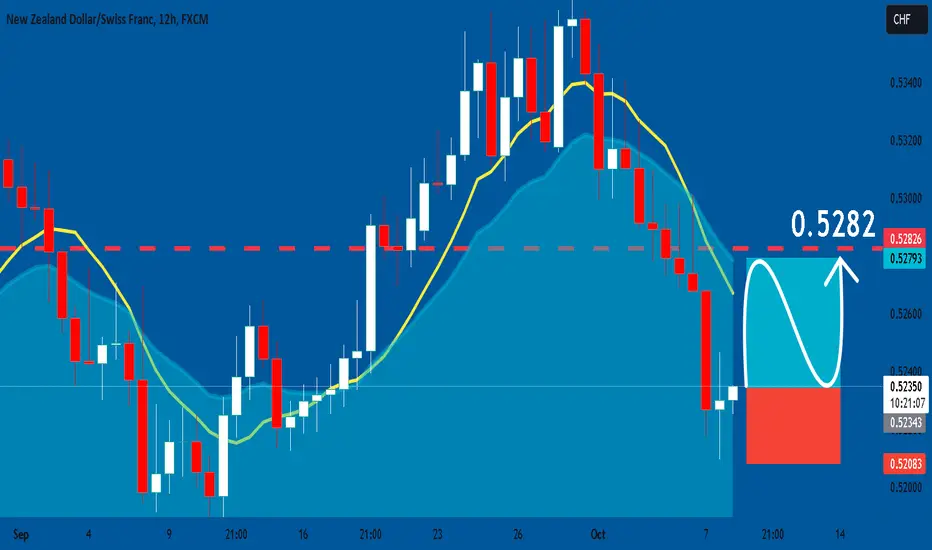
NZDCHF: Long Trade Explained
NZDCHF
- Classic bullish setup
- Our team expects bullish continuation
SUGGESTED TRADE:
Swing Trade
Long NZDCHF
Entry Point - 0.5234
Stop Loss - 0.5208
Take Profit - 0.5282
Our Risk - 1%
Start protection of your profits from lower levels
❤️ Please, support our work with like & comment! ❤️
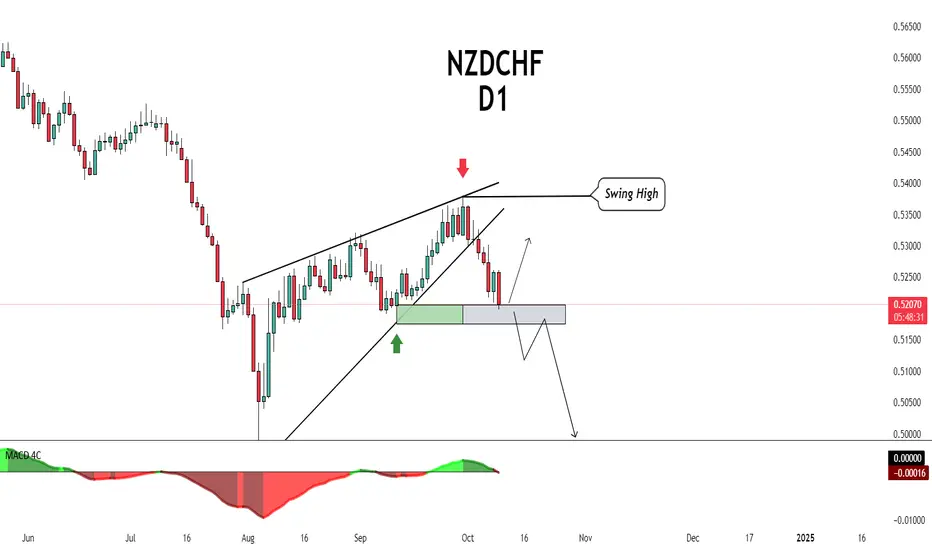
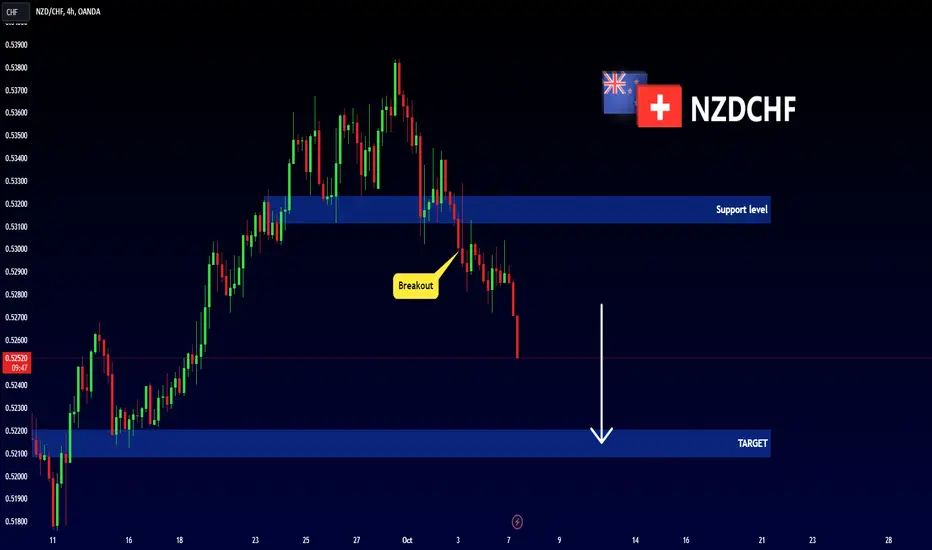
NZDCHF - Important Breakout !Hello Traders !
The NZDCHF failed to create a new higher high !
At the moment, The support level (0.53114 - 0.53235) is broken !
So, i predict a bearish move 📉
______________
TARGET: 0.52205🎯
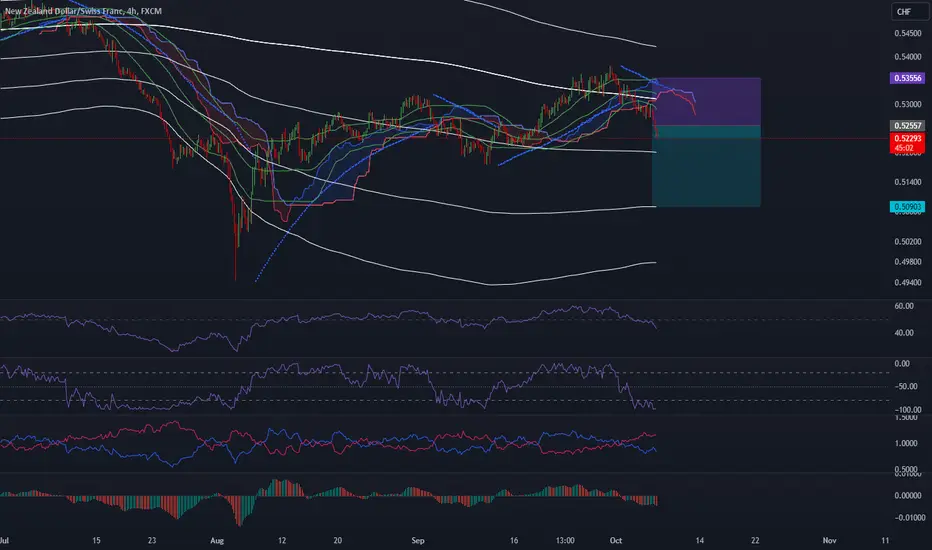
NZDCHFThe current price is trading below the baseline and key technical indicators such as RSI and Williams %R, signaling a potential shift towards bearish control over the price movement.
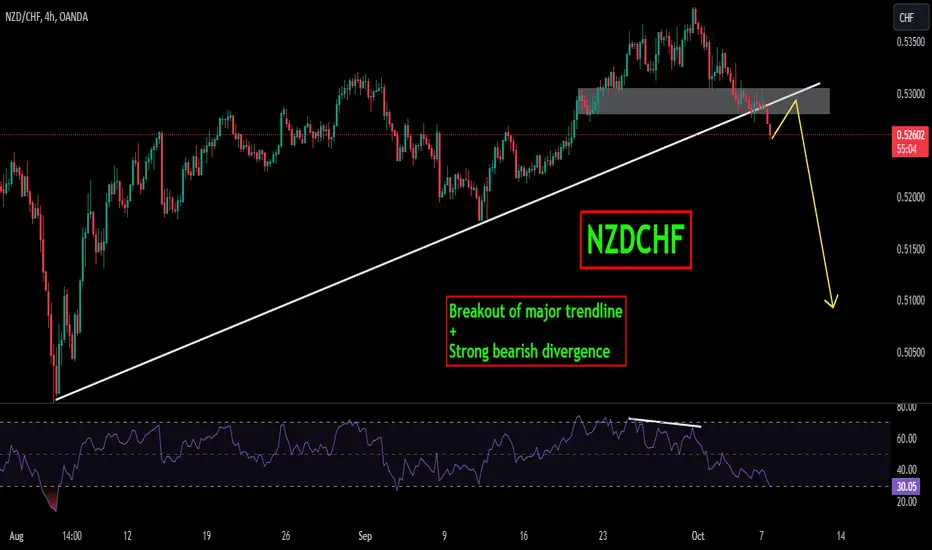
NZDCHFIs NZDCHF exhausting at resistance zone?
As the price is been on high bull run but now it seems like price is lacking bullish momentum after printing double top pattern at resistance level and bearish divergence suggesting the sell pressure is about to start.
If the bears took control , the 1st target could be 0.5100 followed 0.5000
What you guys think of it?
NZD/CHF BEST PLACE TO BUY FROM|LONG
Hello, Friends!
It makes sense for us to go short on NZD/CHF right now from the resistance line above with the target of 0.531 because of the confluence of the two strong factors which are the general downtrend on the previous 1W candle and the overbought situation on the lower TF determined by it’s proximity to the upper BB band.
✅LIKE AND COMMENT MY IDEAS✅

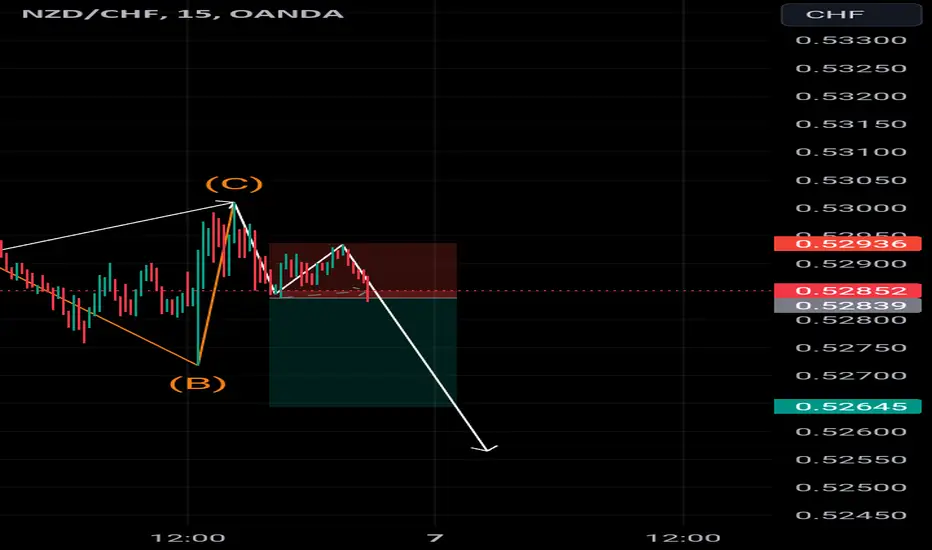
short nzdchfin this setup we have a nice ABC running flat , we are shorting this hoping 2/1 risk to reward
NZDCHF Elliott Wavehello friends
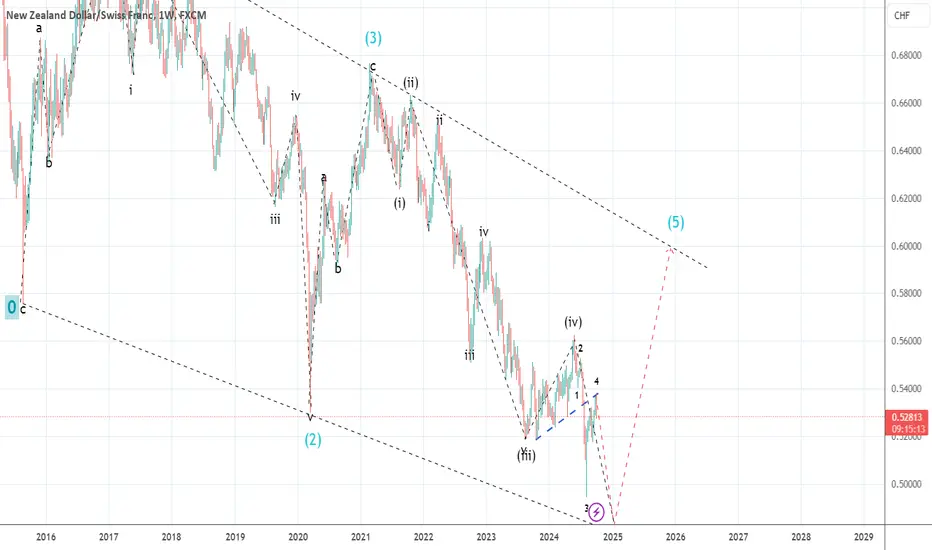
In the NZDCHF currency pair, we see the formation of a 5-wave pattern with overlapping waves (waves marked in pale blue).
This only happens in triangles.
Therefore, we are faced with a normal triangle or an end triangle that is formed in waves 5 or C.
In both cases, when the price hits the line drawn at the bottom of the triangle (line 0-2), we should witness the change of trend from downward to upward.
The last micro wave which is indicated by small numbers 1-5 has not been completed yet.
Therefore, we expect to witness a relatively strong and large rise with sub-wave 5 and reaching the trend line drawn at the bottom of the triangle.
My theory is that for now, the trend is downward until microwave 5 is formed and reaches the bottom of the triangle, and then the upward trend begins.
To support me, I recommend you install Trading View software on your phone and see my analysis and support me with your comments and Boost. Be successful and profitable.
NZDCHF Will Explode! BUY!
My dear followers,
I analysed this chart on NZDCHF and concluded the following:
The market is trading on 0.5280 pivot level.
Bias - Bullish
Technical Indicators: Both Super Trend & Pivot HL indicate a highly probable Bullish continuation.
Target - 0.5323
Safe Stop Loss - 0.5254
About Used Indicators:
A super-trend indicator is plotted on either above or below the closing price to signal a buy or sell. The indicator changes color, based on whether or not you should be buying. If the super-trend indicator moves below the closing price, the indicator turns green, and it signals an entry point or points to buy.
———————————
WISH YOU ALL LUCK

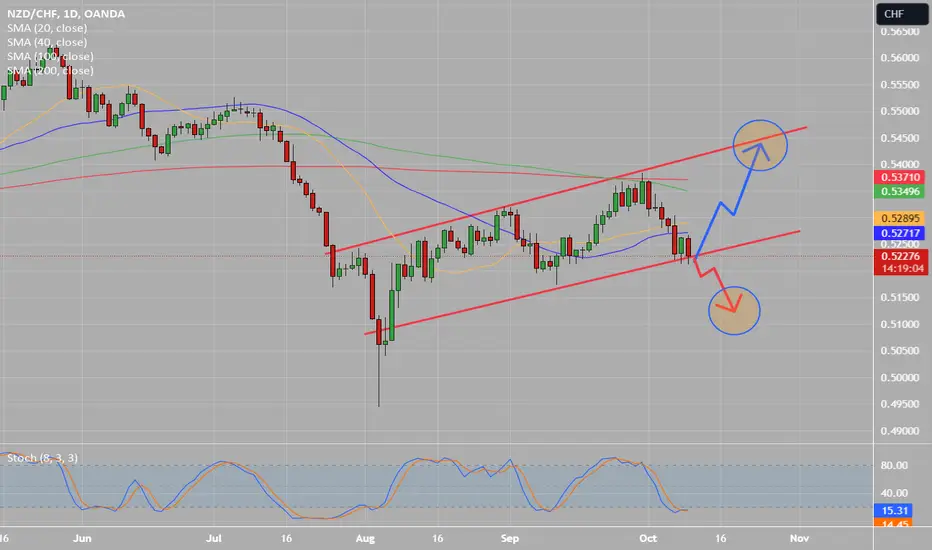
nzdchf buyprice is retesting a trend line, and expecting a bullish run to wards 0.5700 area. A strong daily close would confirm this
NZDCHF: Market Sentiment & Forecast
The recent price action on the NZDCHF pair was keeping me on the fence, however, my bias is slowly but surely changing into the bullish one and I think we will see the price go up.
❤️ Please, support our work with like & comment! ❤️

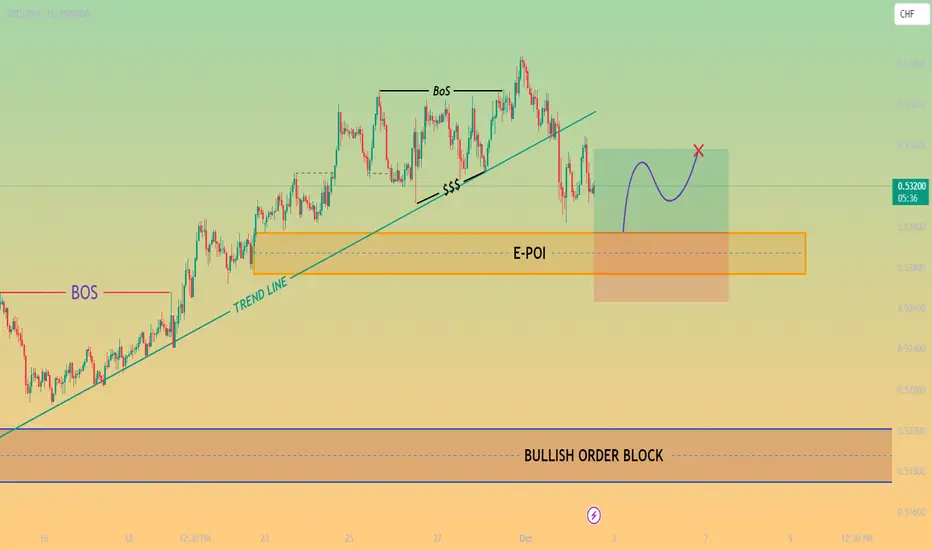
NZDCHF is expected to rise from a Point of Interest (POI)NZDCHF is expected to rise from a Point of Interest (POI), which is a key price zone between 0.52969 and 0.52770. A bullish order block (an area where buyers previously entered the market) in the higher time frame is located between 0.52006 and 0.51746, providing additional support.
Based on advanced price action and Smart Money Concepts.
The analysis suggests the
Entry Price :- 0.52974
Take Profit :- 0.53378
Stop Loss :- 0.52632
This strategy is aimed at capturing an upward move in the market from this key price zone.
NZDCHF SHORTNZDCHF Showing signs of been bearish. Therefore, I will be looking for shorting opportunities

NZDCHF PA based trade
NZDCHF price action based analysis, price is have strong bounce from resistance zone, its make strong bearish push till zone 0.63200.
Now expecting to see bounce on 0.63200 - recovery phase, till resistance zone 0.53800

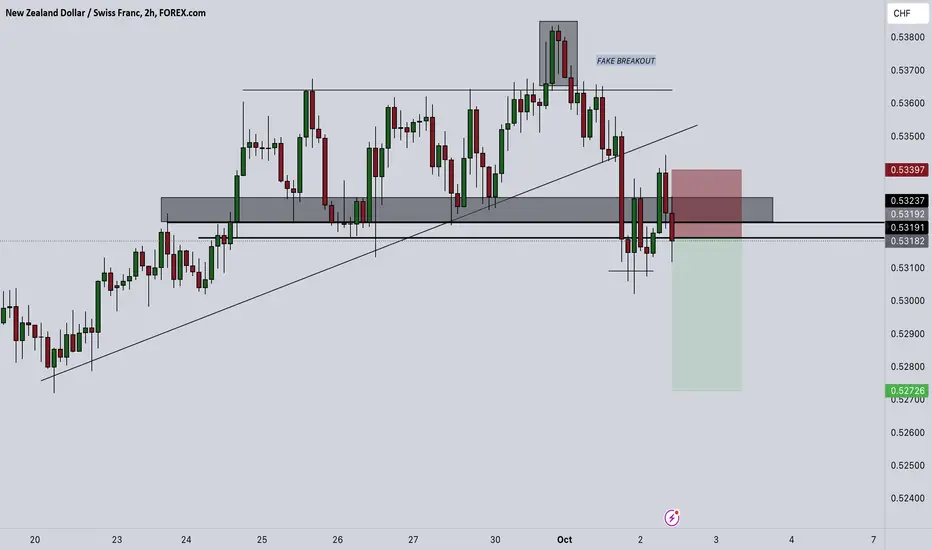
NZDCHF SHORTNZDCHF SHORT price rejected the new high with fake breakout which pushed price with liquidity for short
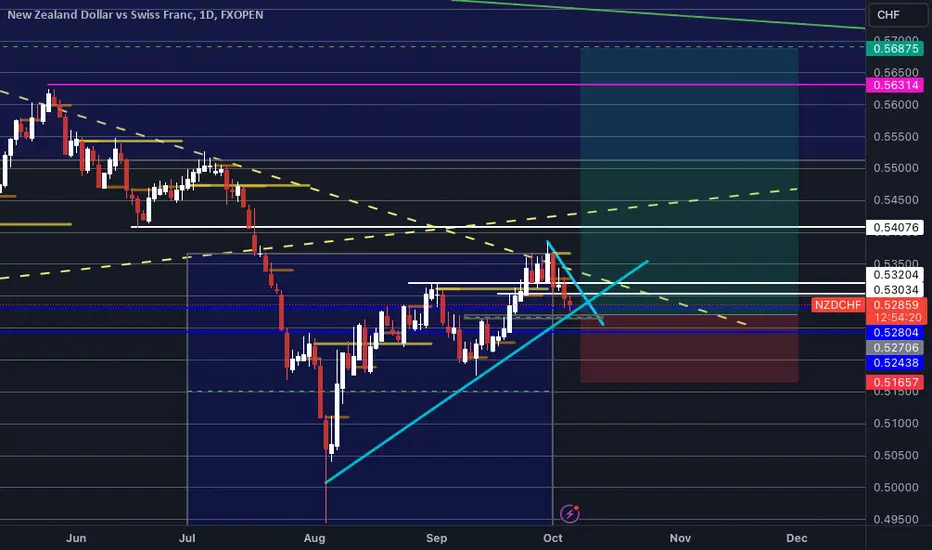
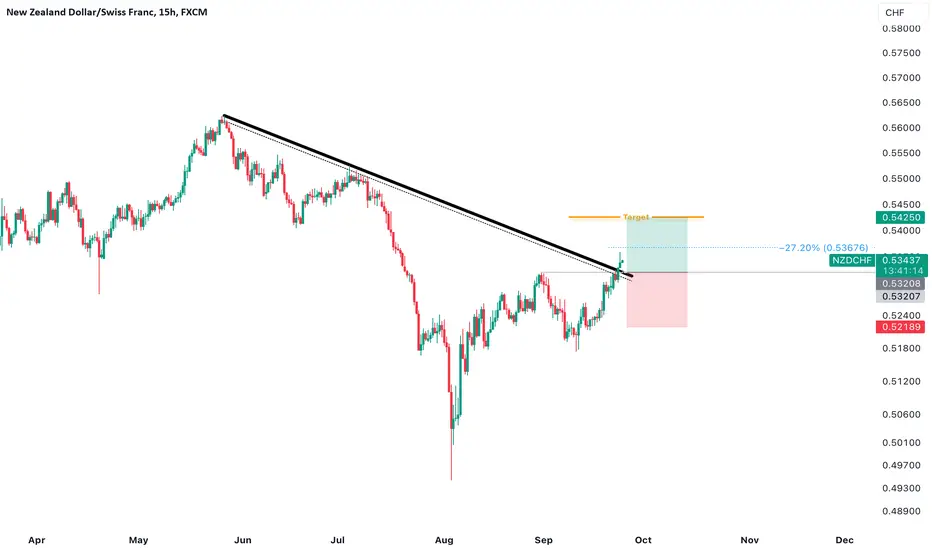
NZDCHF - LongThe NZD/CHF currency pair has recently transitioned into a bullish market phase. We are considering a long position contingent upon a retracement to our buy limit order set at 0.53207. However, it is essential to approach this trade with caution, as the market may exhibit sharp bearish swings despite the overall bullish confirmation.
Key Levels:
Entry Point: 0.53207
Breakeven Point: Located at the -27 Fibonacci level
Target Price: The target is set based on chart analysis, with a maximum target of 0.54250.
Regular updates will be provided to monitor the trade's progress and any changes in market conditions. Stay vigilant for potential volatility, and adjust strategies as necessary.
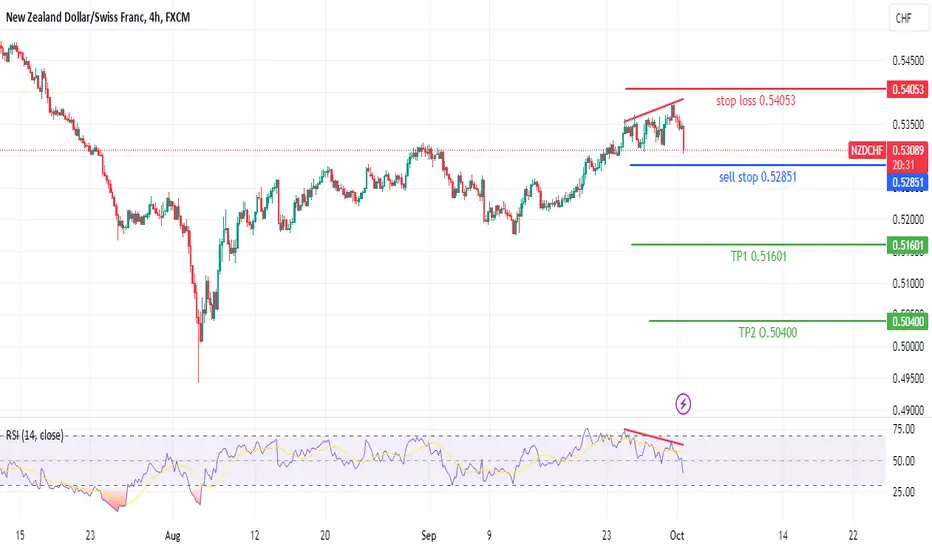
NZDCHF SHORTNZDCHF is making Higher Highs and Higher Lows, it Is in up trend but now it formed RSI divergence. it will likely to change its up trend into down trend so place the sell stop order below HL
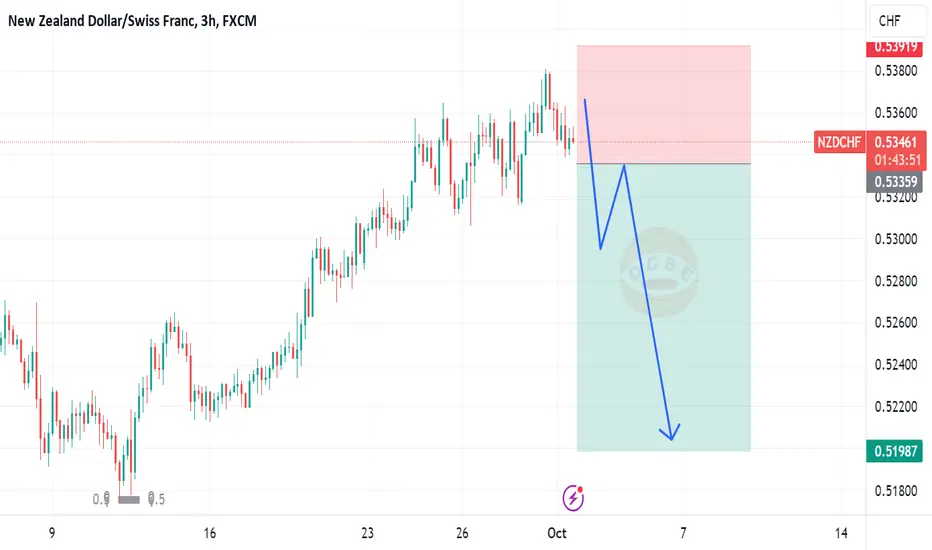
NZDCHF short moveI believe if price cloud break our support level we cloud see more downward move in price.
NZDCHF Buy ForecastNZDCHF New forecast👨💻👨💻
Note:
Follow proper risk management rules. Never risk more then 2% of your total capital. Money management is the key of success in this business...... Set your own SL & TP.
Please support this idea with a Like and COMMENT if you find it useful click "follow" on our profile if you will like these type of trading ideas delivered straight to your email in the future.
Thanks for your continued support!! lemme know your thoughts in the comment sec...
