NZDCHF EVERYDAY TRADE SETUP R:R 1:3Dear All,
this my idea for sell once sell candle Confirm then i go short
this is my ideas only. what you flow your trading statistics you can continue.
you need more my ideas flow me
NZDCHF trade ideas

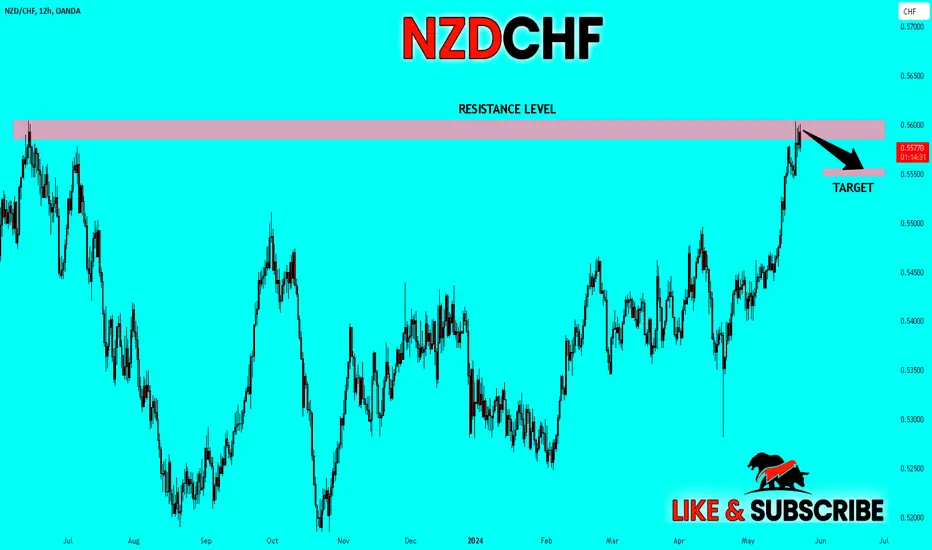
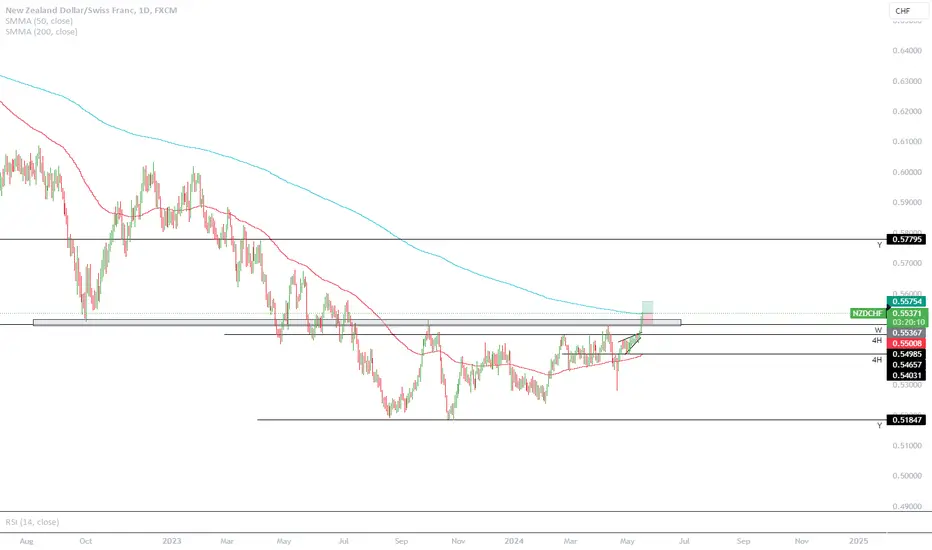
✅NZD_CHF SWING SHORT🔥
✅NZD_CHF went up to retest a horizontal resistance level of 0.5600
Which makes me locally bearish biased
And I think that a move down
From the level is to be expected
Towards the target below at 0.555
SHORT🔥
✅Like and subscribe to never miss a new idea!✅
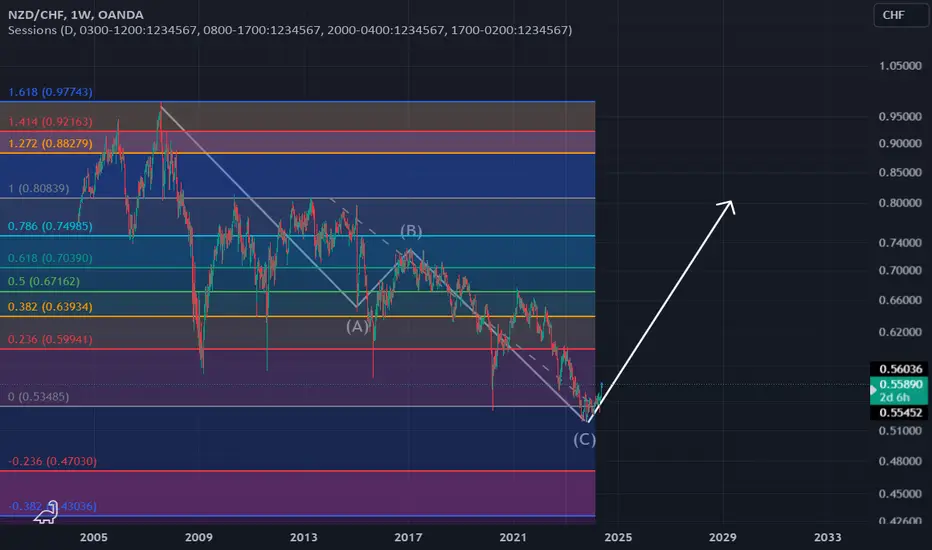
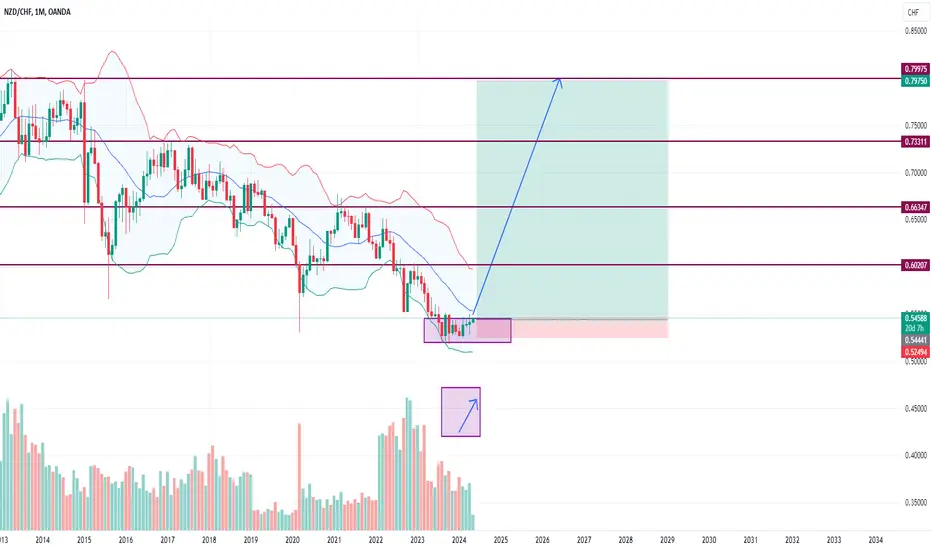
NZD CHF long trade of the yearNZD CHF has completed 3 wave correction on the weekly. Expect strong push to the upside on this pair. Great swing trade setup. Please confirm with your strategy before entering a trade! Let me know if you have any comments or questions ill be happy to answer them!
NZDCHF Trading Opportunity! BUY!
My dear subscribers,
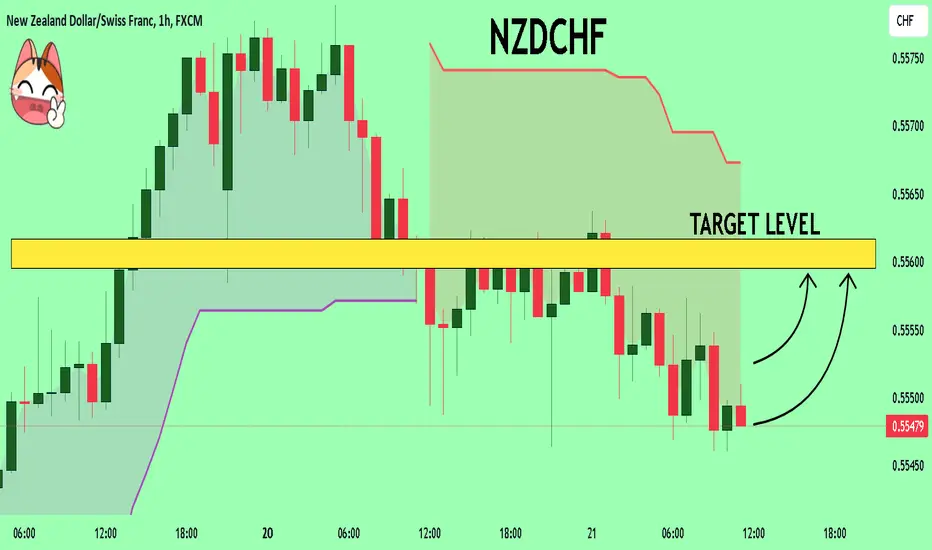
NZDCHF looks like it will make a good move, and here are the details:
The market is trading on 0.5548 pivot level.
Bias - Bullish
Technical Indicators: Both Super Trend & Pivot HL indicate a highly probable Bullish continuation.
Target - 0.5559
About Used Indicators:
The average true range ATR plays an important role in 'Supertrend' as the indicator uses ATR to calculate its value. The ATR indicator signals the degree of price volatility.
———————————
WISH YOU ALL LUCK
NZD/CHF For Bullish as Swing Tradeyou can go long now
or
wait for creating higher low (blue arrow) and go long
- General Trend is Up Trend
- NZD is good news
- Target 3 is High Monthly Resistance so be patient
have fun :)

Nzdchf sellNzdchf sell, after almost 7 months of Hhs and HLs, this pair is ready for a pullback, liquidity’s been grab, strong resistance reached and down we go baby. Risk management , happy trade guys.

NZDCHF I Impulse correction and potential continuation Welcome back! Let me know your thoughts in the comments!
** NZDCHF Analysis - Listen to video!
We recommend that you keep this pair on your watchlist and enter when the entry criteria of your strategy is met.
Please support this idea with a LIKE and COMMENT if you find it useful and Click "Follow" on our profile if you'd like these trade ideas delivered straight to your email in the future.
Thanks for your continued support!

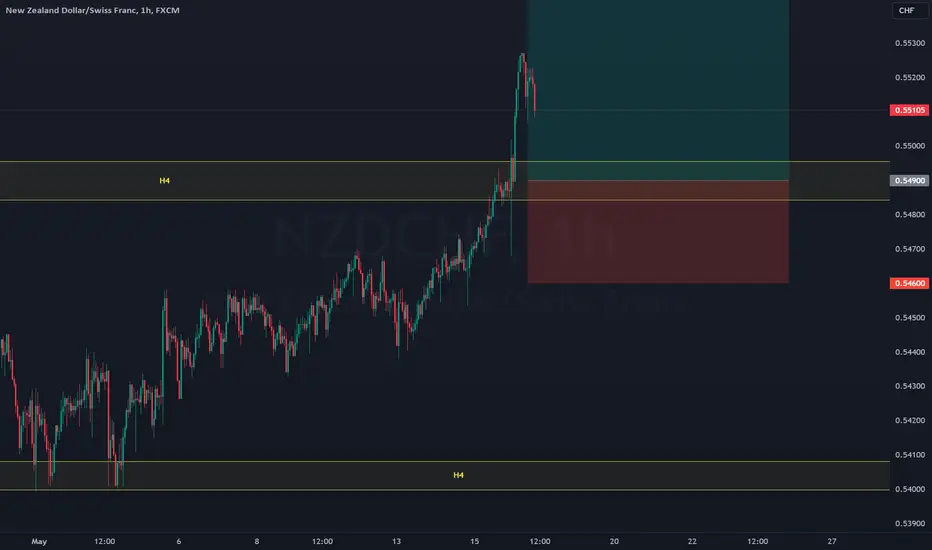
NZDCHF LongPrice action daytrading
Price is bullish bias on H4 & higher TF. Taking a bullish bias. Price has broken the resistance level.
Going to H1 TF, Price still reacting strongly from the broken resistance level. Trading breakout & retest strategy. Set Long target at the broken level targeting Daily Swing High with a tighter SL for better R:R
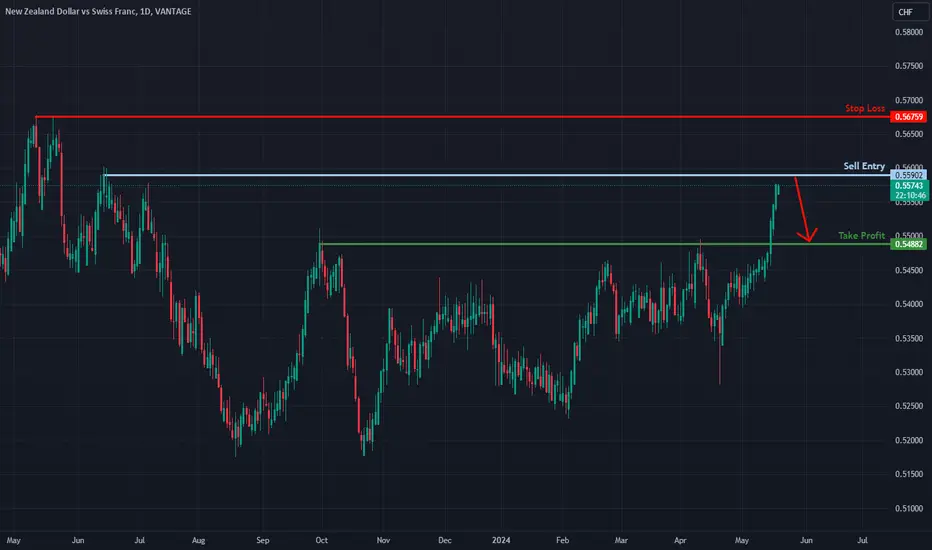
Potential bearish drop?NZD/CHF is rising towards a resistance level which is a pullback resistance and could fall to our take profit.
Entry: 0.55902
Why we like it:
There is a pullback resistance level.
Stop loss: 0.56759
Why we like it:
There is a pullback resistance.
Take profit: 0.54882
Why we like it:
There is a pullback support level.
Please be advised that the information presented on TradingView is provided to Vantage (‘Vantage Global Limited’, ‘we’) by a third-party provider (‘Everest Fortune Group’). Please be reminded that you are solely responsible for the trading decisions on your account. There is a very high degree of risk involved in trading. Any information and/or content is intended entirely for research, educational and informational purposes only and does not constitute investment or consultation advice or investment strategy. The information is not tailored to the investment needs of any specific person and therefore does not involve a consideration of any of the investment objectives, financial situation or needs of any viewer that may receive it. Kindly also note that past performance is not a reliable indicator of future results. Actual results may differ materially from those anticipated in forward-looking or past performance statements. We assume no liability as to the accuracy or completeness of any of the information and/or content provided herein and the Company cannot be held responsible for any omission, mistake nor for any loss or damage including without limitation to any loss of profit which may arise from reliance on any information supplied by Everest Fortune Group.
NZDCHFAs price hit resistence area and rising wedge expect to fall then upppppppppp pls like for support

NZDCHF Technical Analysis and Trade IdeaOn the daily timeframe, the NZDCHF has displayed a strong bullish trend. Our focus is currently on identifying a buying opportunity that aligns with the continuation of this trend. Assuming price action unfolds as analyzed in the video, we anticipate favorable trading conditions. The video covers critical aspects such as trend analysis, price action insights, market structure, and a potential trade setup. As always, exercise prudent risk management when trading, and remember that this information is purely educational and not financial advice. 📈👍

OPPORTUNITY FOR BUY NZDCHFWe have these indicators for BUY opportunity:
- Support from a Monthly low level
- Low volume to continue the current direction
- Strong support line (historical low)
We define 3 goals:
TP 1 = 40 pips
TP 2 = 100 pips
TP 3 = 200 pips
SL = -200 pips

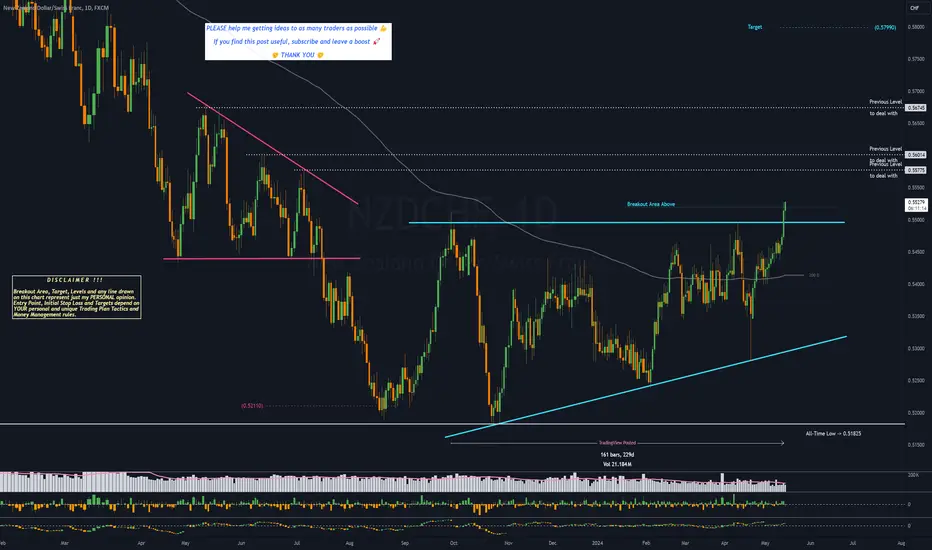
NZDCHF - 8 months ASCENDING TRIANGLE══════════════════════════════
Since 2014, my markets approach is to spot
trading opportunities based solely on the
development of
CLASSICAL CHART PATTERNS
🤝Let’s learn and grow together 🤝
══════════════════════════════
Hello Traders ✌
After a careful consideration I came to the conclusion that:
- it is crucial to be quick in alerting you with all the opportunities I spot and often I don't post a good pattern because I don't have the opportunity to write down a proper didactical comment;
- since my parameters to identify a Classical Pattern and its scenario are very well defined, many of my comments were and would be redundant;
- the information that I think is important is very simple and can easily be understood just by looking at charts;
For these reasons and hoping to give you a better help, I decided to write comments only when something very specific or interesting shows up, otherwise all the information is shown on the chart.
Thank you all for your support
🔎🔎🔎 ALWAYS REMEMBER
"A pattern IS NOT a Pattern until the breakout is completed. Before that moment it is just a bunch of colorful candlesticks on a chart of your watchlist"
═════════════════════════════
⚠ DISCLAIMER ⚠
The content is The Art Of Charting's personal opinion and it is posted purely for educational purpose and therefore it must not be taken as a direct or indirect investing recommendations or advices. Any action taken upon these information is at your own risk.
Forex Trading + 3 Step Rocket Booster StrategyInside this video, you will see
how powerful the rocket booster strategy is
how to determine an uptrend
then finally how to see a new high in price
watch this video to learn more
--
Disclaimer: Trading is risky and you will lose money please do your own research and understand risk management strategies

NZDCHF LongPrice action daytrading.
H4 TF, price is bullish setting a new close high. Price also broken the H4 resistance level going higher.
Set long trade at the broken horizontal level. SL below the H1 swing low. Targeting Daily Swing High to get a better R:R.
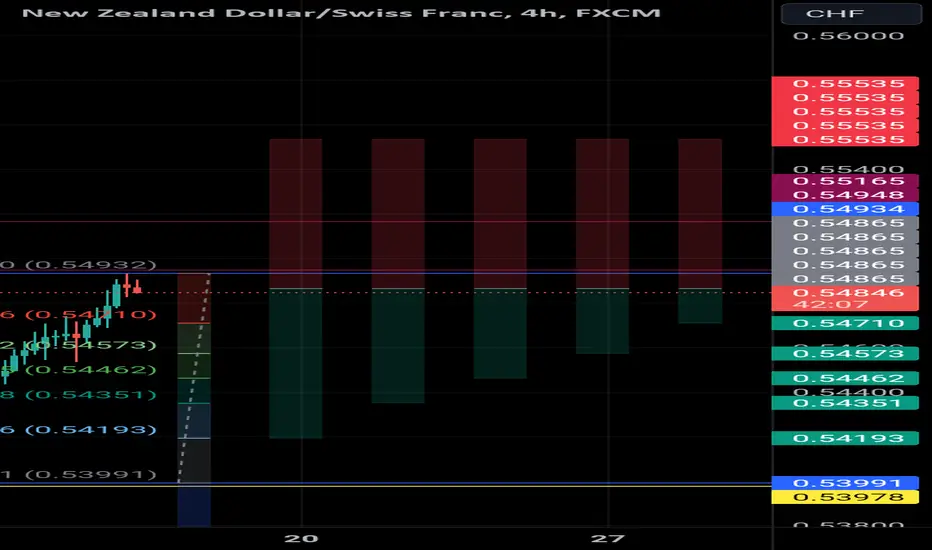
NZDCHF Short Trade Setup A #short trade opportunity recently presented itself on the #kiwiswissy (#NZDCHF) #trading chart 📉.
This is indicated by the #bearish harami candlestick 🕯️ pattern just below the 0.54948 horizontal resistance level.
This indicates a rejection of the same level, with potential price move in the downward 👇 ⬇️ direction (#sell).
Sufficient downward momentum should see price dumping towards the 0.54000 psychological level and possibly testing the strength of the 0.53978 horizontal support level.
As always, please apply appropriate risk management.
Happy trading!
#crosspair
NZD/CHF BEARISH BIAS RIGHT NOW| SHORT
Hello,Friends!
NZD/CHF uptrend evident from the last 1W green candle makes short trades more risky, but the current set-up targeting 0.546 area still presents a good opportunity for us to sell the pair because the resistance line is nearby and the BB upper band is close which indicates the overbought state of the NZD/CHF pair.
✅LIKE AND COMMENT MY IDEAS✅

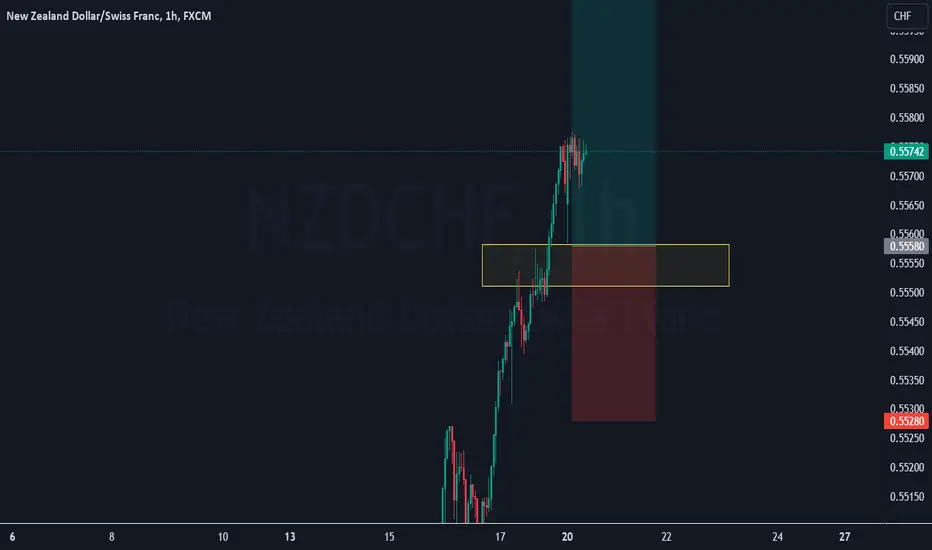
Looking for the Sell I have been waiting for this setup, want it to push into the supply and I'll take my first entry
NZDCHF LongNear historical Lows for months now and consolidating. Looking for the big push back up. This combined with fundamentals makes for a pleasant buy and hold. My Account Currency is in AUD so also making positive interest daily while holding a long position
NZDCHF: Bearish Continuation & Short Signal
NZDCHF
- Classic bearish formation
- Our team expects pullback
SUGGESTED TRADE:
Swing Trade
Short NZDCHF
Entry - 0.5458
Sl - 0.5469
Tp - 0.5435
Our Risk - 1%
Start protection of your profits from lower levels
❤️ Please, support our work with like & comment! ❤️

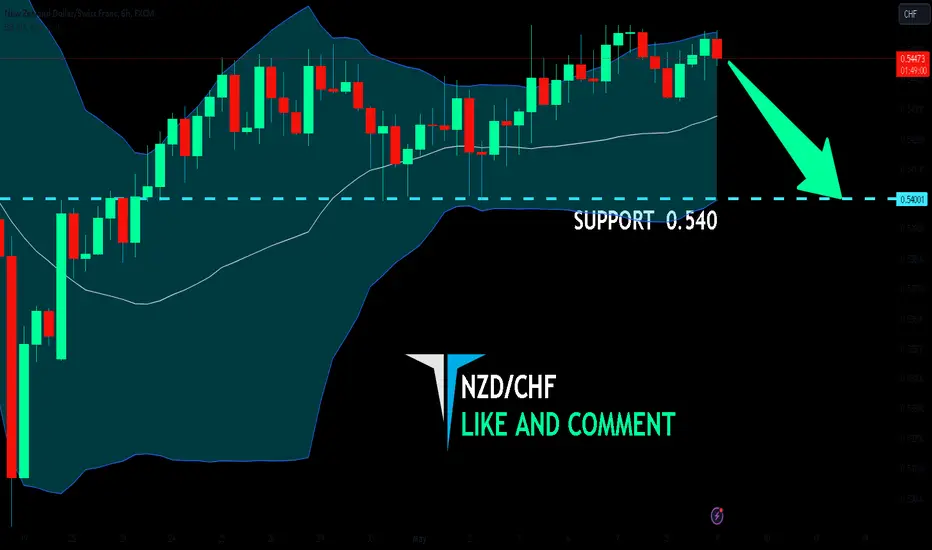
NZD/CHF BEARS ARE GAINING STRENGTH|SHORT
Hello,Friends!
NZD/CHF pair is in the uptrend because previous week’s candle is green, while the price is obviously rising on the 6H timeframe. And after the retest of the resistance line above I believe we will see a move down towards the target below at 0.540 because the pair overbought due to its proximity to the upper BB band and a bearish correction is likely.
✅LIKE AND COMMENT MY IDEAS✅
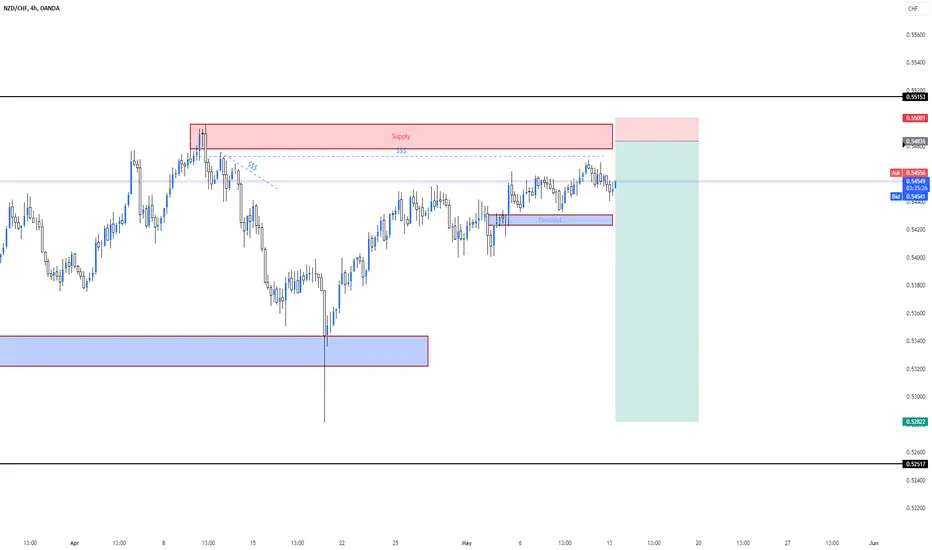
NZDCHF: Important Breakout 🇳🇿🇨🇭
NZDCHF broke and closed above a key daily horizontal structure resistance.
The broken structure turned into a demand zone.
I will expect a bullish continuation on the pair.
Next resistance - 0.5485
❤️Please, support my work with like, thank you!❤️
