NZDCHF My Opinion! SELL!
My dear friends,
NZDCHF looks like it will make a good move, and here are the details:
The market is trading on 0.5449 pivot level.
Bias - Bearish
Technical Indicators: Supper Trend generates a clear short signal while Pivot Point HL is currently determining the overall Bearish trend of the market.
Goal - 0.5434
About Used Indicators:
Pivot points are a great way to identify areas of support and resistance, but they work best when combined with other kinds of technical analysis
———————————
WISH YOU ALL LUCK
NZDCHF trade ideas
NZDCHF| POSSIABLE BUY SETUP|DEATIALS ON CAPTIONCONFLUENCE
-Price is oversold
-Reacted from broken bearish OB
-Filled new weak opening gap
-Took out PDL
-PHG remains as LQ

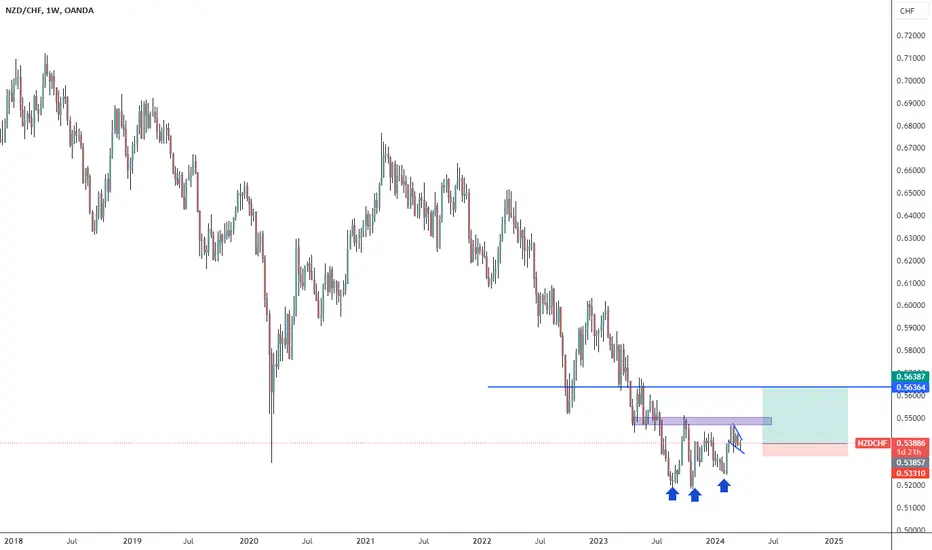
NZD/CHF ShortLike her sister AUDCHF, this pair is experiences some difficulties to go higher and is at a monthly high. A divergence has formed and if the price breaks the horizontal support it is then time to sell.
TP 1 0.54
TP 2 ----> Previous monthly low (around 0.564)

NZD/CHF SHORT FROM RESISTANCE
Hello,Friends!
NZD/CHF pair is in the downtrend because previous week’s candle is red, while the price is obviously rising on the 3H timeframe. And after the retest of the resistance line above I believe we will see a move down towards the target below at 0.541 because the pair is overbought due to its proximity to the upper BB band and a bearish correction is likely.
✅LIKE AND COMMENT MY IDEAS✅

Nzdchf sell trade- *Moving Averages*: The moving averages may suggest a bearish trend if the short-term averages are below the long-term averages. For instance, if the 10-period Exponential Moving Average (EMA) is below the 20-period EMA, it could indicate a bearish momentum.
- *Oscillators*: Oscillators like the Relative Strength Index (RSI) or the Stochastic %K might be trending towards overbought conditions, which can signal a potential reversal to the downside.
- *Pivot Points*: If the price is below the central pivot point and making lower highs and lower lows, it could be an indication of a bearish trend continuation.
- *Volume*: Lower volume on upswings and higher volume on downswings can confirm bearish sentiment.
- *Price Action*: A series of bearish candlestick patterns, such as bearish engulfing or three black crows, could be observed, reinforcing the bearish outlook.
- *Chart Patterns*: Bearish chart patterns like head and shoulders, double tops, or rising wedges might be forming, indicating potential downward movements.

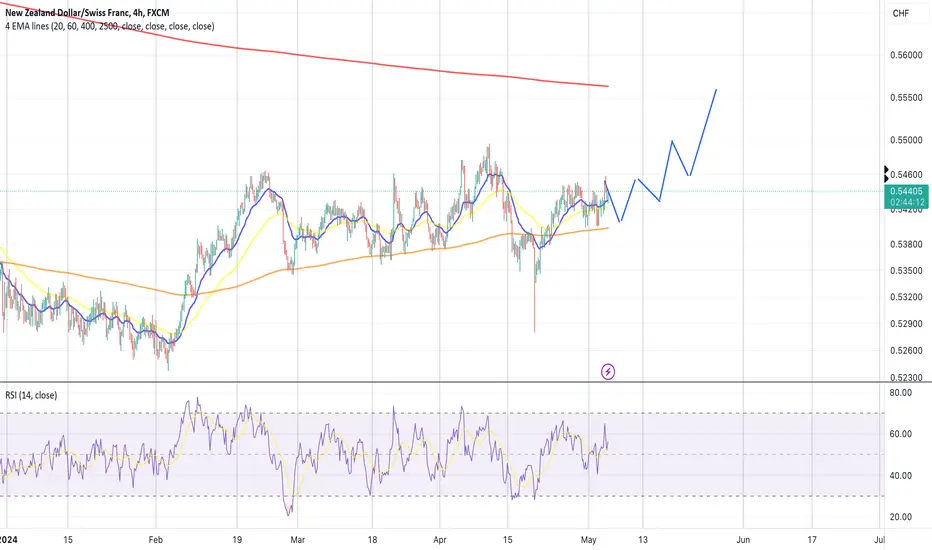
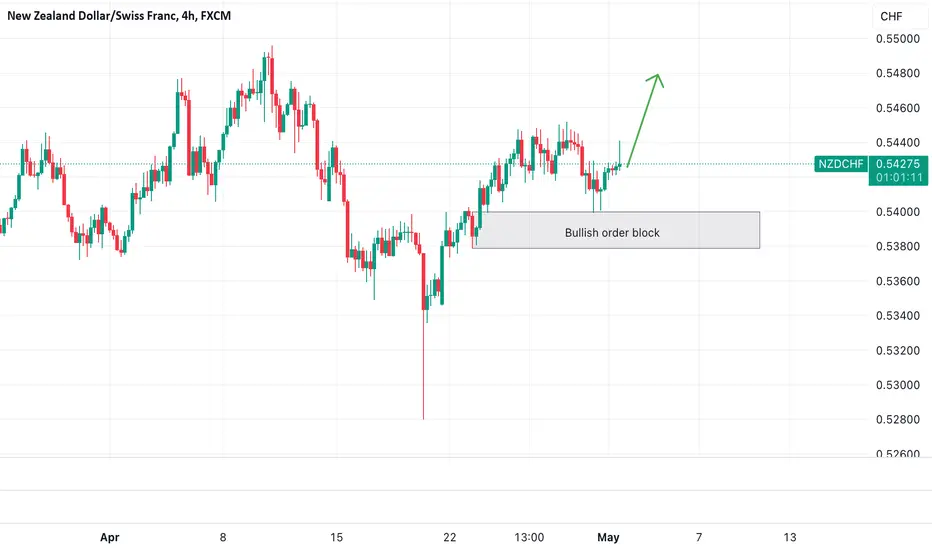
NZDCHF - Bullish continuation ✅Hello traders!
‼️ This is my perspective on NZDCHF.
Technical analysis: Here we are in a bullish market structure from 4H timeframe perspective, so I look only for long position. I expect bullish price action from here after price rejected from bullish order block + institutional big figure 0.54000.
Like, comment and subscribe to be in touch with my content!
Triple bottom and boom!Bullish flag forming apparently to break out the resistance at 0.55. SL triggers if the bullish flag is broken down by a full weekly red candle. We may have pull back at the resistance level. I'd buy more in that case. AUD/CHF also looks good.
Good luck.
NZDCHF SHORTDAILY
- Big head and shoulders
- Small head and shoulders
- SD zone
WEEKLY
- Highs
- Rejected from iHS region (!)
- Bullish candle close (!)
4 HOUR
- Inverse head and shoulders
- SD zone
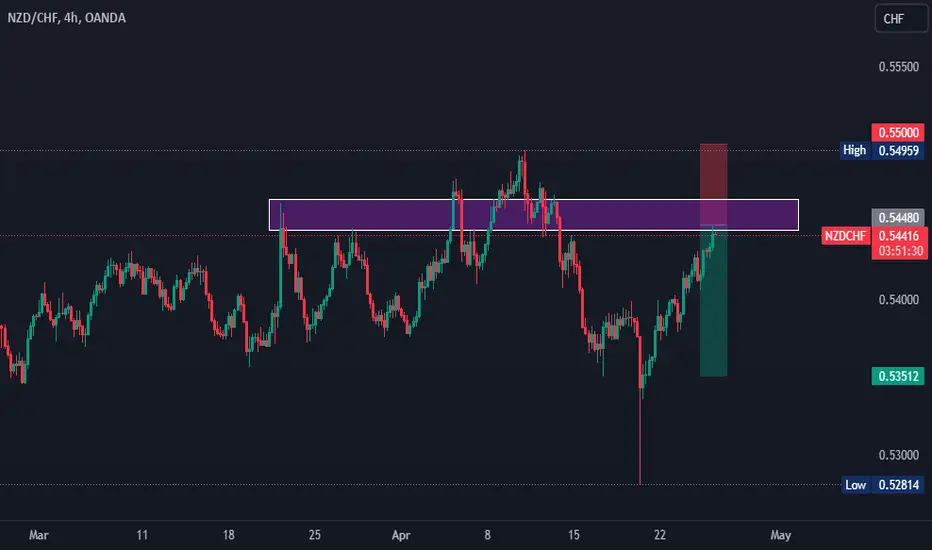
NZDCHF bearishThis pair is testing strong resistence and also flag pattern you can see alot of rejections in the resistance

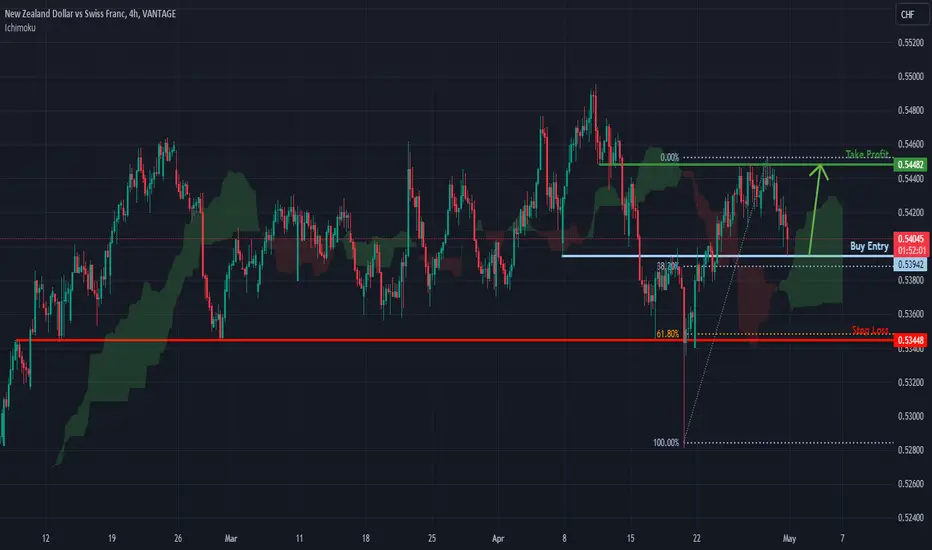
Falling towards 38.2% Fibonacci retracement support?NZD/CHF is falling towards the support level which is an overlap support that aligns with the 38.2% Fibonacci retracement and could potentially bounce from this level to our take profit.
Entry: 0.53942
Why we like it:
There is an overlap support level which aligns with the 38.2% Fibonacci retracement.
Stop loss: 0.53448
Why we like it:
There is a pullback support level which aligns with the 61.8% Fibonacci retracement.
Take profit: 0.54482
Why we like it:
There is a pullback resistance level
Please be advised that the information presented on TradingView is provided to Vantage (‘Vantage Global Limited’, ‘we’) by a third-party provider (‘Everest Fortune Group’). Please be reminded that you are solely responsible for the trading decisions on your account. There is a very high degree of risk involved in trading. Any information and/or content is intended entirely for research, educational and informational purposes only and does not constitute investment or consultation advice or investment strategy. The information is not tailored to the investment needs of any specific person and therefore does not involve a consideration of any of the investment objectives, financial situation or needs of any viewer that may receive it. Kindly also note that past performance is not a reliable indicator of future results. Actual results may differ materially from those anticipated in forward-looking or past performance statements. We assume no liability as to the accuracy or completeness of any of the information and/or content provided herein and the Company cannot be held responsible for any omission, mistake nor for any loss or damage including without limitation to any loss of profit which may arise from reliance on any information supplied by Everest Fortune Group.
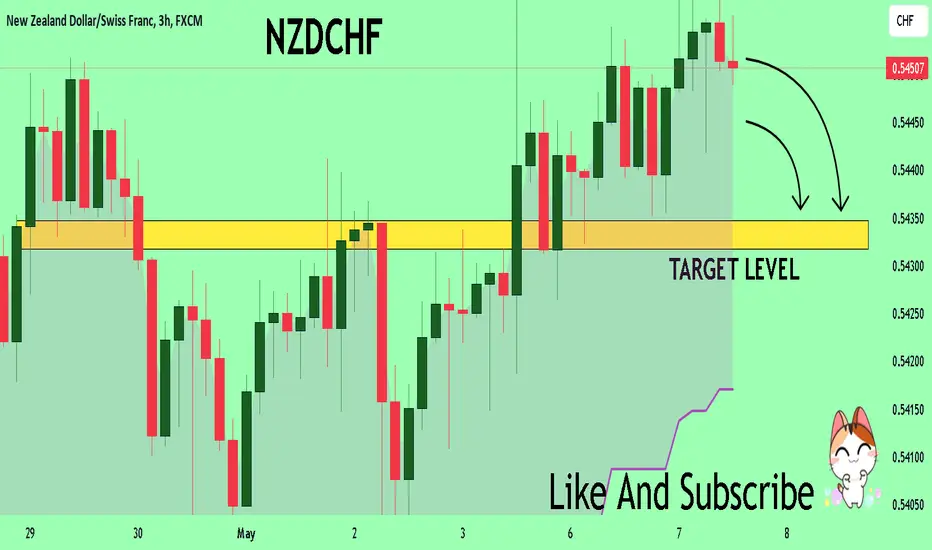
NZDCHF BREAKOUT ON HOURLY CONSOLIDATIONThe price confirmed a breakout and pullback on the support created with the consolidation zone, where we may witness a possible downside momentum in near future. Here I am expecting a bearish trend to be built towards the bottom level of support identified.

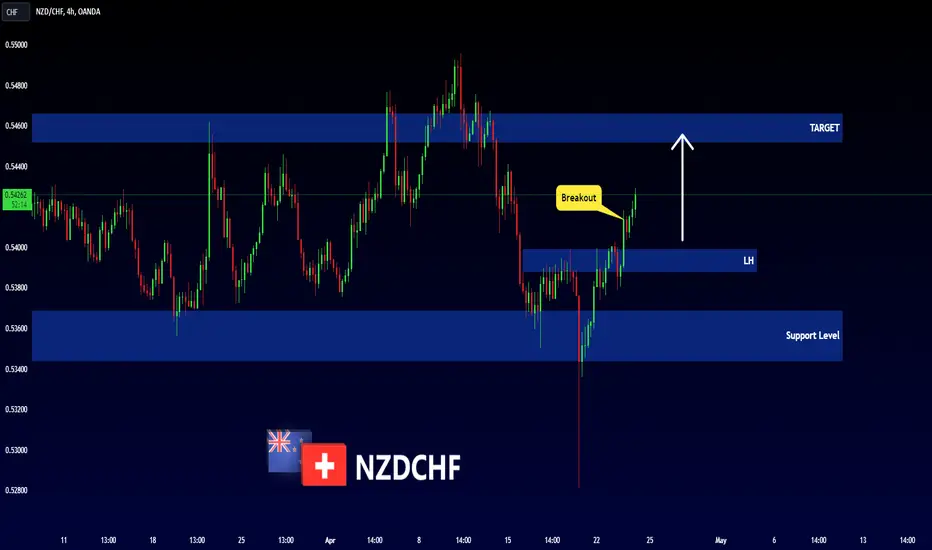
NZDCHF - Change of Character 📈Hi Traders !
On Tuesday 16 April, The NZDCHF Reached The Support Level (0.53688 - 0.53442).
The Price Broke The Last Lower High (Choch).
So, I Predict a Bullish Move 📈.
-------------
TARGET: 0.54520🎯
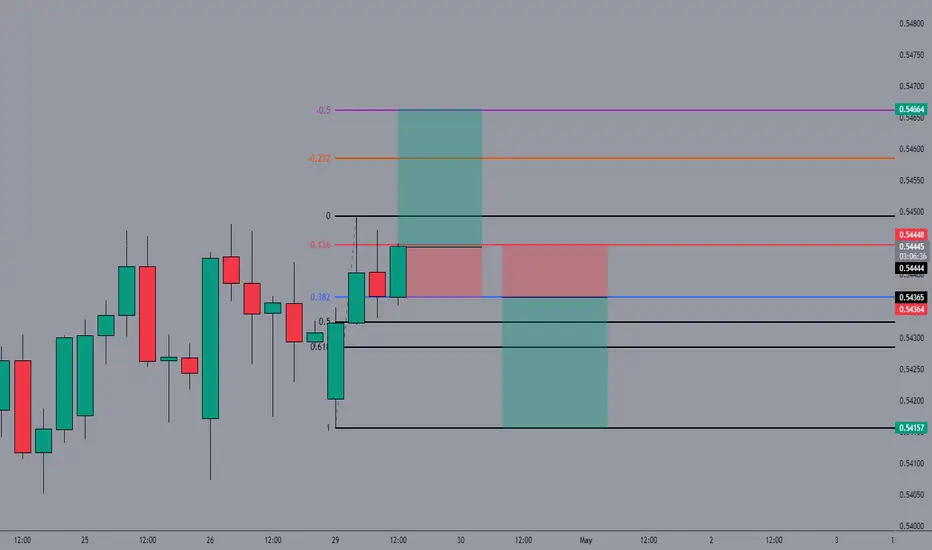
NZDCHF - Fibo Retracement Trade (HEDGE)We are looking for the retracement over Fib(0.318) and a continuation starting from Fib(0.136) to the upside.
Plan is to risk a total of %1, so that 3x lots and 200 points (20 pips) SL should be equal to the %1 of your account.
Direct entry.
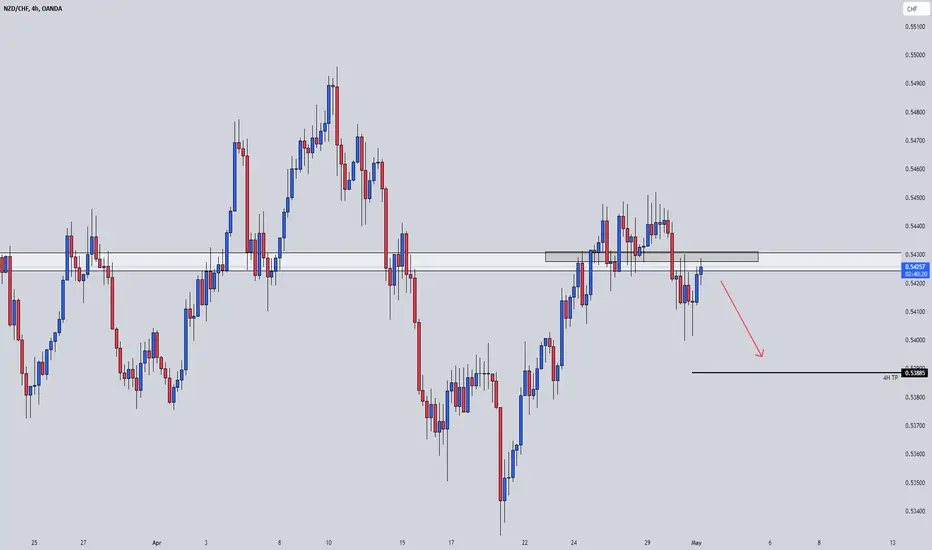
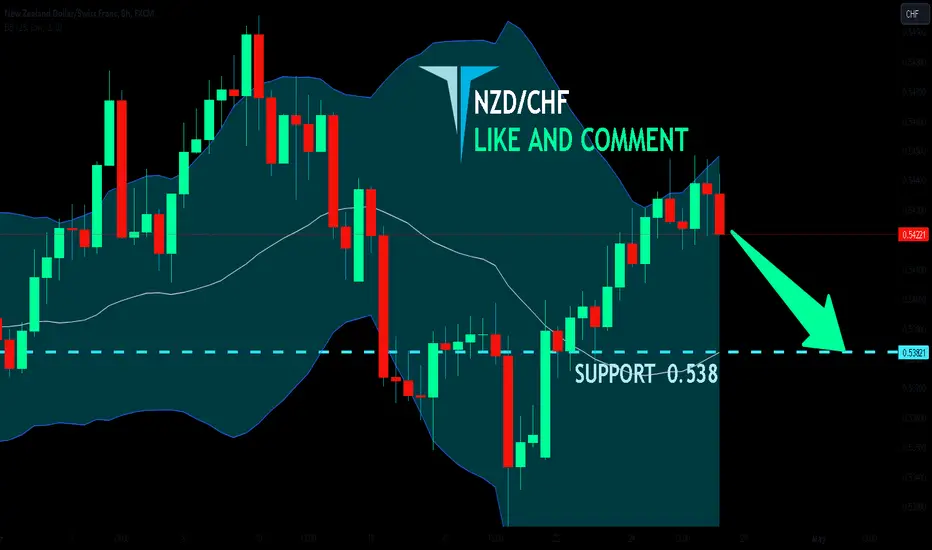
NZD/CHF SENDS CLEAR BEARISH SIGNALS|SHORT
Hello,Friends!
The BB upper band is nearby so NZD-CHF is in the overbought territory. Thus, despite the uptrend on the 1W timeframe I think that we will see a bearish reaction from the resistance line above and a move down towards the target at around 0.538.
✅LIKE AND COMMENT MY IDEAS✅
SELL NZDCHF 💲💀💲 №342 FX:NZDCHF
Trading Forex and other financial products with leverage is highly risky and can result in substantial losses. Trading in the market may not be suitable for everyone. You need to be aware of all the risks and seek the help of independent financial advisors if you have any questions or doubt
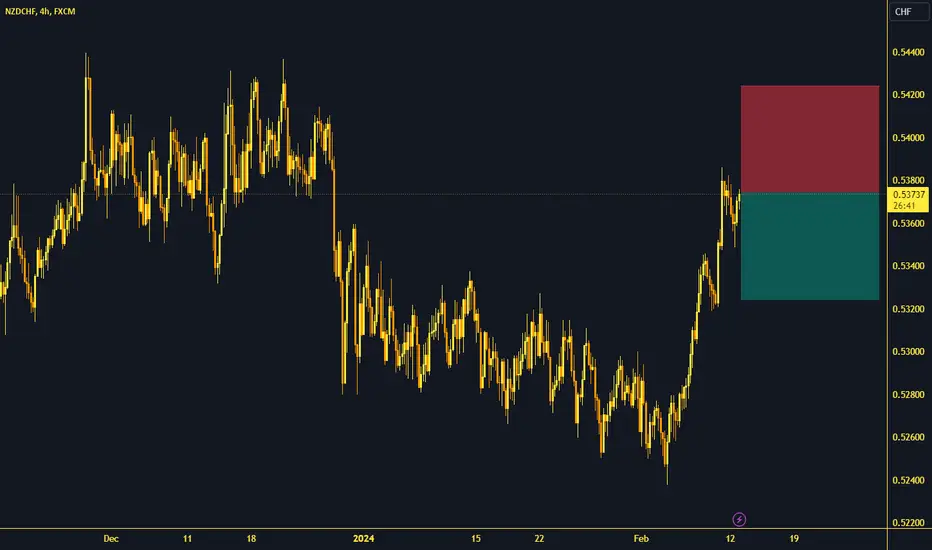
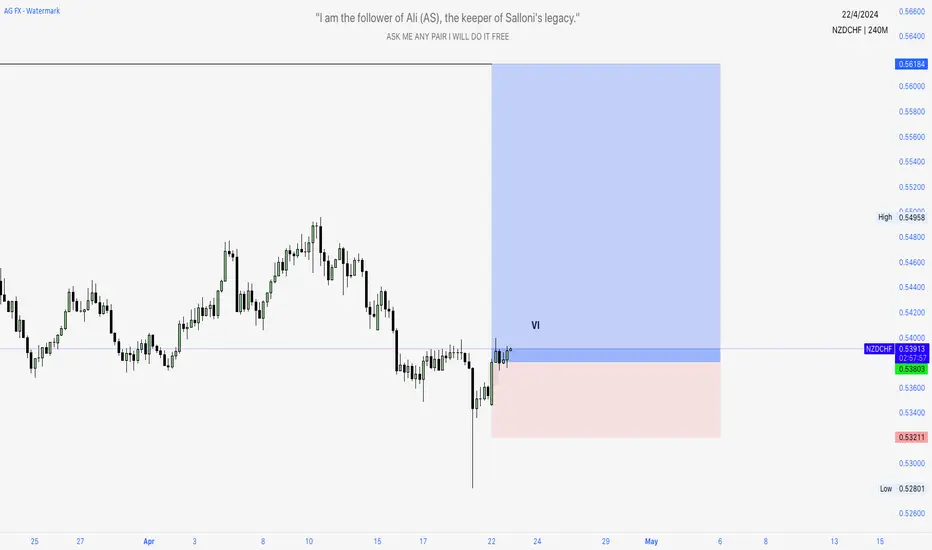
NZDCHF in the first half of 2024A glimpse of the NZDCHF in the first half of 2024
Stay with me to get more analysis after following me by sharing with friends and leaving a comment.
According to my risk and capital management system, the risk of each trade is one percent per position.
What do you think about this analysis and other analyses?
What symbol would you like me to analyze for you?

NZDCHF- Trending Reversal NZDCHF... Bullish move exhausted. Correction move possible.. Bearish divergence on rsi
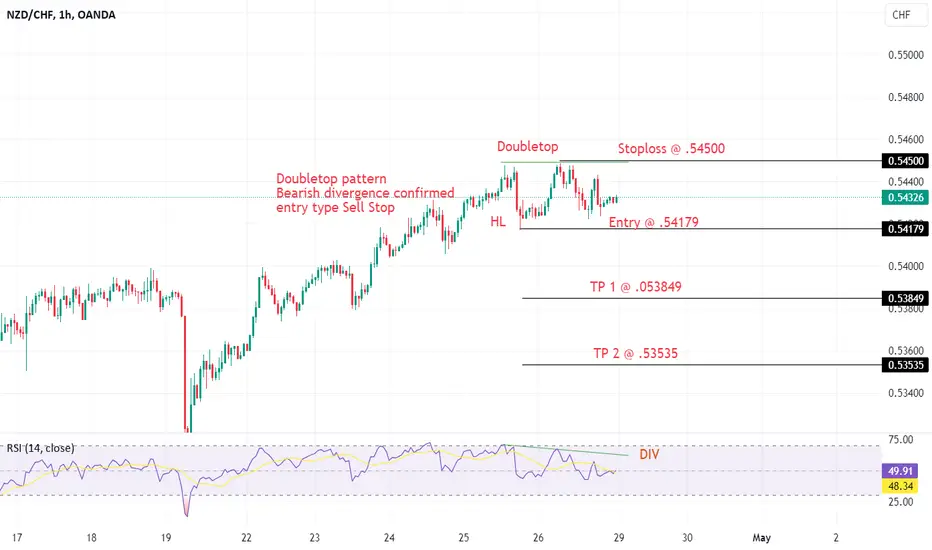
NZDCHF: Bearish Continuation is Highly Probable! Here is Why:
The price of NZDCHF will most likely collapse soon enough, due to the supply beginning to exceed demand which we can see by looking at the chart of the pair.
❤️ Please, support our work with like & comment! ❤️

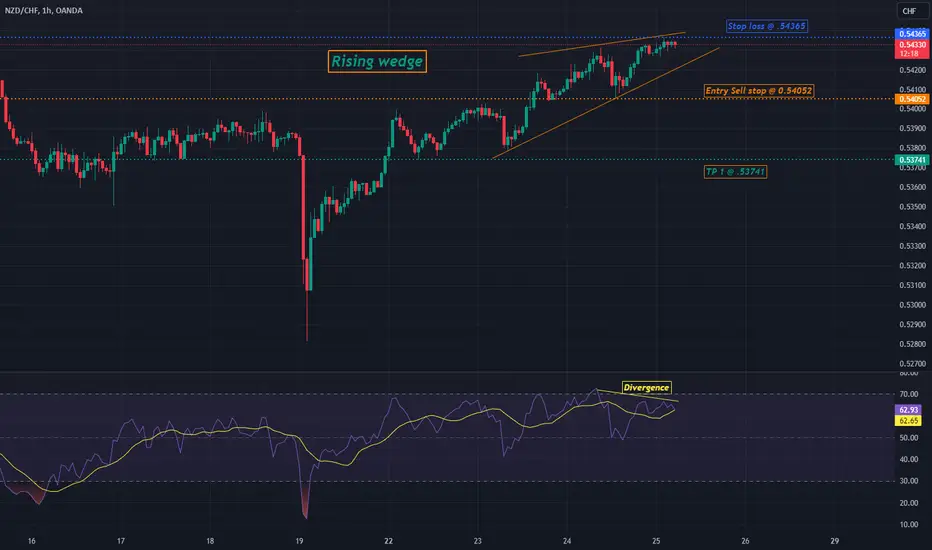
NZDCHF - Rising Wedge 1 Hr Time FrameIn 1 hour time frame NZDCHF is making rising wedge and in RSI divergence is formed.
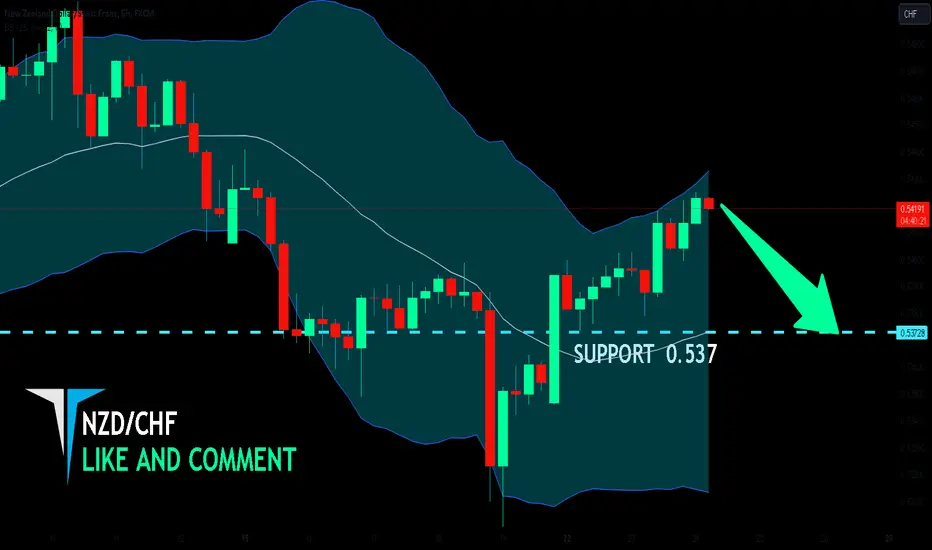
NZD/CHF BEARS WILL DOMINATE THE MARKET|SHORT
Hello,Friends!
Bearish trend on NZD/CHF, defined by the red colour of the last week candle combined with the fact the pair is overbought based on the BB upper band proximity, makes me expect a bearish rebound from the resistance line above and a retest of the local target below at 0.537.
✅LIKE AND COMMENT MY IDEAS✅