NZDJPY Technical Analysis and Trade Idea into the London OpenIn our video, we analyzed NZDJPY using technical methods. Currently, we’re closely observing price movements as discussed in the video. Our main goal is to identify an optimal buying opportunity within a critical support zone. This decision will depend on how well the price action aligns with our analysis from the video.
As always, our video offers valuable insights on trade entry points, trend analysis, market structure, and price behavior. Remember that this content is purely educational and should not be considered financial advice. 📈🚀📊
NZDJPY trade ideas

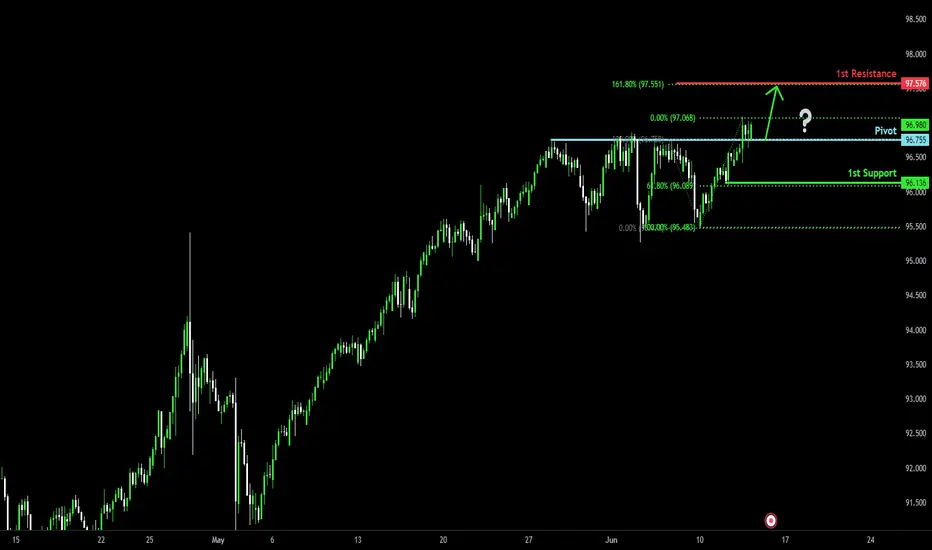
Potential bullish rise?NZD/JPY has just broken out of the pivot and could rise to the 1st resistance which aligns with the 161.8% Fibonacci extension.
Pivot: 96.75
1st Support: 96.13
1st Resistance: 97.57
Risk Warning:
Trading Forex and CFDs carries a high level of risk to your capital and you should only trade with money you can afford to lose. Trading Forex and CFDs may not be suitable for all investors, so please ensure that you fully understand the risks involved and seek independent advice if necessary.
Disclaimer:
The above opinions given constitute general market commentary, and do not constitute the opinion or advice of IC Markets or any form of personal or investment advice.
Any opinions, news, research, analyses, prices, other information, or links to third-party sites contained on this website are provided on an "as-is" basis, are intended only to be informative, is not an advice nor a recommendation, nor research, or a record of our trading prices, or an offer of, or solicitation for a transaction in any financial instrument and thus should not be treated as such. The information provided does not involve any specific investment objectives, financial situation and needs of any specific person who may receive it. Please be aware, that past performance is not a reliable indicator of future performance and/or results. Past Performance or Forward-looking scenarios based upon the reasonable beliefs of the third-party provider are not a guarantee of future performance. Actual results may differ materially from those anticipated in forward-looking or past performance statements. IC Markets makes no representation or warranty and assumes no liability as to the accuracy or completeness of the information provided, nor any loss arising from any investment based on a recommendation, forecast or any information supplied by any third-party.
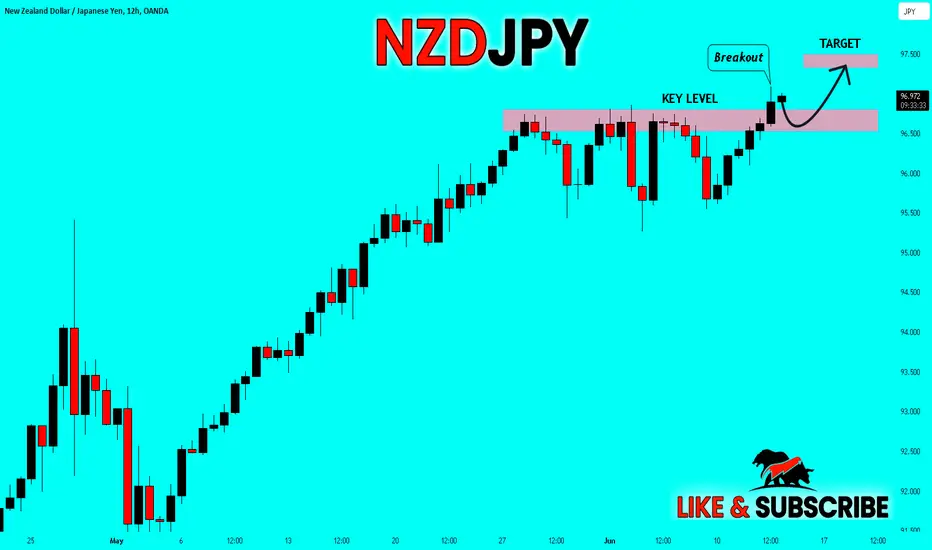
NZD_JPY WILL KEEP GROWING|LONG|
✅NZD_JPY is trading in an
Uptrend and the pair broke
The key horizontal level
Of 96.7700 so we are
Bullish biased and we
Will be expecting a
Strong bullish continuation
LONG🚀
✅Like and subscribe to never miss a new idea!✅
NzdJpy sellAs we can see NZDJPY have seen a Rally upwards now its on its Resistance level and will see a rally downward so we are sell baised
NZDJPY - 4hrs ( Buy trade target Range 180 PIP ) 🔻Pair Name : NZD/JPY
Time Frame : 4hrs Chart / Close
Scale Type : Large Scale
------
🔻 spreading knowledge among us and to clarify the most important points of entry, exit and entry with more than 5 reasons
We seek to spread understanding rather than make money
🔻Key Technical / Direction ( Long )
Type : Mid Term Swing
———————————
✔️Bullish Break
96.800 Area
reasons
- Choch Zone
- Visible Range Hvn
- Major Turn level / D
- Fibo Golden
- Fixed Range Hvn
✔️Bearish Reversal
98.500 Area
Reasons
- Major Turn level
- Visible Range Hvn / D
- Pattern Target
- Major Choch
- Fibo Golden Zone

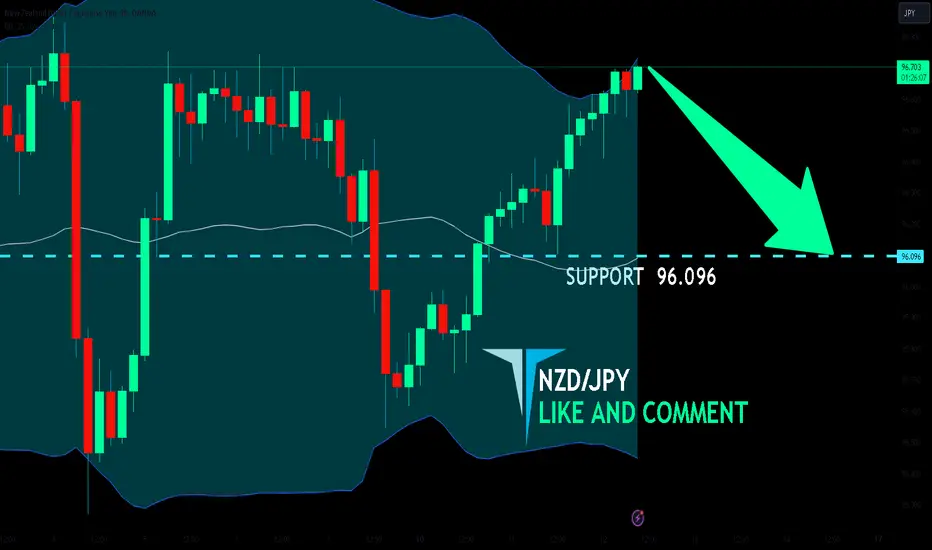
NZD/JPY BEARS ARE GAINING STRENGTH|SHORT
Hello,Friends!
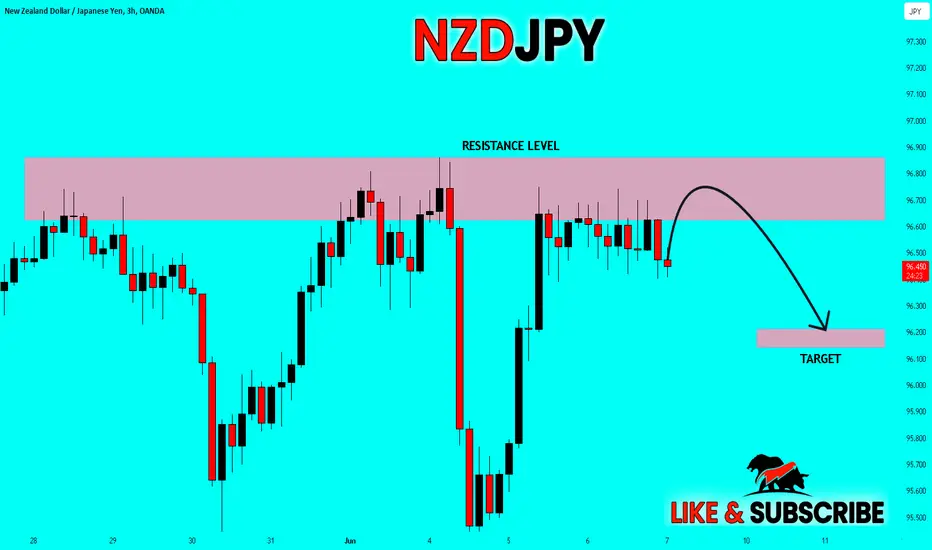
NZD/JPY is making a bullish rebound on the 3H TF and is nearing the resistance line above while we are generally bearish biased on the pair due to our previous 1W candle analysis, thus making a trend-following short a good option for us with the target being the 96.096 level.
✅LIKE AND COMMENT MY IDEAS✅
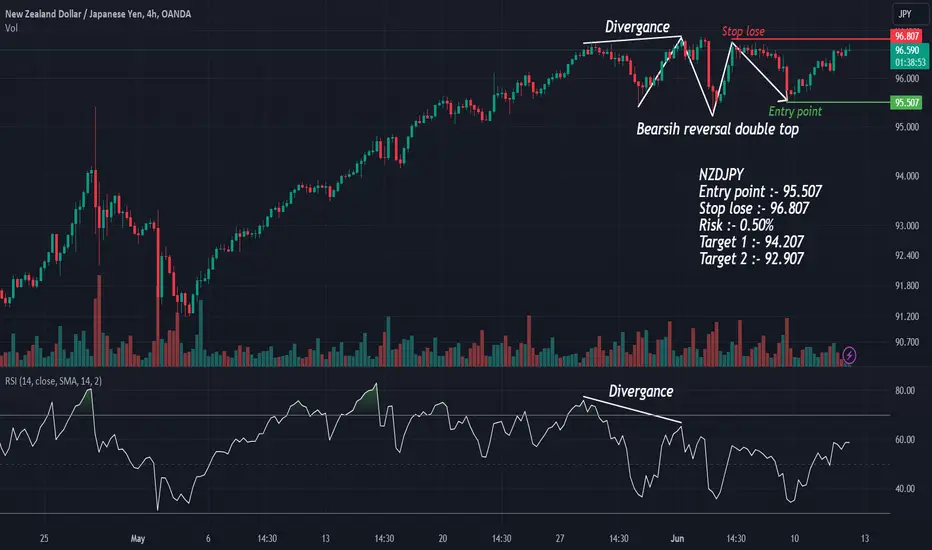
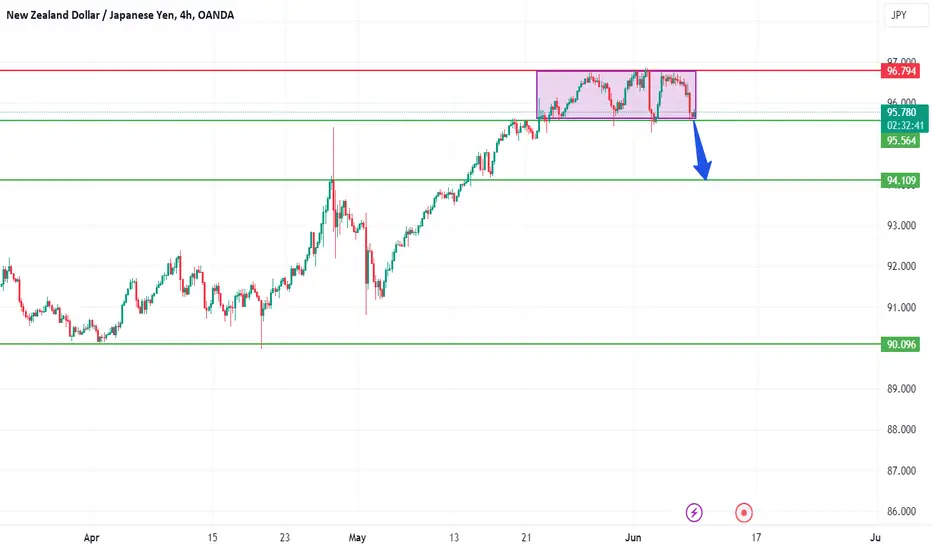
NZDJPY bearish reversalNZDJPY
Entry point :- 95.507
Stop lose :- 96.807
Risk :- 0.50%
Target 1 :- 94.207
Target 2 :- 92.907
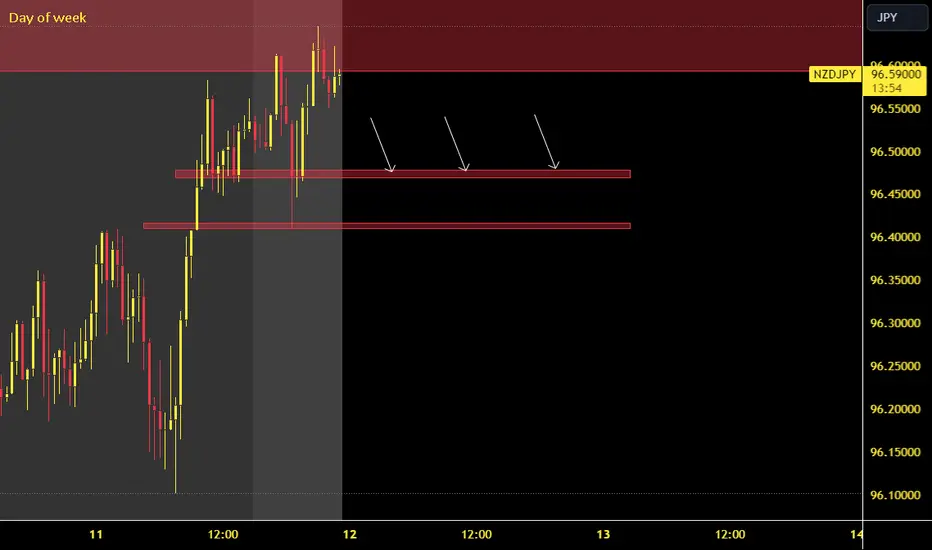
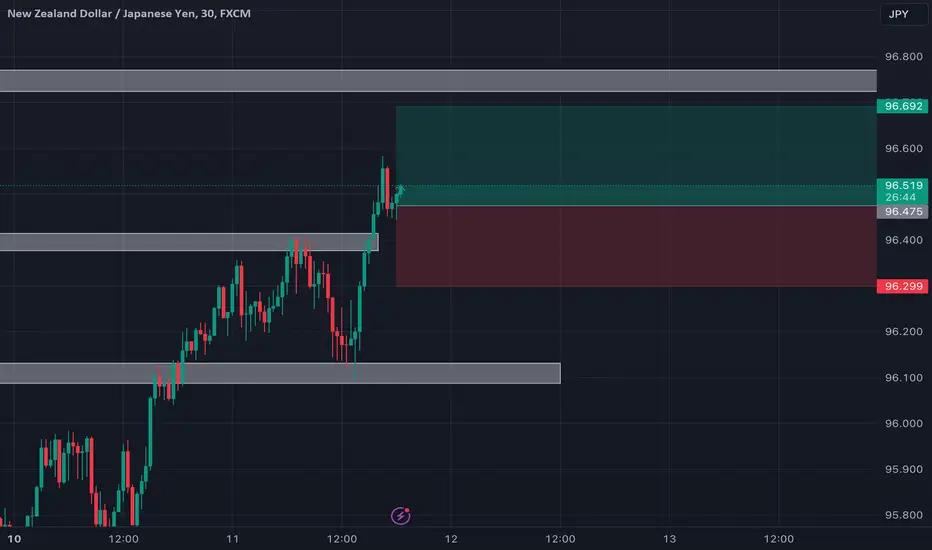
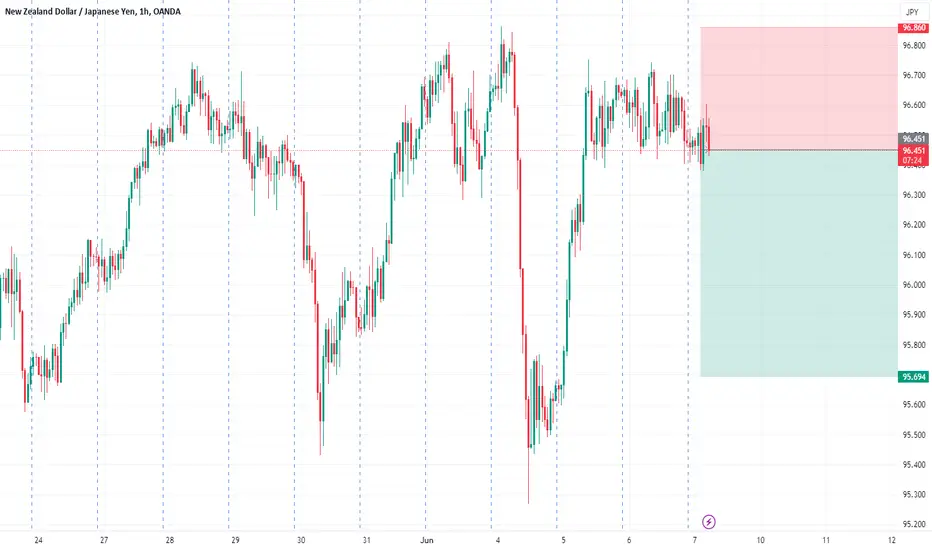
NZDJPY SellAnother great sell opportunity. Selling NZDJPY targeting 96.47306. Price is entering lots of resistance and the targeted price is at a unique level for sellers to push down to according to my strategy.
Should hit within the next 24 hours but can take longer.
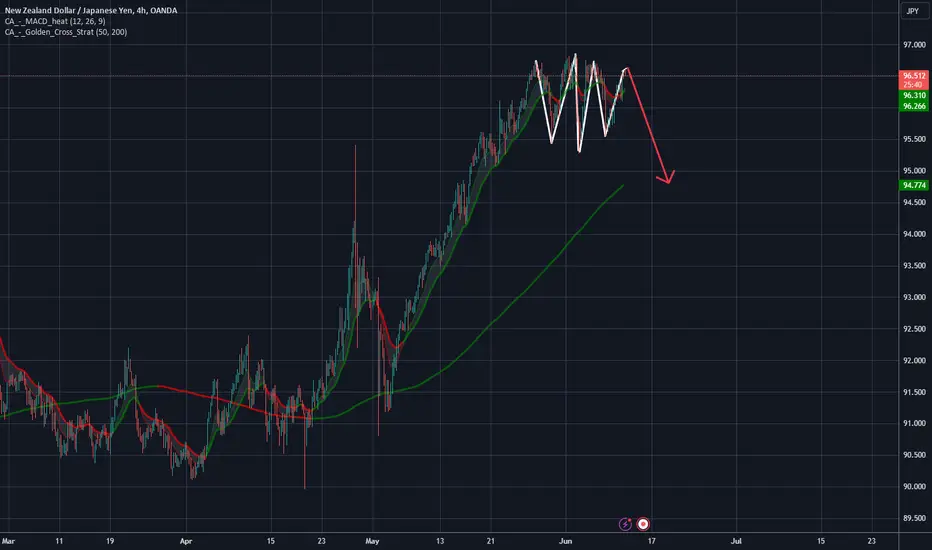
Nzd/Jpy Sell IdeaNzd/Jpy made this huge high on the daily time frame.
Im looking at the Hour 4 Chart and I see a bunch of swings all together in a range.
I believe this mess is a correction after the swing high!!
So now Im going to try to sell...
The current Resistance area on the day chart is from 96.600 to 96.800
The stop loss should be a little higher than this...
So this idea is based upon "support and resistance" ...
The Correction has been identified on the Hour 4 time frame...
So your basically waiting for a sell signal to sell...
Wait for bearish movement and enter the trade with your entry indicators.
Good Luck
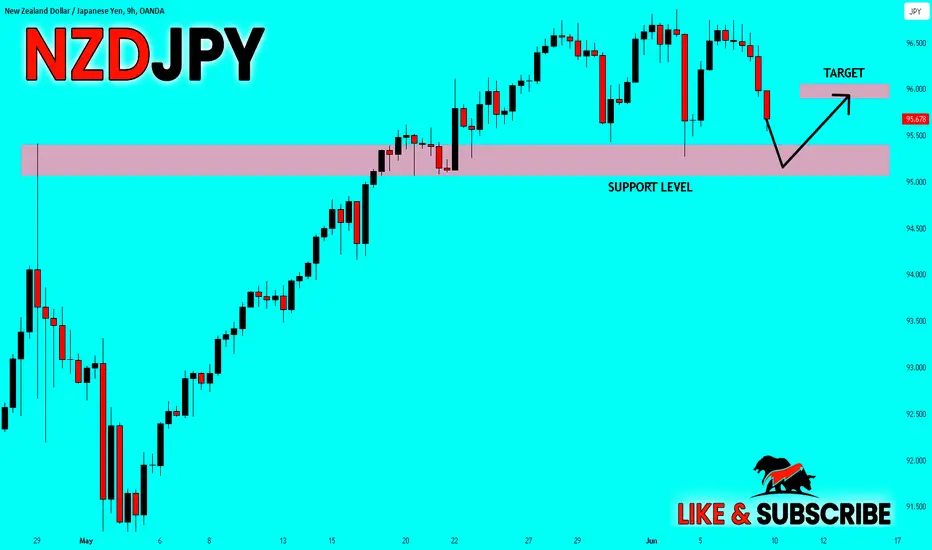
BUY NZDJPYI have identified major support and resistance zones and shown from the chart, we have managed to break a major resistance zone. Now buying to take TP on the next resistance section. If any questions please feel free to reply in the comments.
Thanks
Don
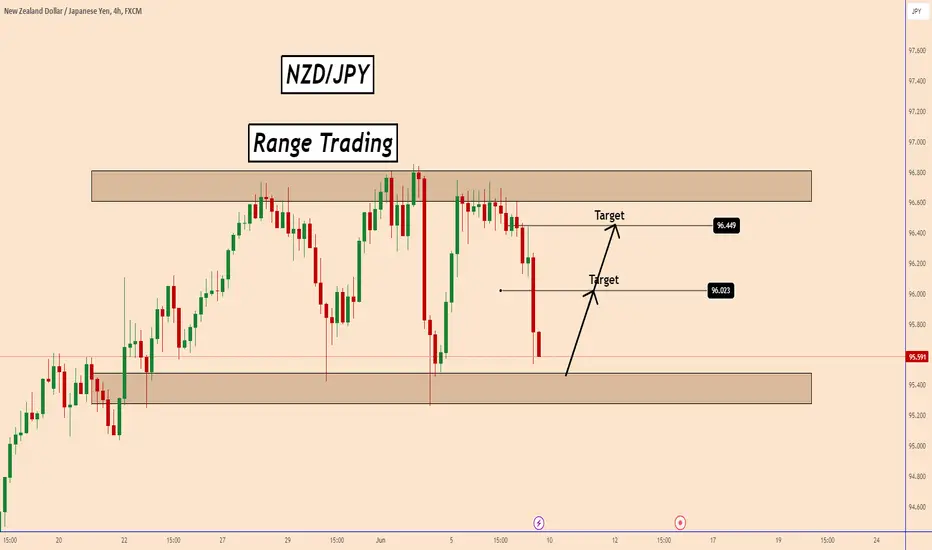
NZDJPY: Range Trading - LONG and RiskyNZDJPY: Range Trading - LONG and Risky
The price is showing the possibility for another bullish wave inside the pattern.
However, this is going to be risky this time as long as we have BOJ during the coming week and the market may speculate that BOJ may take further actions.
Considering also that the are not consistent in their comment the market can push the price up again in order to develop the pattern more and can wait for BOJ near to the top again.
You may find more details in the chart!
Thank you and Good Luck!
❤️PS: Please support with a like or comment if you find this analysis useful for your trading day❤️
NZDJPY Continuing bearish on market sentimentNZDJPY continuing its bearish trend based on market sentiment. Planning sell entry at the golden 0.618 level which can also be considered as previous support now turning resistence.

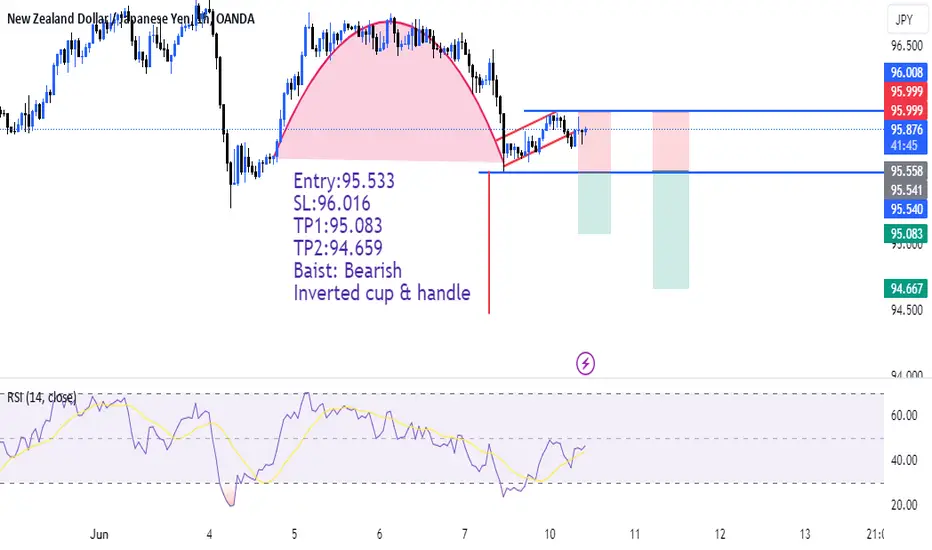
NZDJPY IS PRINTING INVERTED CUP & HANDLENZDJPY is in bearish trend it print inverted cup & handle my tread plan is mentioned in chart
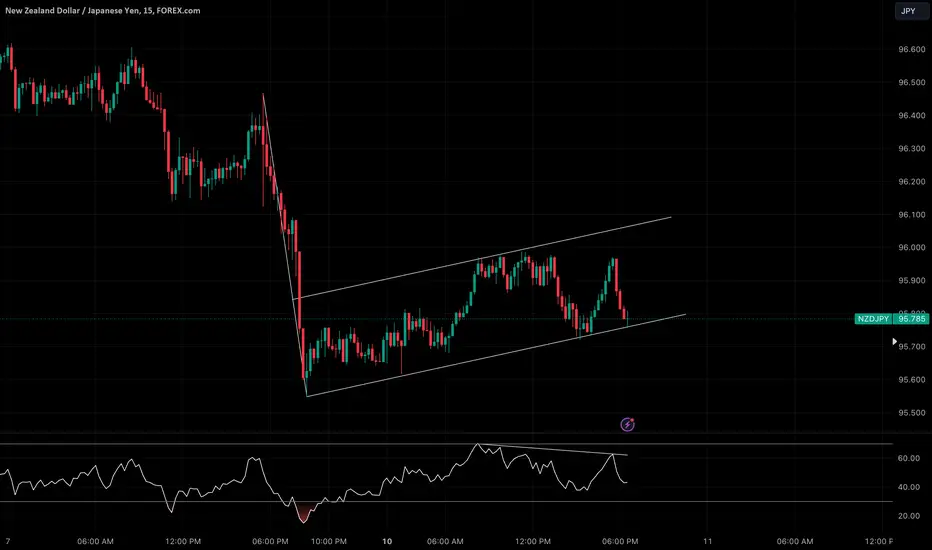
NZDJPY SELL NZDJPY has been in a downtrend and will likely to continue that trend as it is posting s a bearish flag continuation pattern. Also a 15 Min Bearish Divergence on the Rsi can be observed.
NZDJPY is Bearish - SellI will be watching patiently to see how the situation develops with NZDJPY to short the pair. The price is currently at a strong monthly resistance. The last time the price was at this level was in July 2007, and I envisage that the price cannot break above this level on the first test.
My bearish outlook is further reinforced because the weekly candle closed bearish.
My first target is 94.000.
If you are a patient trader, you could target 90.000.
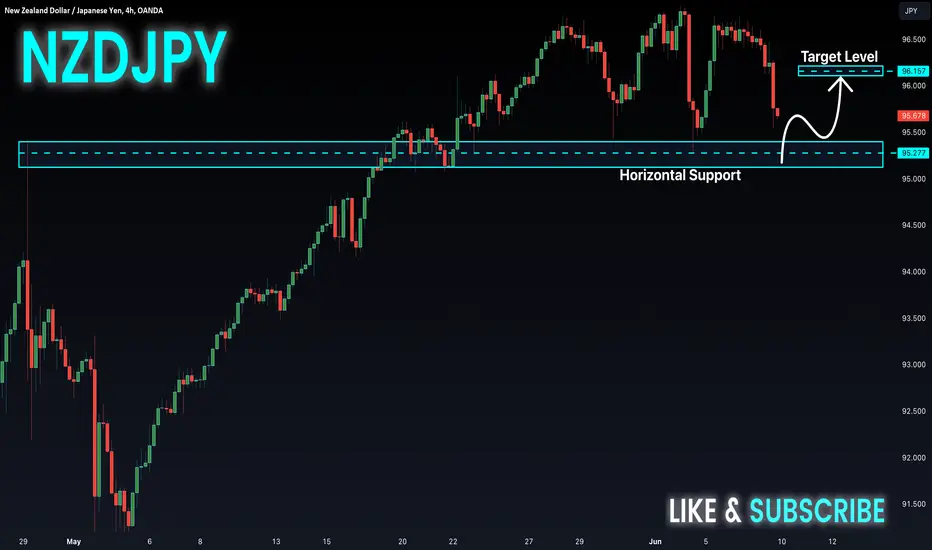
NZDJPY 4hr reviewNZDJPY on the 4hr showing strong signs of moving in the upward direction for the upcoming week as shown in the diagram. The green zone indicated possible point for taking profit.
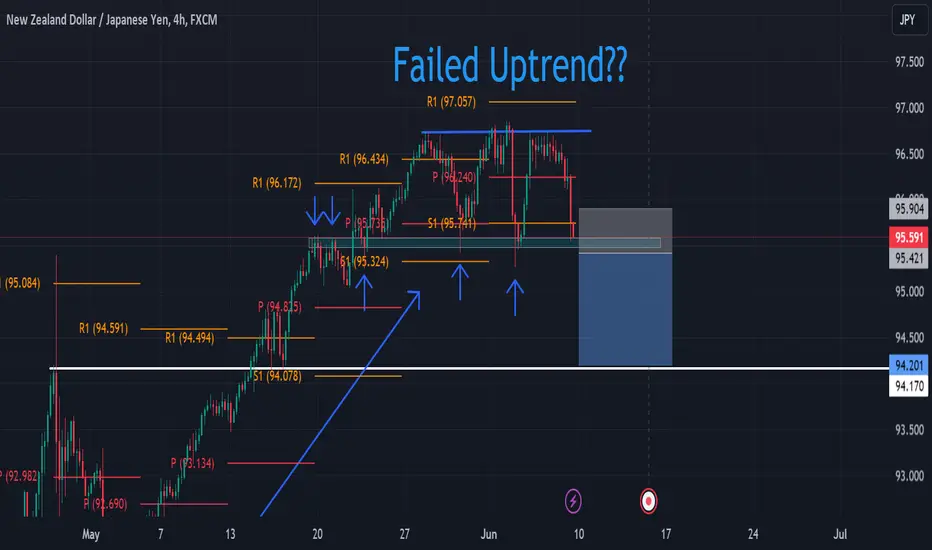
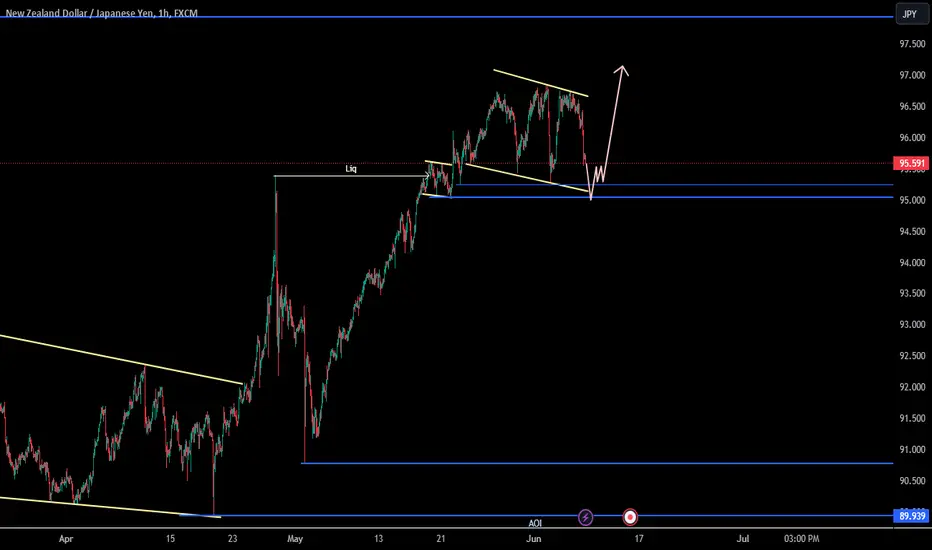
Why I'm selling NZDJPY W7Hello!! This trade is based on 4H-1H and technical analysis only.
Deep pullbacks on an uptrend
Divergence
Triple top
Accumulation and distribution
Let me break it down:
We have been in an uptrend for about a month but we are starting to see signs of reversal.
The market tried twice to break the highest high of this trend but failed ultimately creating a tipple top and a divergence.
Every time it failed to take out the highs we saw strong bearish candles.
We started seeing deeper pullbacks indicating weakness.
If price breaks this strong level it will be an indication that we might be going down.
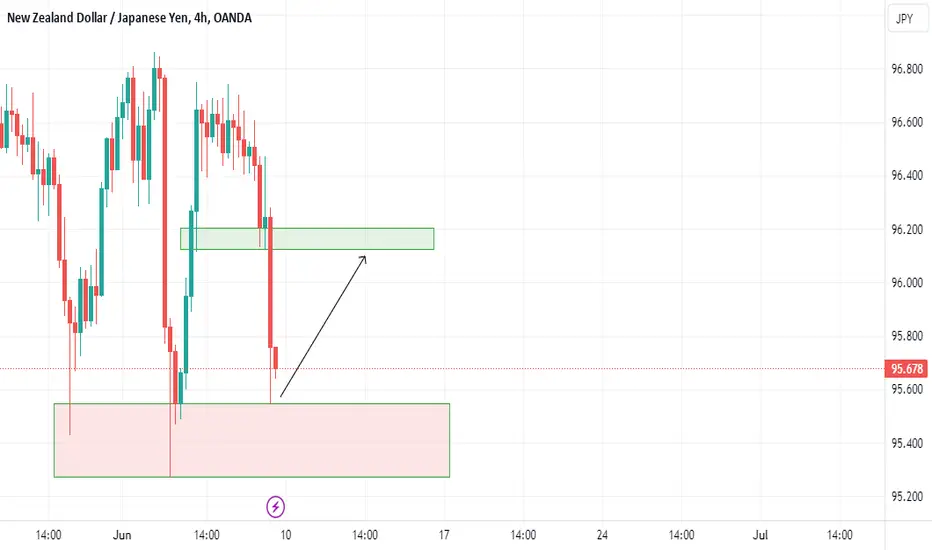
NZD_JPY SUPPORT AHEAD|LONG|
✅NZD_JPY is going down now
But a strong support level is ahead at 95.13
Thus I am expecting a rebound
And a move up towards the target at 96.00
LONG🚀
✅Like and subscribe to never miss a new idea!✅
NZDJPY Bullish ContinuationHello Everyone!
How are you all?
NZDJPY is a pair to watch this week, because it is shaping up very nicely for a bullish trend continuation that we can capitalize on.
So, I will be looking for a bullish continuation because of the following reasons:
1. The overall trend is bullish.
2. The price has formed a continuation structure and it is approaching the value area.
3. COT report shows that Nzd has 29,791 long positions and 22,586 short positions; Jpy has 40,427 long positions and 172,528 short positions.
Game Plan:
If the price comes to the VA, and rejects at that level or sweeps the Low, and makes a bullish impulse followed by a 15mins flag with two highs and lows.
Entry : will look for a risk buy entry within the flag or a reduced risk entry on the breakout of the flag.
NZD-JPY Support Ahead! Buy!
Hello,Traders!
NZD-JPY has established
A triple top pattern and
Is going down now which
Makes us somewhat
Bearish biased, however
The pair will soon be
Retesting a strong
Horizontal support level
Of 95.27$ from where
We will be expecting
A local bullish rebound
Buy!
Like, comment and subscribe to help us grow!
Check out other forecasts below too!
It is time to sell NZDJPYPrice is at a very strong resistance area and testes several times and price will keep hold that resistance . Now time to sell the NZDJPY . Risk only 1 % to 2% for the trade. good luck
NZD_JPY LOCAL SHORT|
✅NZD_JPY went up to retest a horizontal resistance level of 96.85
Which makes me locally bearish biased
And I think that a move down
From the level is to be expected
Towards the target below at 96.20
SHORT🔥
✅Like and subscribe to never miss a new idea!✅
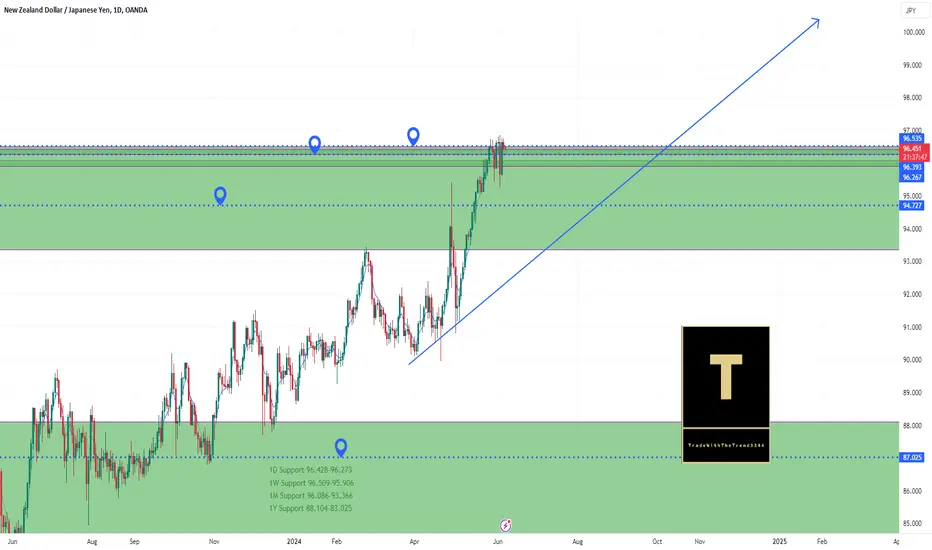
Bullish Outlook for NZD/JPY Despite Short-Term TestHello Everyone,
We are on the right track with NZD/JPY. Although there might be a short-term test of the 1M PP, the long-term projection remains bullish. We still need to observe how the supports will hold up.
TradeWithTheTrend3344