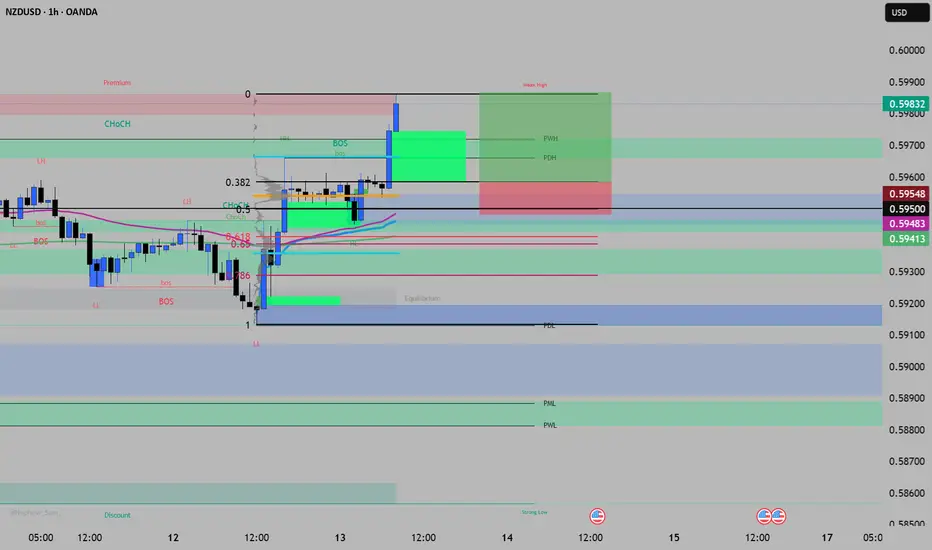
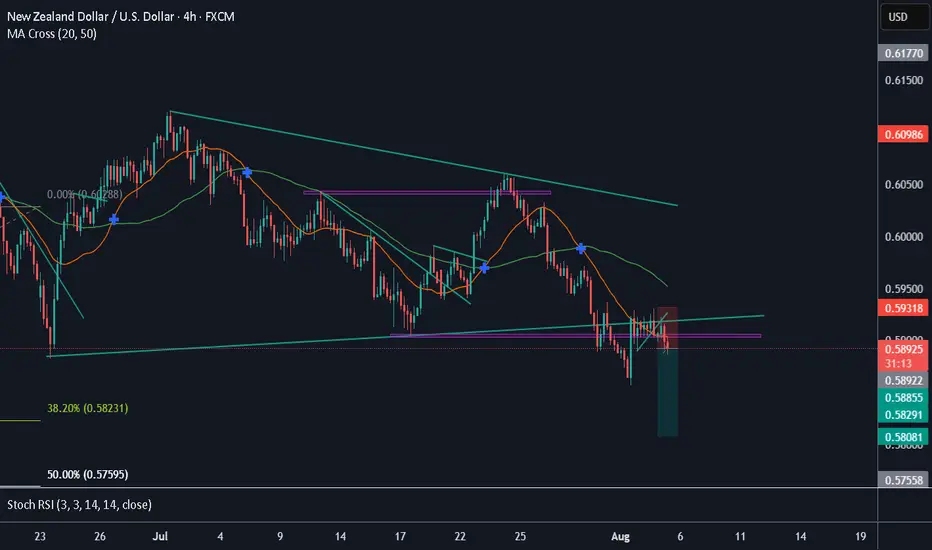
nzd/usd long setup 3.3R**NZD/USD – Long Setup**
**Bias:** Bullish (Daily + 1H aligned)
**Entry:** 0.5950 (Fib 0.5–0.618 retrace zone)
**Confluences:**
- NPOC + FVG cluster at entry
- AVWAP + EMA support alignment
- Multiple FVGs reinforcing zone strength
**Stop:** 0.5941 (below AVWAP/EMA + lower FVG)
**Target:** 0.5986–0.5987 (Fib premium zone + Weak High liquidity)
**R:R:** 3.3
**Trade Idea:** Buying retrace into stacked technical support, aiming for sweep of weak high in premium zone. Will manage if structure breaks before TP.
*Disclaimer: This analysis is part of my personal trading journey and is for educational purposes only. It is not financial advice — always do your own research before trading.*
NZDUSD trade ideas
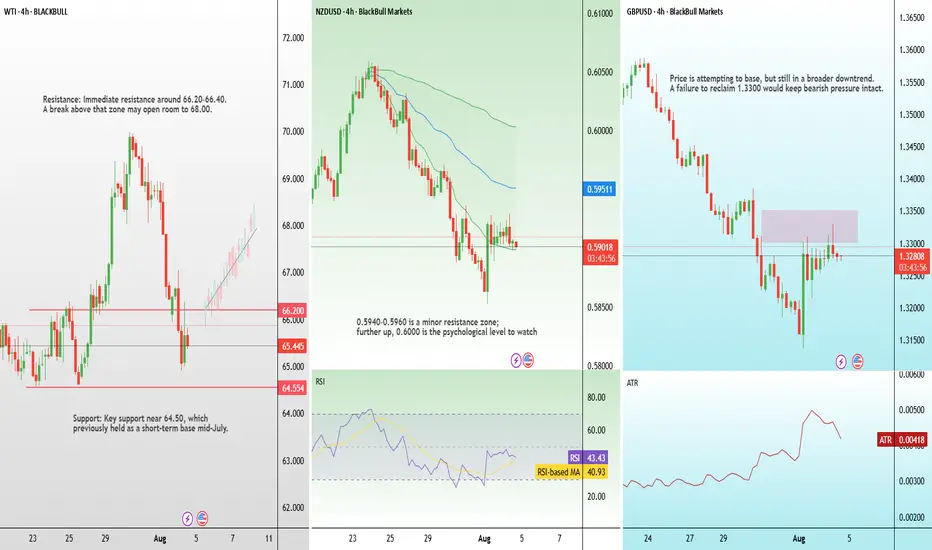
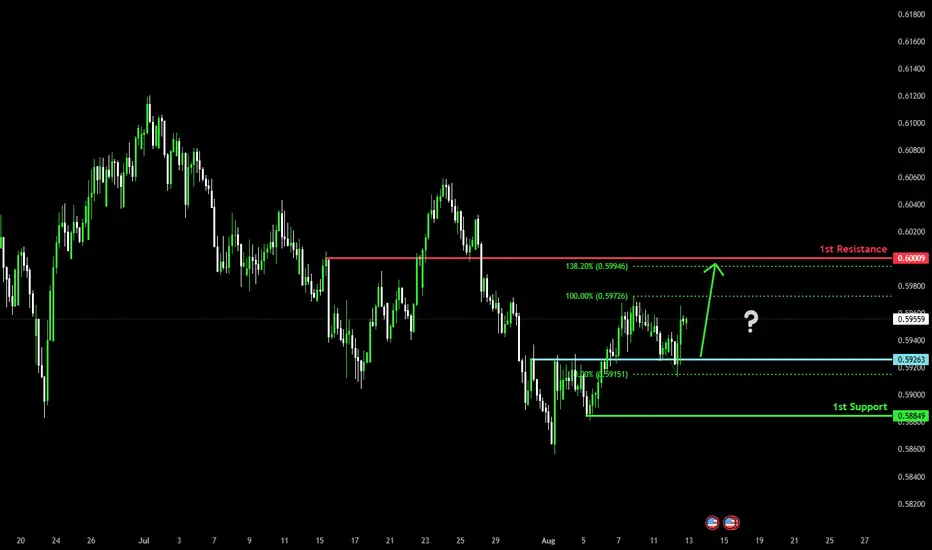
Potential bullish rise?The Kiwi (NZD/USD) has bounced off the pivot which is a pullback support and could rise to the 1st resistance.
Pivot: 0.5926
1st Support: 0.58849
1st Resistance: 0.6000
Risk Warning:
Trading Forex and CFDs carries a high level of risk to your capital and you should only trade with money you can afford to lose. Trading Forex and CFDs may not be suitable for all investors, so please ensure that you fully understand the risks involved and seek independent advice if necessary.
Disclaimer:
The above opinions given constitute general market commentary, and do not constitute the opinion or advice of IC Markets or any form of personal or investment advice.
Any opinions, news, research, analyses, prices, other information, or links to third-party sites contained on this website are provided on an "as-is" basis, are intended only to be informative, is not an advice nor a recommendation, nor research, or a record of our trading prices, or an offer of, or solicitation for a transaction in any financial instrument and thus should not be treated as such. The information provided does not involve any specific investment objectives, financial situation and needs of any specific person who may receive it. Please be aware, that past performance is not a reliable indicator of future performance and/or results. Past Performance or Forward-looking scenarios based upon the reasonable beliefs of the third-party provider are not a guarantee of future performance. Actual results may differ materially from those anticipated in forward-looking or past performance statements. IC Markets makes no representation or warranty and assumes no liability as to the accuracy or completeness of the information provided, nor any loss arising from any investment based on a recommendation, forecast or any information supplied by any third-party.
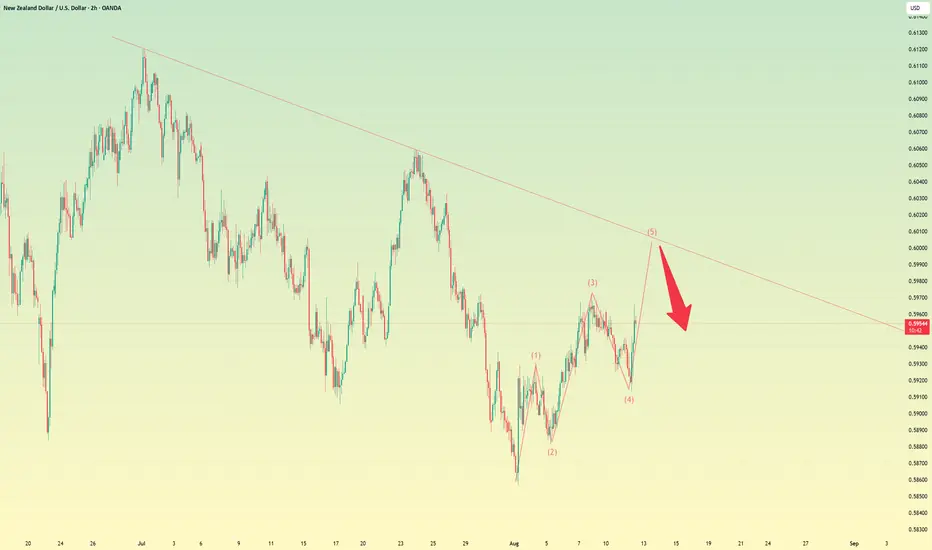
NZDUSD 5th Wave Buy impulse % wave Elliot Wave impulse to the upside. Looking to take profit at .6000
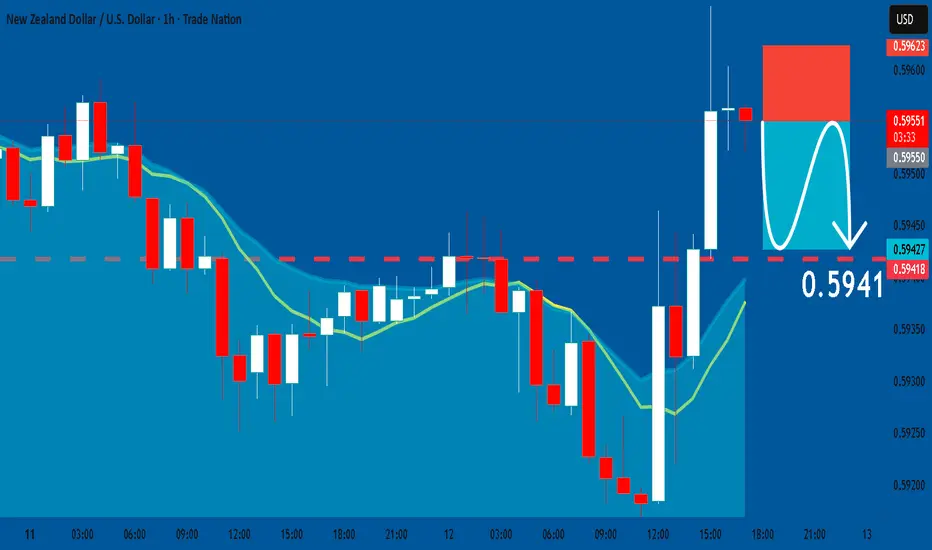
NZDUSD: Bearish Continuation & Short Trade
NZDUSD
- Classic bearish pattern
- Our team expects retracement
SUGGESTED TRADE:
Swing Trade
Sell NZDUSD
Entry - 0.5955
Stop - 0.5962
Take - 0.5941
Our Risk - 1%
Start protection of your profits from lower levels
Disclosure: I am part of Trade Nation's Influencer program and receive a monthly fee for using their TradingView charts in my analysis.
❤️ Please, support our work with like & comment! ❤️
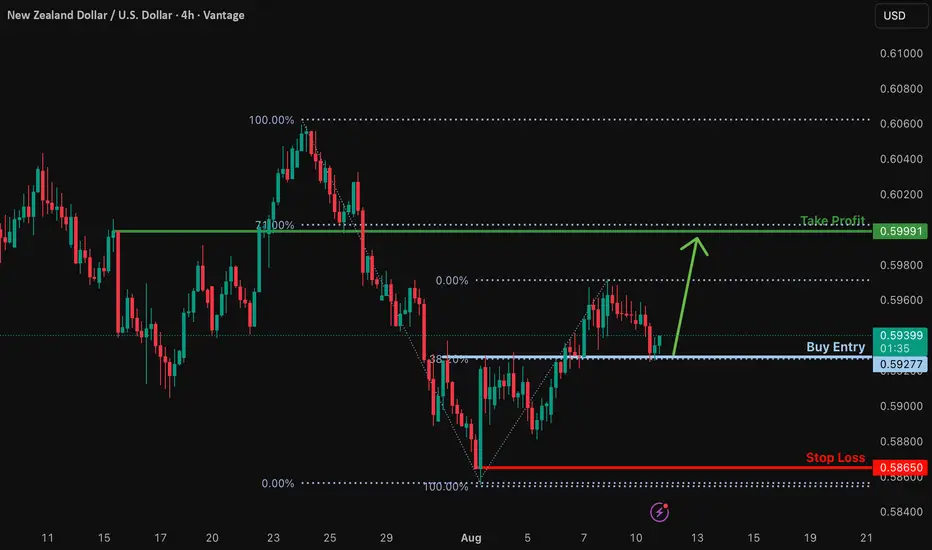
Bullish bounce off pullback support?NZD/USD is reracting off the support level which is a pullback support that lines up with the 38.2% Fibonacci retracement and could bounce from this level to our take profit.
Entry: 0.5927
Why we like it:
There is a pullback support that lines up with the 38.2% Fibonacci retracement.
Stop loss: 0.5865
Why we like it:
There is a swing low support.
Take profit: 0.5999
Why we like it:
There is a pullback resistance that lines up with the 71% Fiboncci retracement.
Enjoying your TradingView experience? Review us!
Please be advised that the information presented on TradingView is provided to Vantage (‘Vantage Global Limited’, ‘we’) by a third-party provider (‘Everest Fortune Group’). Please be reminded that you are solely responsible for the trading decisions on your account. There is a very high degree of risk involved in trading. Any information and/or content is intended entirely for research, educational and informational purposes only and does not constitute investment or consultation advice or investment strategy. The information is not tailored to the investment needs of any specific person and therefore does not involve a consideration of any of the investment objectives, financial situation or needs of any viewer that may receive it. Kindly also note that past performance is not a reliable indicator of future results. Actual results may differ materially from those anticipated in forward-looking or past performance statements. We assume no liability as to the accuracy or completeness of any of the information and/or content provided herein and the Company cannot be held responsible for any omission, mistake nor for any loss or damage including without limitation to any loss of profit which may arise from reliance on any information supplied by Everest Fortune Group.
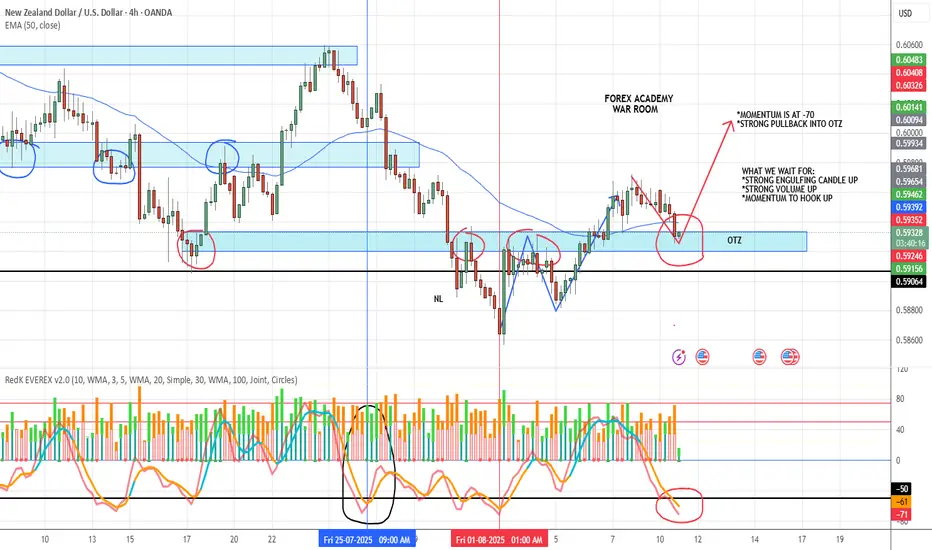
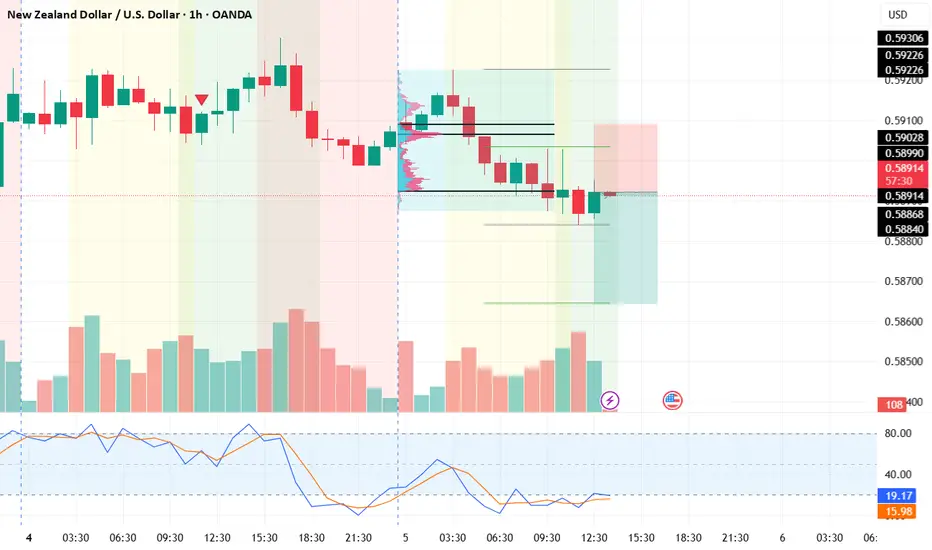
NZD/USD POSSIBLE SETUPMomentum at -70
Clean pullback into OTZ
Now waiting for:
1️⃣ Strong engulfing candle
2️⃣ Strong volume candle
3️⃣ Momentum to hook up
No alignment, no trade.
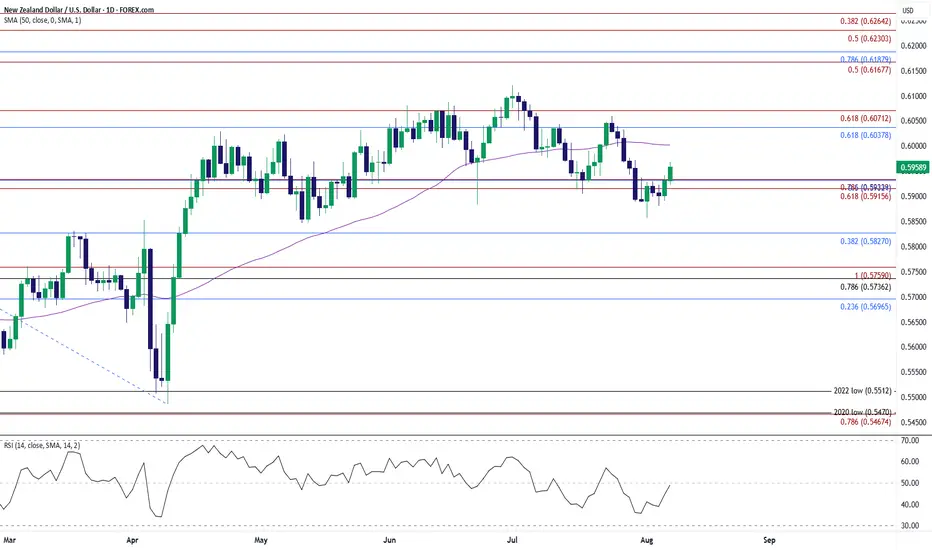
NZD/USD Climbs to Fresh Weekly HighNZD/USD extends the rebound from the start of the month to register a fresh weekly high (0.5968), and a close above the 0.5920 (61.8% Fibonacci extension) to 0.5930 (78.6% Fibonacci extension) region may push the exchange rate toward the 0.6040 (61.8% Fibonacci retracement) to 0.6070 (61.8% Fibonacci extension) zone.
A breach of the July high (0.6120) opens up the 0.6170 (50% Fibonacci extension) to 0.6190 (78.6% Fibonacci retracement) area, but lack of momentum to close above the 0.5920 (61.8% Fibonacci extension) to 0.5930 (78.6% Fibonacci extension) region may push NZD/USD back toward the monthly low (0.5857).
A breach of the May low (0.5847) brings 0.5830 (38.2% Fibonacci retracement) on the radar, with the next area of interest coming in around 0.5740 (78.6% Fibonacci retracement) to 0.5760 (100% Fibonacci extension).
--- Written by David Song, Senior Strategist at FOREX.com
ENTRY NZDUSDDisclaimer:
This is merely a chart-based analytical trading idea and is not considered investment advice. Please manage your risks carefully and conduct your own research before making any trading decisions.
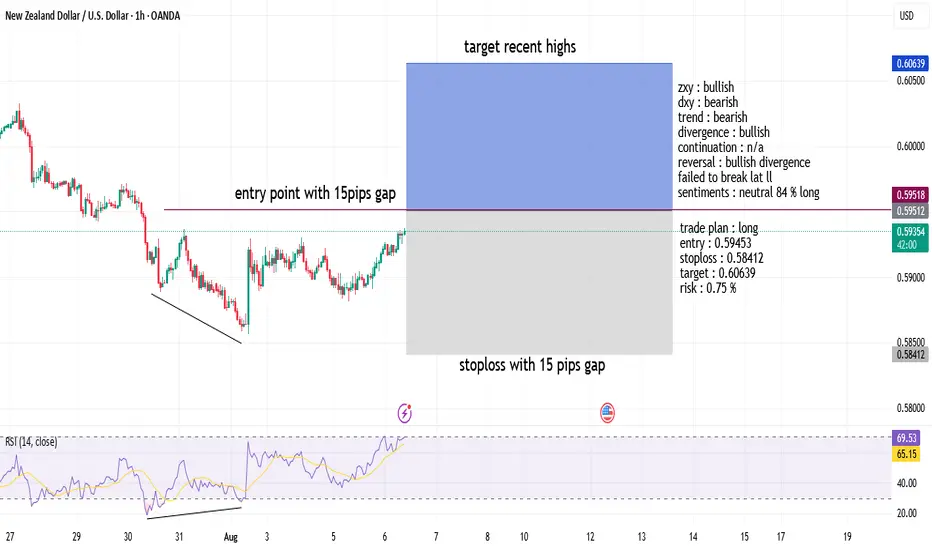
NZDUSD LONG 6-8-2025zxy : bullish
dxy : bearish
trend : bearish
divergence : bullish
continuation : n/a
reversal : bullish divergence
failed to break lat ll
sentiments : neutral 84 % long
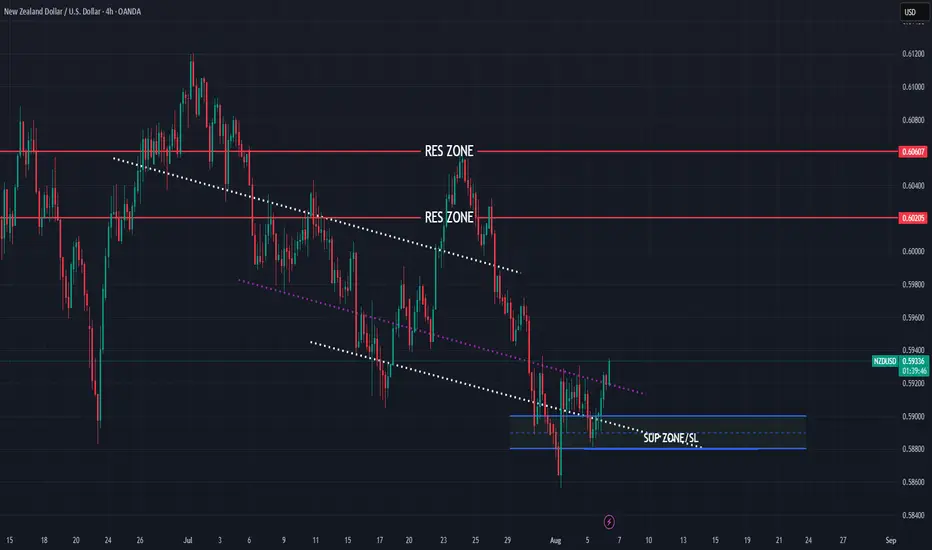
NZDUSD bullish view for this week
OANDA:NZDUSD structure based analysis, price in PA bouncing on bottom line, here bullish expectations for this week.
SUP zone: 0.59000
RES zone: 0.60200, 0.60600
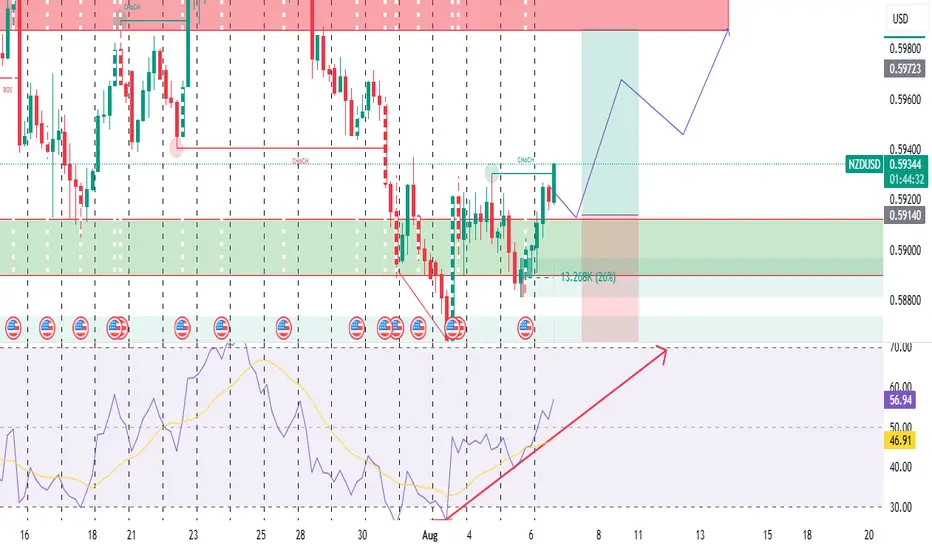
NZDUSD MOVE UP HIGHER TO 0.600looking at NZDUSD on the 4H timeframe.
Price bounced from a green demand/support zone around 0.59140.
There’s an RSI bullish divergence (price was going sideways/down, but RSI was going up)
Strong support zone at 0.59140
The green zone is a clear demand zone or support, where price previously reacted strongly.
Price came back to retest it and bounced — this is classic behavior (liquidity grab → reversal).
RSI is now above 50
Current RSI is about 55.89 and climbing.
That tells you bullish momentum is taking control.
RSI moving above 50 confirms that the pullback is likely over, and buyers are stepping in.
WHAT DO YOU THINK ABOUT THIS IDEA?
short on nzdusdprice break a trend line and pullback to trend line and have a resistance and rsi is overbought too...
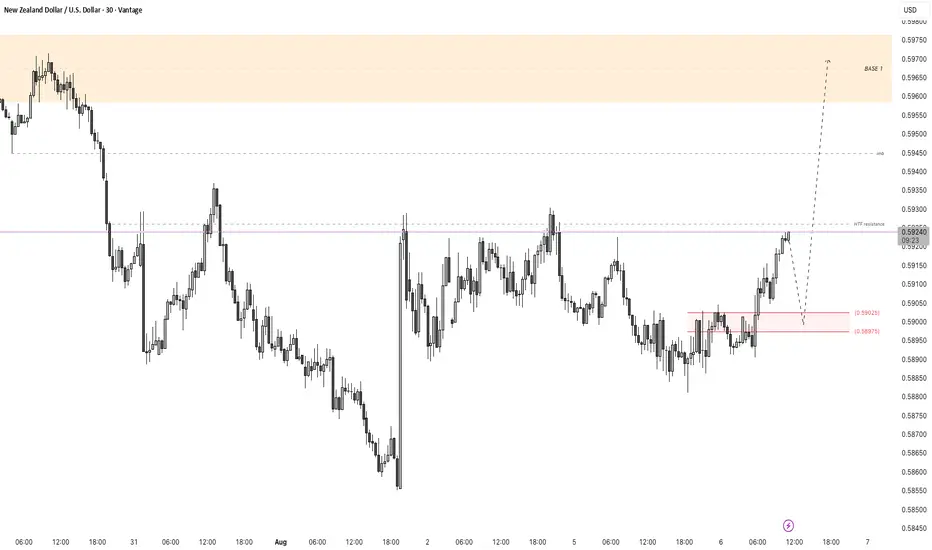
NZDUSD - M30 Bias LongThis trading plan carries a bullish bias aimed at capitalizing on a probable upward continuation after a well-defined pullback zone. The core idea is to wait for a pullback into a high-probability entry area derived from the Golden Ratio level of the Fibonacci retracement. This Fibonacci zone acts as a natural retracement level where institutional buyers may seek to accumulate positions.
Within this Fibonacci pullback zone lies a Fair Value Gap (FVG) — a price imbalance indicating an area that price tends to revisit and fill during corrections. This FVG acts as an additional confluence factor, strengthening the demand and support within this zone.
The overall expectation is that after this pullback and order flow confirmation, price will resume the upward trajectory toward the Base 1 supply zone at the higher price level marked on the chart. This Base 1 zone represents a strong resistance zone or target where traders can plan their exit or partial profit-taking.
From a fundamental perspective, the trade is supported by a weakening USD, which generally favors NZD/USD strength. This fundamental factor complements the technical Smart Money Concepts setup, increasing the confidence in a bullish continuation.
Key Points:
Bias: Long, targeting upward momentum continuation after pullback.
Entry Zone: Pullback zone at Golden Ratio Fibonacci level with FVG inside
Confluence: FVG provides demand zone strength and better entry quality.
Target: Move to Base 1 supply/resistance zone.
Fundamental Support: Weak USD supports NZD strength.
Trading Concept: Smart Money Concepts focusing on institutional order blocks, Fibonacci retracement, and liquidity gaps.
Pullback tradeThe price has broken out of a triangle pattern followed by a pullback and now the price has been rejected and now the bears look to be back in control
WE ONLY TRADE PULLBACKS
NZDUSD Short ProjectHi guys...😎
It's time to do a Short Project on NZDUSD with 3 key reasons:
1. Price Drivers: institutional shorting
2. Trend: down
3. Momentum: bearish
Action: waiting for entry on the intraday timeframe (entry will be published further)
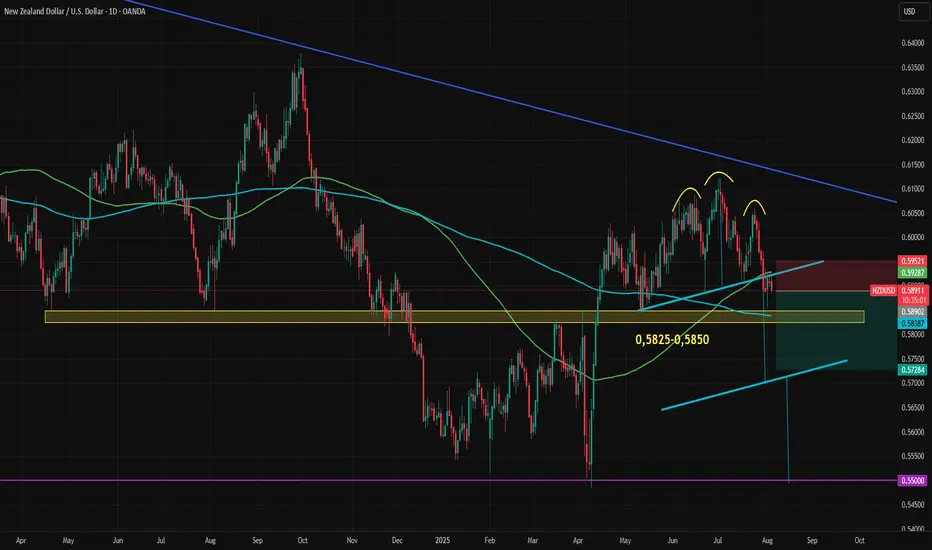
NZDUSD Stuck with Conflicting SignalsNZDUSD is at a key technical junction. The previously broken and retested head and shoulders formation is exerting downward pressure, but the important support zone between 0.5825 and 0.5850 is holding for now. The 100-day and 200-day moving averages have also formed a tight support-resistance range, causing the currency to remain trapped in a narrow range.
Both the Federal Reserve and the Reserve Bank of New Zealand are expected to cut rates twice this year. Growth expectations for 2025 are closely aligned, with only a 0.3-point advantage for the U.S., and the gap is narrowing. Inflation expectations are also similar, with U.S. figures slightly higher, mirroring the GDP trend.
The 2-year bond yield spread between the U.S. and New Zealand has remained flat since April. During that time, NZDUSD climbed from 0.55 to 0.61 before pulling back to the current level near 0.5890.
Similar fundamental statistics and conflicting technical signals have caused NZDUSD to form an uncertain range between 0.5930 on the upside and the 0.5825–0.5850 support zone on the downside. If either of these key levels breaks, volatility may return quickly.
A break above 0.5930, which coincides with both the broken neckline and the 100-day moving average, could push the price toward the descending trendline from the 2021 top (highlighted in blue on the chart). On the other hand, a break below the 0.5825–0.5850 zone which also includes the 200-day moving average, could trigger a move toward the head and shoulders pattern target, currently near 0.57.
The first two weeks of August will be crucial for the dollar index, following the sharp downward revision in payrolls data. Market reaction, revisions to expectations, commentary from Federal Reserve members, and the release of July inflation data will provide greater clarity. This wave of information could finally break NZDUSD out of its current indecisive range.
NZD/USD Analysis Based on Volume, Fibonacci & Stochastic
This NZD/USD setup is developed using:
Volume analysis to highlight market participation zones
Fibonacci levels to confirm technical structure
Stochastic indicator to find precise entry timing
🔹 Entry: 0.5892
🔹 Take-Profit: 0.5864
🔹 Stop-Loss: 0.5909
🔹 Risk-to-Reward Ratio: 1.64
⚠️ Disclaimer: This analysis is for educational purposes only and is not financial advice. Always trade with proper risk management.
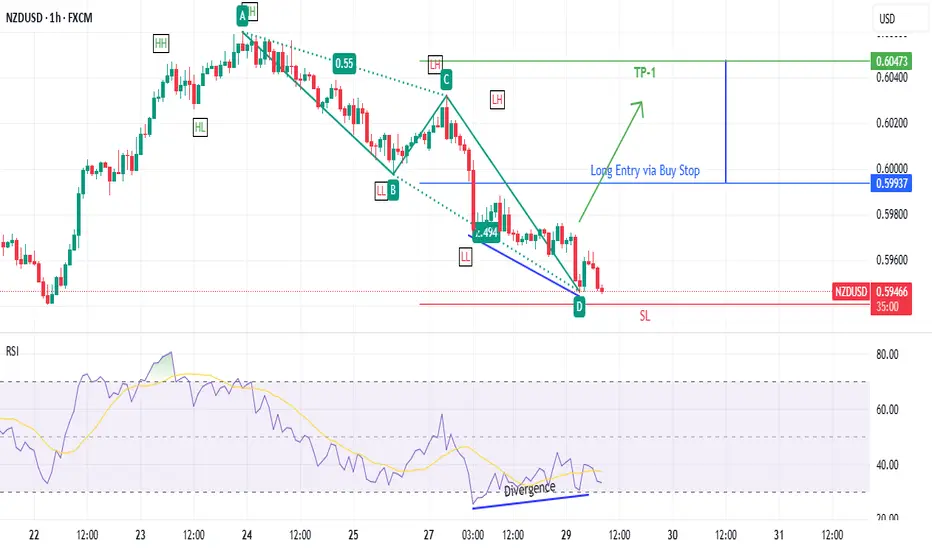
NZDUSD long trade dated 29 July 2025- Breakout of last LH will suggest that the odds are in favour of the long trade
- Presence of a bullish AB=CD pattern increases our chances. However entry set via Buy Stop after confirmed trend reversal
ENTRY NZDUSDDisclaimer:
This is merely a chart-based analytical trading idea and is not considered investment advice. Please manage your risks carefully and conduct your own research before making any trading decisions.
Tariffs, NZ unemployment, and rate cuts: Highlights for the weekAfter a packed calendar last week, this one looks lighter—but there are still key events across major economies likely to drive FX market movement.
India Tariffs and Oil Prices
U.S. President Donald Trump has announced plans to raise tariffs on Indian imports, citing India’s continued purchase and resale of Russian oil. The White House rightly claims this undermines sanctions and helps fund the war in Ukraine. India’s Ministry of External Affairs called the move “unjustified and unreasonable.”
New Zealand Jobs Data — Wednesday
New Zealand’s Q2 unemployment rate is expected to rise from 5.1% to 5.3%, the highest level since late 2015. With inflation back within the RBNZ’s 1–3% target range, a soft labour print could provide the final justification for a rate cut at the next policy meeting.
Bank of England Rate Decision — Thursday
The BoE is widely expected to cut its policy rate by 25 basis points this week, responding to slowing economic momentum despite ongoing inflation concerns. Traders will closely watch Governor Bailey’s remarks to gauge whether this marks the start of a broader easing cycle or a single adjustment.