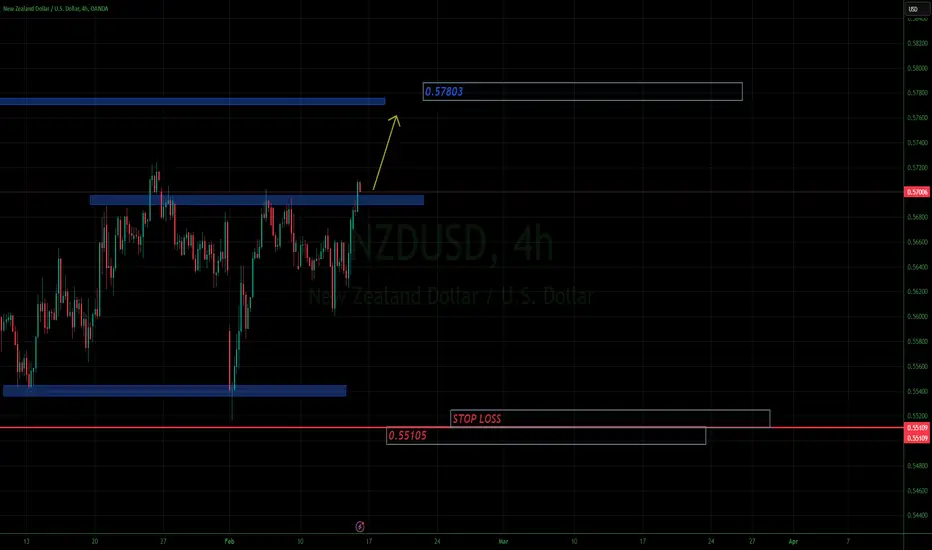
NZDUSD H4 LongPrices went beyond the level and consolidated on the lower TFs. We confirm the consolidation and enter long.
NZDUSD trade ideas
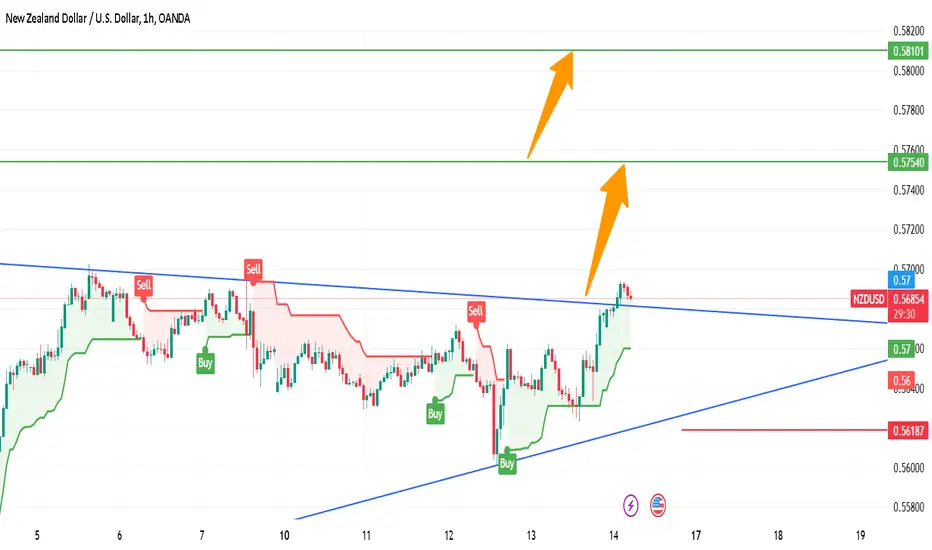
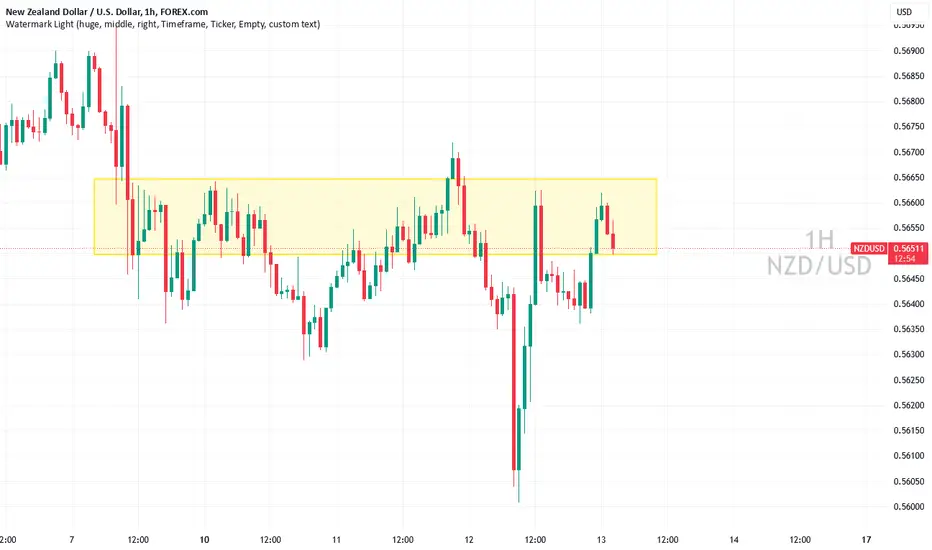
NZDUSD Strong Bullish BreakoutNZD/USD has broken a key resistance level on the H1 timeframe, confirming strong bullish momentum. This breakout signals a shift in market sentiment, with buyers taking control and pushing the price higher. If the momentum continues, we could see further upside movement.
📌 Trade Details:
✅ Entry: 0.56860
🔹 Support Level/Stop Loss: 0.56180
🎯 Target 1: 0.57540
🎯 Target 2: 0.58100
As long as the price holds above the support level, the bullish trend remains intact. Traders should watch for confirmation and follow proper risk and money management to maximize gains while protecting capital. Stay disciplined and trade wisely!
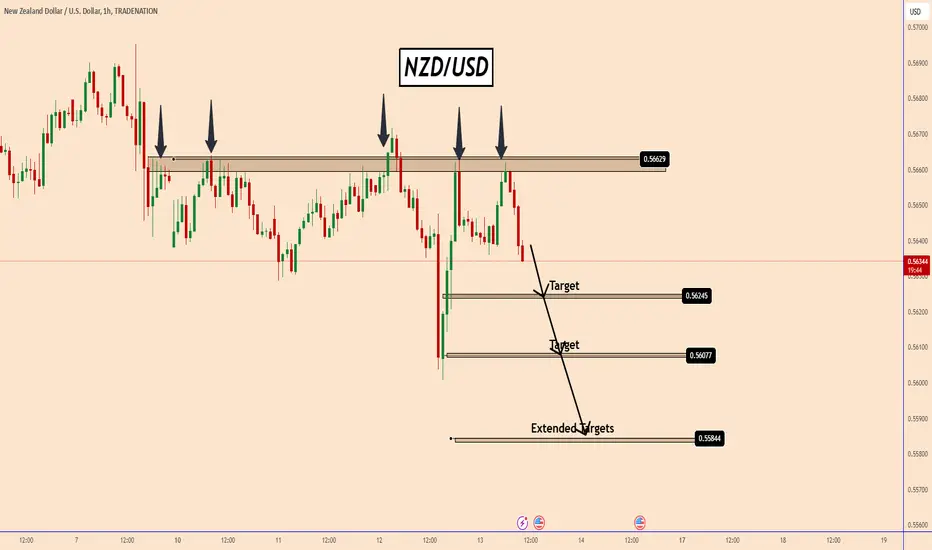
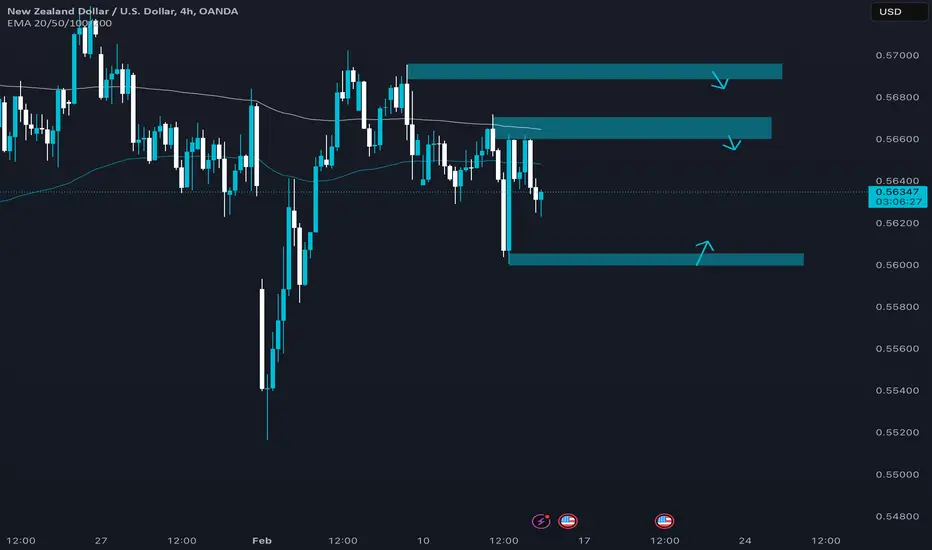
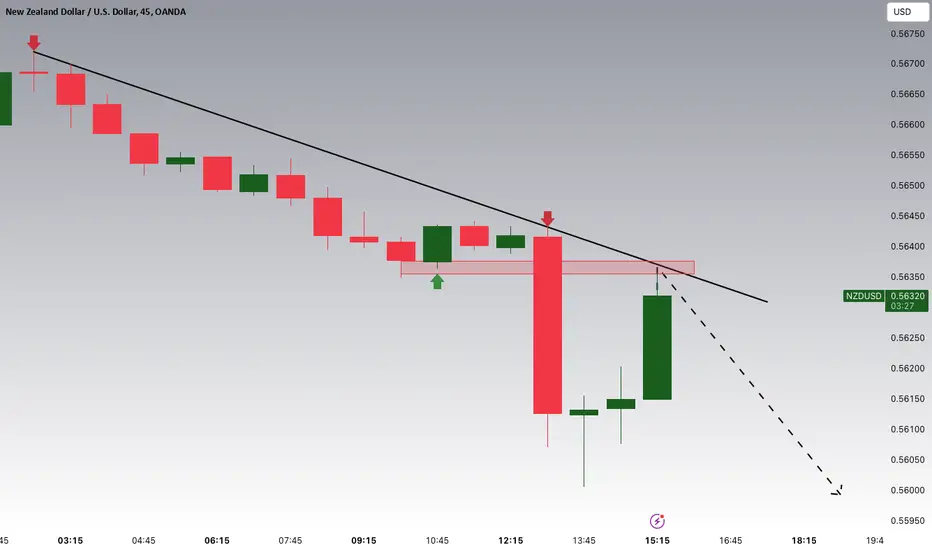
NZDUSD Technical and Fundamental AnalysisNZDUSD Technical and Fundamental Analysis
Technical analysis:
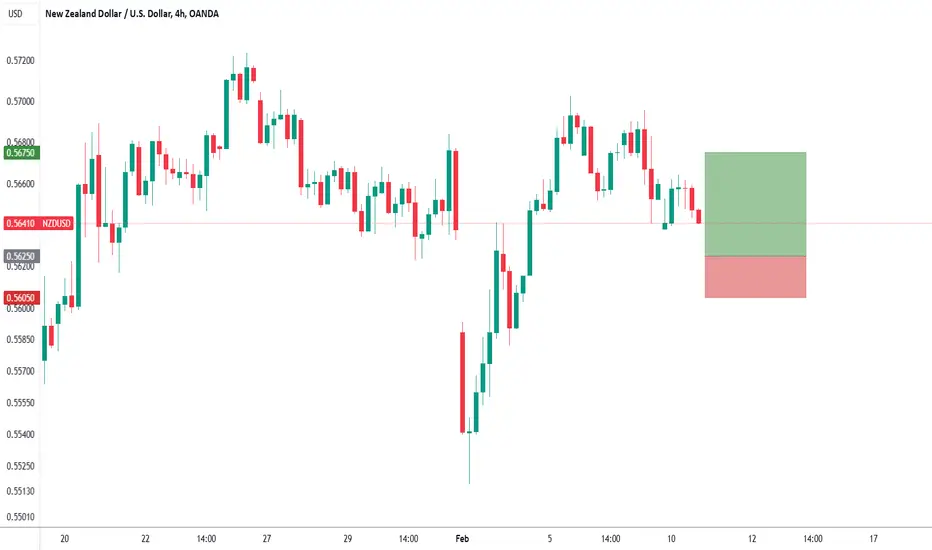
Price tested a very strong resistance zone near 0.5665. Every time it was tested the price move down. The odds are that it can move down more today from this zone to 0.5625 ; 0.5607 and 0.5585
Fundamental analysis:
President Trump continues to threat all countries with tariffs.
U.S. President Donald Trump said he would impose reciprocal tariffs as soon as Wednesday evening , February 13th, on every country that charges duties on U.S. imports, in a move that ratchets up fears of a widening global trade war and threatens to accelerate U.S. inflation.
This could support the USD strength and can push NZDUSD down even more.
You may find more details in the chart!
Thank you and Good Luck!
❤️PS: Please support with a like or comment if you find this analysis useful for your trading day❤️
Disclosure: I am part of Trade Nation's Influencer program and receive a monthly fee for using their TradingView charts in my analysis.
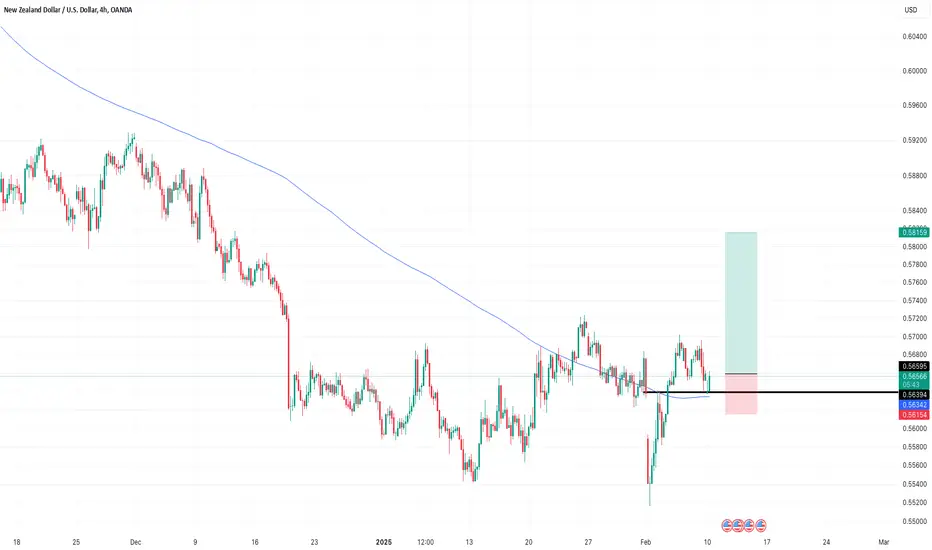
NZDUSD Bullish Flag developing? The NZDUSD currency pair sentiment appears neutral, supported by the longer-term sideways consolidation trading range. The recent price action appears to be an oversold bullish flag pattern, however, it needs to be taken in consideration as a part of the longer-term sideways consolidation. This could be indicative of intraday Bulls and Bears fight for dominance.
The key trading level is at 0.5600, the current swing low range from 12th February 2025. A continuation of the selling pressure below the 05625 level and a daily close below the 0.5600 support level could target additional downside support at 0.5550 followed by the 0.5517 and 0.5500 levels over the longer timeframe.
Alternatively, an oversold rally from the current levels and a confirmed breakout above 0.5700 resistance and a daily close above that level would negate the bearish outlook opening the way for a further rally and a retest of 05735 resistance followed by 0.5760 levels.
This communication is for informational purposes only and should not be viewed as any form of recommendation as to a particular course of action or as investment advice. It is not intended as an offer or solicitation for the purchase or sale of any financial instrument or as an official confirmation of any transaction. Opinions, estimates and assumptions expressed herein are made as of the date of this communication and are subject to change without notice. This communication has been prepared based upon information, including market prices, data and other information, believed to be reliable; however, Trade Nation does not warrant its completeness or accuracy. All market prices and market data contained in or attached to this communication are indicative and subject to change without notice.

NZDUSDShort Fundamental Analysis – NZD/USD
1. Context
• Reserve Bank of New Zealand (RBNZ)
• Suggests it is near the end of its hiking cycle, with inflation moderately above target but appearing more contained.
• The NZ economy is heavily influenced by dairy exports and overall Asian demand (particularly from China).
• Federal Reserve (Fed)
• Maintains a hawkish stance with high interest rates, backed by strong US economic indicators (GDP ~+2.6%, unemployment ~3.7%).
• The resulting yield differential typically bolsters the USD against lower-yielding currencies like the NZD.
2. Possible Direction
• Bias: Slightly bearish on NZD/USD, given the Fed’s more restrictive policy and uncertainties around global demand for New Zealand’s key exports.
• Alternate Scenario:
• If commodity prices (especially dairy) recover strongly or if Chinese demand rebounds, the NZD may see improved support.
• A dovish pivot by the Fed—should US data soften—could also favor a short-term NZD/USD uptick.
3. Factors to Watch This Week
1. RBNZ Communications
• Policy statements and economic forecasts that might signal a continuation or shift in rate strategy.
2. Commodity Market Developments
• Dairy and agricultural export data can significantly affect the NZD.
3. US Economic Indicators
• Inflation, jobs, and consumer spending data often dictate the Fed’s stance, influencing USD strength.
4. Overall Conclusion
• NZD remains sensitive to external demand and RBNZ’s largely neutral outlook, potentially limiting upward moves.
• USD retains broader support on higher interest rates and resilient economic performance.
• In the near term, NZD/USD could stay pressured unless global commodity demand strengthens or the Fed unexpectedly turns dovish.
Disclaimer
This analysis is provided for educational purposes only and does not constitute trading advice. Financial markets can be volatile and carry substantial risk. Always consider your risk tolerance and consult official sources before making any trading decisions.

nzd/usd-sellbuyers rejected numerous times
sell nzdusd
usa politics sudden and unpredictable, out of ordinary
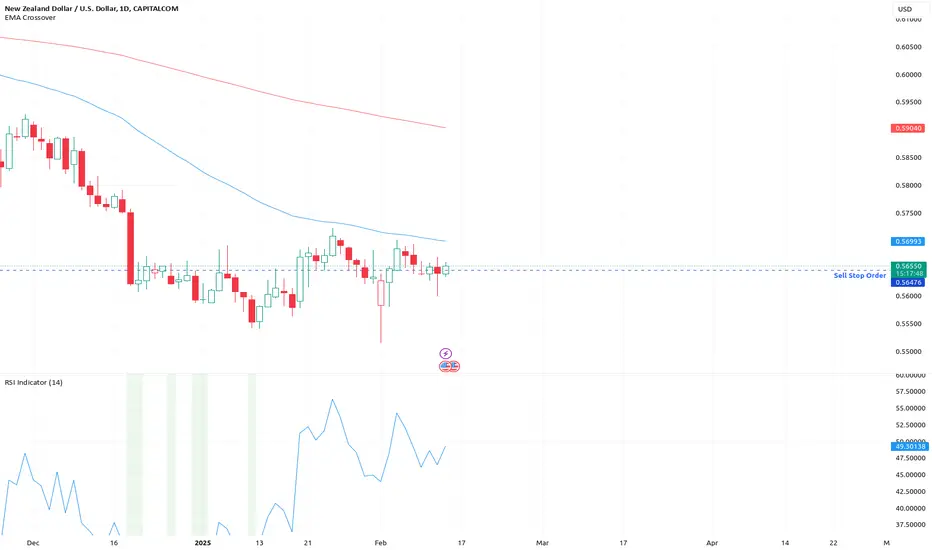
How To Short Sell Using This 3 Step SystemIn my last post, i showed you how to use
candle stick patterns
to find a good entry
Now when you ae screening for
these stocks,or forex pairs
you ned to be very careful with the tools
you decide to use for this skill.
Look at this chart.
You will notice that the
RSI level is in a trading range
on this CAPITALCOM:NZDUSD
the price action is just above the
sell stop order
now this move will take you about 30 days
in order for it to be a profit for you
also there is a large amount
of risk so don't use more than x10 Margin on this
one
Also, keep about 30% liquid if you are
trading future contacts.
The good thing is you can also
see the rocket booster strategy
This is where the following
3 steps are happening
1-The price is below the 50 EMA
2-The price is below the 200 EMA
3-The price has to gap down within 30 days
Forex trading is a bit slow but
it will give some profit with the right
risk management strategy
-
Rocket boost this content to learn more
-
Disclaimer: Trading is risky please learn risk management
and profit-taking strategies
Also, feel free to use a simulation trading account.
NZDUSD LongAccording to Commitment of Traders report, Commercials are heavily long on NZD and short on USD. Current US government action is making USD very volatile, however, the setting looks good enough for a long trade. Price finding resistance at 200 SMA is also a good sign.
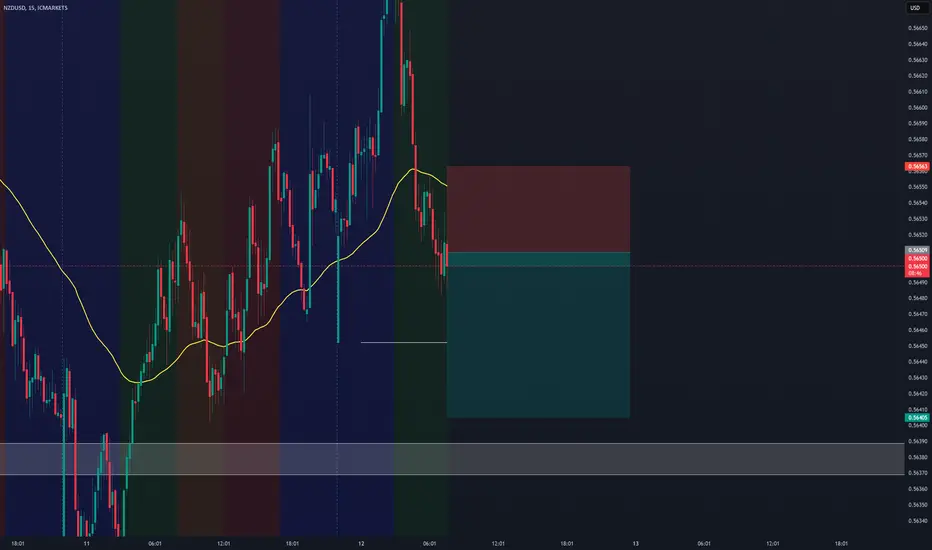
NZDUSD: High CPI and Potential DownsidesHey Traders, in today's trading session we are monitoring NZDUSD for a selling opportunity around 0.56400 zone, NZDUSD is trading in a downtrend and currently is in a correction phase in which it is approaching the trend at 0.56400 support and resistance area.
Trade safe, Joe.
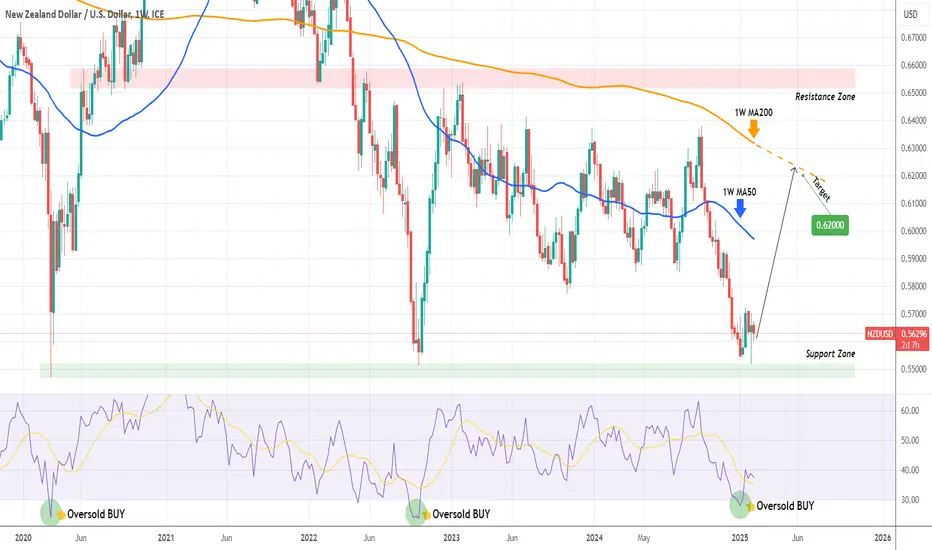
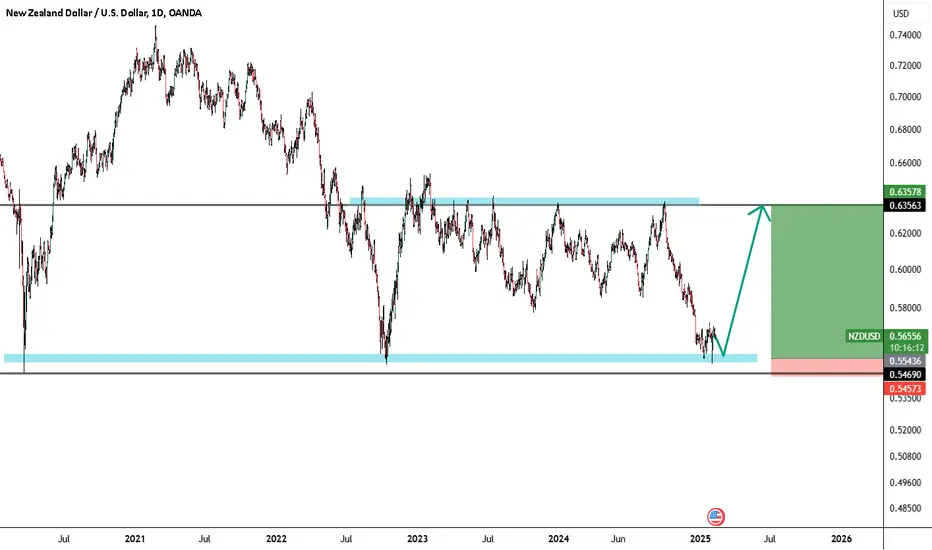
NZDUSD preparing massive rebound on the 5-year Support Zone.The NZDUSD pair rebounded last week exactly at the top of the 5-year Support Zone. This is the 3rd time in total and first since October 10 2022.
As you can see, both previous times that this Support Zone was touched, the price reacted with an immediate rebound and skyrocketed to the long-term Resistance Zone (0.65150 - 0.65850). Also on both those bottoms, the 1W RSI broke below the 30.00 oversold barrier and rebounded.
This time, we have the 1W MA200 (orange trend-line) to consider as the first long-term Resistance, so our Target is just below a potential extension of it at 0.6200.
-------------------------------------------------------------------------------
** Please LIKE 👍, FOLLOW ✅, SHARE 🙌 and COMMENT ✍ if you enjoy this idea! Also share your ideas and charts in the comments section below! This is best way to keep it relevant, support us, keep the content here free and allow the idea to reach as many people as possible. **
-------------------------------------------------------------------------------
💸💸💸💸💸💸
👇 👇 👇 👇 👇 👇
NZDUSD PositiveWe may see a bullish surge across all USD pairs today. NZDUSD presents us with the best entry here. Today at 15:30 the fundamentals will boost NZDUSD price. I am targeting 0,5678
Kiwi H1 | Falling towards overlap support at 50% FiboThe Kiwi (NZD/USD) is falling towards an overlap support and could potentially bounce off this level to climb higher.
Buy entry is at 0.5628 which is an overlap support that aligns with the 38.2% Fibonacci retracement level.
Stop loss is at 0.5590 which is a level that lies underneath a confluence of Fibonacci levels i.e. the 50.0% retracement and the 161.8% extension.
Take profit is at 0.5687 which is a multi-swing-high resistance.
High Risk Investment Warning
Trading Forex/CFDs on margin carries a high level of risk and may not be suitable for all investors. Leverage can work against you.
Stratos Markets Limited (www.fxcm.com):
CFDs are complex instruments and come with a high risk of losing money rapidly due to leverage. 63% of retail investor accounts lose money when trading CFDs with this provider. You should consider whether you understand how CFDs work and whether you can afford to take the high risk of losing your money.
Stratos Europe Ltd (www.fxcm.com):
CFDs are complex instruments and come with a high risk of losing money rapidly due to leverage. 63% of retail investor accounts lose money when trading CFDs with this provider. You should consider whether you understand how CFDs work and whether you can afford to take the high risk of losing your money.
Stratos Trading Pty. Limited (www.fxcm.com):
Trading FX/CFDs carries significant risks. FXCM AU (AFSL 309763), please read the Financial Services Guide, Product Disclosure Statement, Target Market Determination and Terms of Business at www.fxcm.com
Stratos Global LLC (www.fxcm.com):
Losses can exceed deposits.
Please be advised that the information presented on TradingView is provided to FXCM (‘Company’, ‘we’) by a third-party provider (‘TFA Global Pte Ltd’). Please be reminded that you are solely responsible for the trading decisions on your account. There is a very high degree of risk involved in trading. Any information and/or content is intended entirely for research, educational and informational purposes only and does not constitute investment or consultation advice or investment strategy. The information is not tailored to the investment needs of any specific person and therefore does not involve a consideration of any of the investment objectives, financial situation or needs of any viewer that may receive it. Kindly also note that past performance is not a reliable indicator of future results. Actual results may differ materially from those anticipated in forward-looking or past performance statements. We assume no liability as to the accuracy or completeness of any of the information and/or content provided herein and the Company cannot be held responsible for any omission, mistake nor for any loss or damage including without limitation to any loss of profit which may arise from reliance on any information supplied by TFA Global Pte Ltd.
The speaker(s) is neither an employee, agent nor representative of FXCM and is therefore acting independently. The opinions given are their own, constitute general market commentary, and do not constitute the opinion or advice of FXCM or any form of personal or investment advice. FXCM neither endorses nor guarantees offerings of third-party speakers, nor is FXCM responsible for the content, veracity or opinions of third-party speakers, presenters or participants.

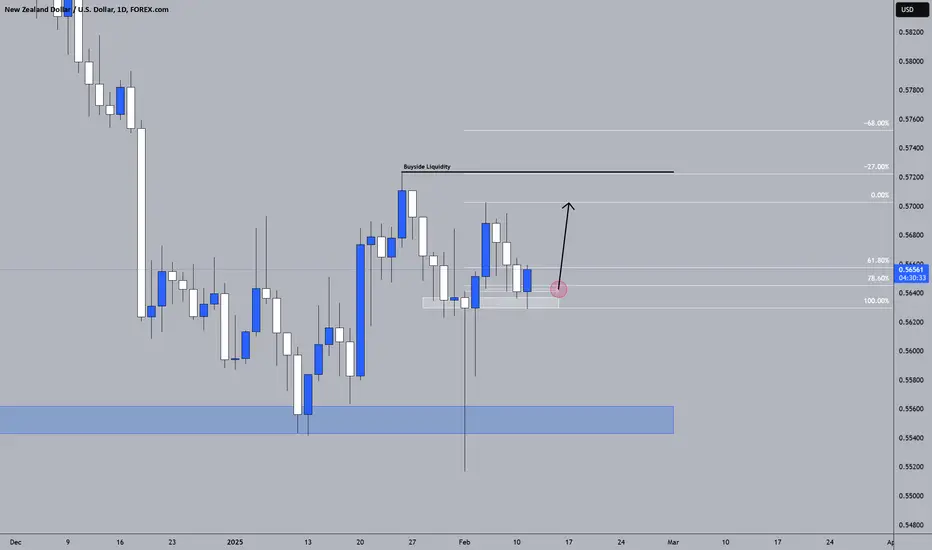
NZDUSD 11/02/2025Weekly:
-Weekly lows rejected.
-Liquidity sweep.
Daily:
-Inverse H&S pattern.
-IC.
4H:
-Bullish M pattern.
-Inverse H&S pattern.
-IC.
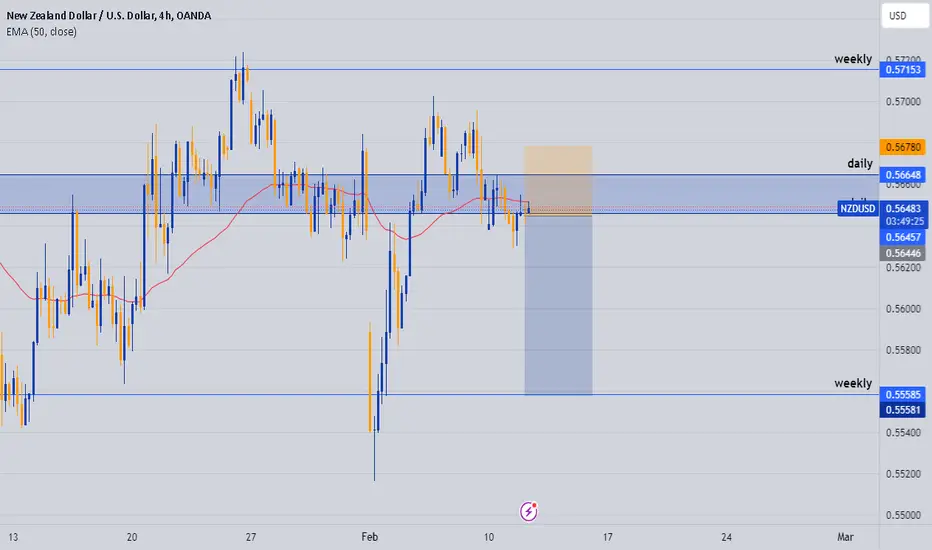
NZDUSD SELL SETUPOANDA:NZDUSD My overall bias on NAZDUSD is bearish, 4H structure is bearish with it making a retest at the Daily AOI (Area of Interest) and rejecting with a bearish engulfing variation patterning which was my confirmation to go short on NZDUSD
NZDUSD • Context:
• RBNZ: Signaled nearing the peak of the rate-hike cycle, while inflation is stabilizing.
• Domestic Economy: Strong reliance on agricultural exports and Asian demand.
• Possible Direction:
• Bias: Slightly bearish, given the Fed’s more restrictive monetary stance.
• Catalysts: News on the dairy market (Fonterra) and New Zealand macro data.
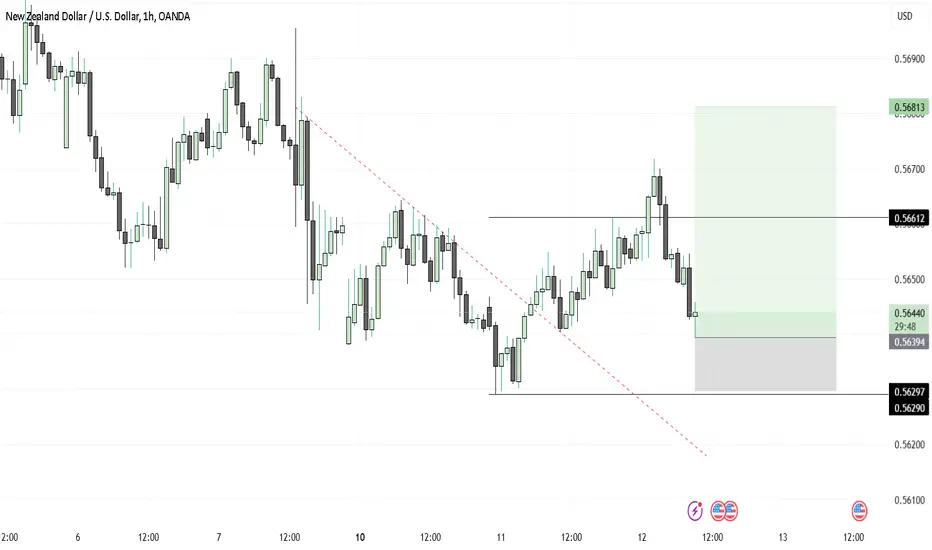
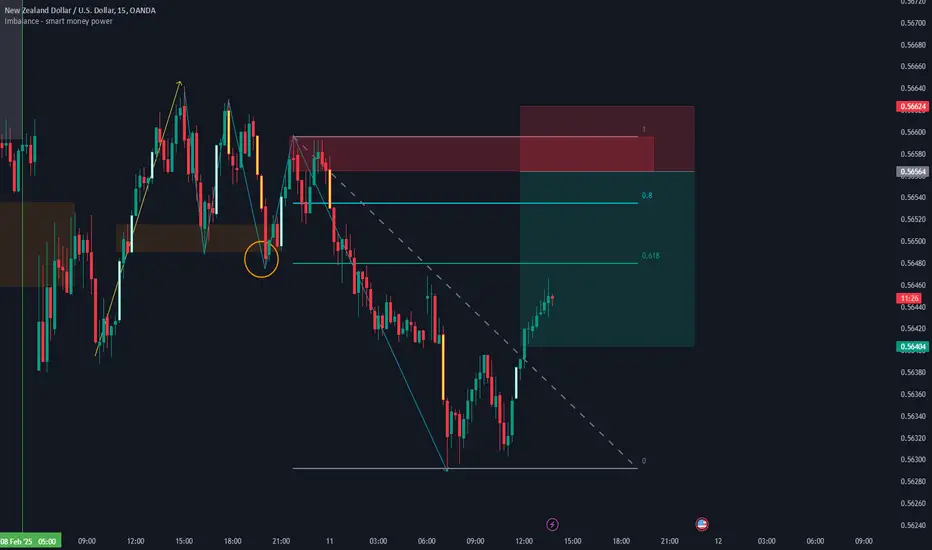
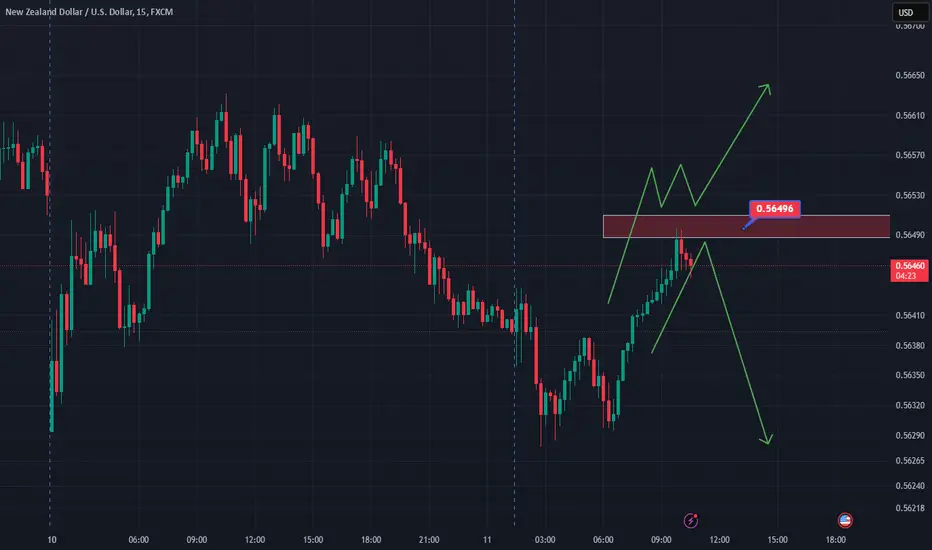
Plan: NZDUSD SellLooking to short this from the downwards Key Level.
Will cancel when :
1. a sudden imbalance emerges within the discount area
2. Nearing next major news.
Entry: 0.56564
TP: 0.56404
SL: 0.56624
NZD/USD NEXT MOVESell after bearish candle stick pattern, buy after bullish candle stick pattern....
Best bullish pattern , engulfing candle or green hammer
Best bearish pattern , engulfing candle or red shooting star
NOTE: IF YOU CAN'T SEE ANY OF TOP PATTERN IN THE ZONE DO NOT ENTER
Stop lost before pattern
R/R %1/%3
Trade in 5 Min Timeframe, use signals for scalping
NZDUSD to see a temporary move lower?NZDUSD - 24h expiry
A lower correction is expected.
We expect a reversal in this move.
Risk/Reward would be poor to call a buy from current levels.
A move through 0.5650 will confirm the bullish momentum.
The measured move target is 0.5700.
We look to Buy at 0.5625 (stop at 0.5605)
Our profit targets will be 0.5675 and 0.5700
Resistance: 0.5650 / 0.5675 / 0.5700
Support: 0.5625 / 0.5610 / 0.5600
Risk Disclaimer
The trade ideas beyond this page are for informational purposes only and do not constitute investment advice or a solicitation to trade. This information is provided by Signal Centre, a third-party unaffiliated with OANDA, and is intended for general circulation only. OANDA does not guarantee the accuracy of this information and assumes no responsibilities for the information provided by the third party. The information does not take into account the specific investment objectives, financial situation, or particular needs of any particular person. You should take into account your specific investment objectives, financial situation, and particular needs before making a commitment to trade, including seeking advice from an independent financial adviser regarding the suitability of the investment, under a separate engagement, as you deem fit.
You accept that you assume all risks in independently viewing the contents and selecting a chosen strategy.
Where the research is distributed in Singapore to a person who is not an Accredited Investor, Expert Investor or an Institutional Investor, Oanda Asia Pacific Pte Ltd (“OAP“) accepts legal responsibility for the contents of the report to such persons only to the extent required by law. Singapore customers should contact OAP at 6579 8289 for matters arising from, or in connection with, the information/research distributed.
NZDUSDhello trader, here is another swing trade opportunity, price reached the main liquidity area.. price has rejected couple of times in day tf support.. try to get in as low as possible and use stop loss as suggested below... target is the main resistance zone..
News to watchout, upcoming RBNZ cash rate 02/19
good luck
Kiwi H4 | Rising into multi-swing-high resistanceThe Kiwi (NZD/USD) is rising towards a multi-swing-high resistance and could potentially reverse off this level to drop lower.
Sell entry is at 0.5692 which is a multi-swing-high resistance.
Stop loss is at 0.5733 which is a level that sits above the 127.2% Fibonacci extension and a swing-high resistance.
Take profit is at 0.5589 which is an overlap support that aligns close to the 61.8% Fibonacci retracement level.
High Risk Investment Warning
Trading Forex/CFDs on margin carries a high level of risk and may not be suitable for all investors. Leverage can work against you.
Stratos Markets Limited (www.fxcm.com):
CFDs are complex instruments and come with a high risk of losing money rapidly due to leverage. 63% of retail investor accounts lose money when trading CFDs with this provider. You should consider whether you understand how CFDs work and whether you can afford to take the high risk of losing your money.
Stratos Europe Ltd (www.fxcm.com):
CFDs are complex instruments and come with a high risk of losing money rapidly due to leverage. 63% of retail investor accounts lose money when trading CFDs with this provider. You should consider whether you understand how CFDs work and whether you can afford to take the high risk of losing your money.
Stratos Trading Pty. Limited (www.fxcm.com):
Trading FX/CFDs carries significant risks. FXCM AU (AFSL 309763), please read the Financial Services Guide, Product Disclosure Statement, Target Market Determination and Terms of Business at www.fxcm.com
Stratos Global LLC (www.fxcm.com):
Losses can exceed deposits.
Please be advised that the information presented on TradingView is provided to FXCM (‘Company’, ‘we’) by a third-party provider (‘TFA Global Pte Ltd’). Please be reminded that you are solely responsible for the trading decisions on your account. There is a very high degree of risk involved in trading. Any information and/or content is intended entirely for research, educational and informational purposes only and does not constitute investment or consultation advice or investment strategy. The information is not tailored to the investment needs of any specific person and therefore does not involve a consideration of any of the investment objectives, financial situation or needs of any viewer that may receive it. Kindly also note that past performance is not a reliable indicator of future results. Actual results may differ materially from those anticipated in forward-looking or past performance statements. We assume no liability as to the accuracy or completeness of any of the information and/or content provided herein and the Company cannot be held responsible for any omission, mistake nor for any loss or damage including without limitation to any loss of profit which may arise from reliance on any information supplied by TFA Global Pte Ltd.
The speaker(s) is neither an employee, agent nor representative of FXCM and is therefore acting independently. The opinions given are their own, constitute general market commentary, and do not constitute the opinion or advice of FXCM or any form of personal or investment advice. FXCM neither endorses nor guarantees offerings of third-party speakers, nor is FXCM responsible for the content, veracity or opinions of third-party speakers, presenters or participants.
