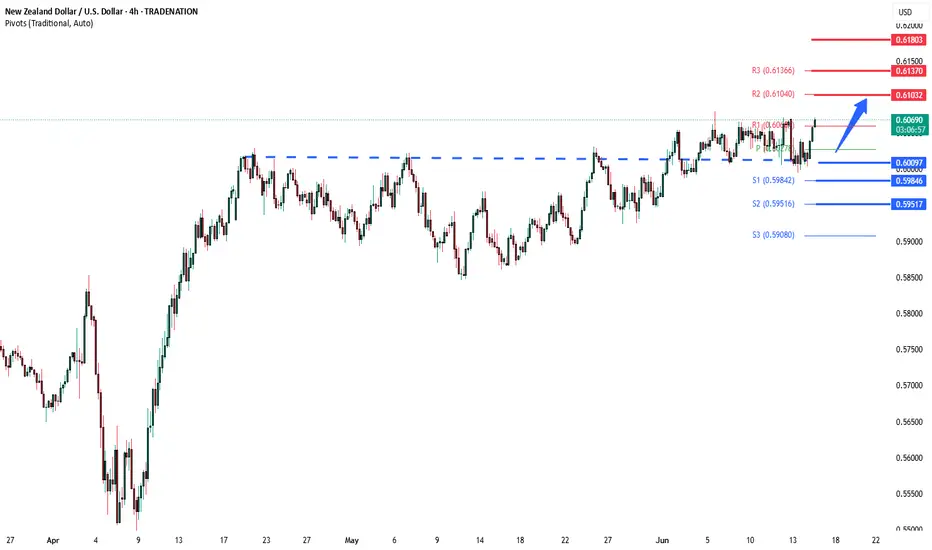
NZDUSD Bullish consolidation breakout supported at 0.6000Trend Overview:
The NZDUSD currency price remains in a bullish trend, characterised by higher highs and higher lows. The recent intraday price action is forming a continuation consolidation pattern, suggesting a potential pause before a renewed move higher.
Key Technical Levels:
Support: 0.6000 (primary pivot), followed by 0.5985 and 0.5950
Resistance: 0.6100 (initial), then 0.6140 and 0.6180
Technical Outlook:
A pullback to the 0.6000 level, which aligns with the previous consolidation zone, could act as a platform for renewed buying interest. A confirmed bounce from this support may trigger a continuation toward the next resistance levels at 0.6100, 0.6140, and ultimately 0.6180.
Conversely, a daily close below 0.6000 would suggest weakening bullish momentum. This scenario would shift the bias to bearish in the short term, potentially targeting 0.5985 and 0.5950 as downside levels.
Conclusion:
NZDUSD maintains a bullish structure while trading above the 0.6000 support. A bounce from this level would validate the consolidation as a continuation pattern, with upside potential toward the 0.6100 area. A breakdown below 0.6000, however, would invalidate this view and suggest deeper corrective risk.
This communication is for informational purposes only and should not be viewed as any form of recommendation as to a particular course of action or as investment advice. It is not intended as an offer or solicitation for the purchase or sale of any financial instrument or as an official confirmation of any transaction. Opinions, estimates and assumptions expressed herein are made as of the date of this communication and are subject to change without notice. This communication has been prepared based upon information, including market prices, data and other information, believed to be reliable; however, Trade Nation does not warrant its completeness or accuracy. All market prices and market data contained in or attached to this communication are indicative and subject to change without notice.
NZDUSD trade ideas
Long trade
1Hr TF
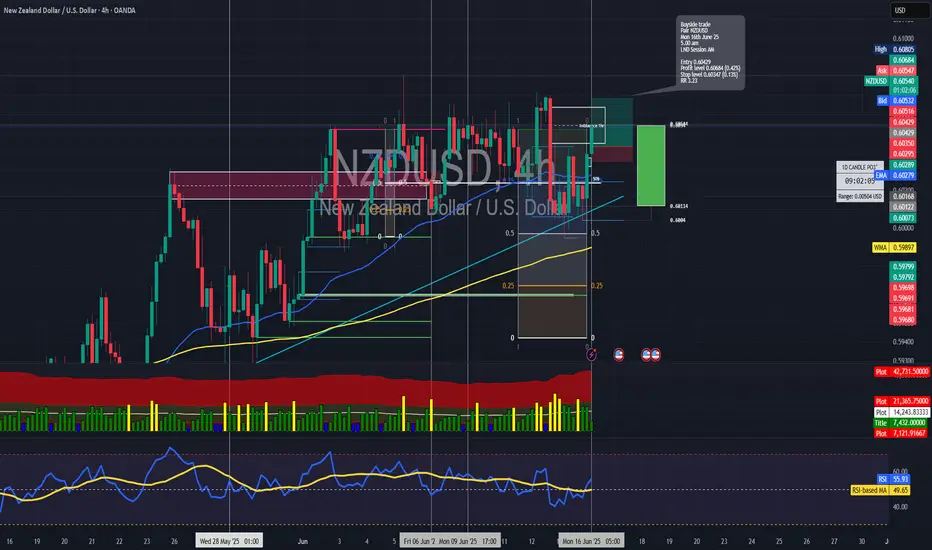
🟢 NZDUSD – Buyside Trade
Date: Monday, 16th June 2025
Session: London Session AM
Time: 5:00 AM
Entry Timeframe: 1Hr TF
Trade Parameters
Entry: 0.60429
Take Profit: 0.60684 (+0.42%)
Stop Loss: 0.60347 (−0.13%)
Risk-Reward Ratio (RR): 3.23
🧠 Trade Reasoning
The trade was initiated on a 1-hour bullish continuation setup, with price finding firm support around the 0.60350 level — a previously swept liquidity zone and minor structural demand.
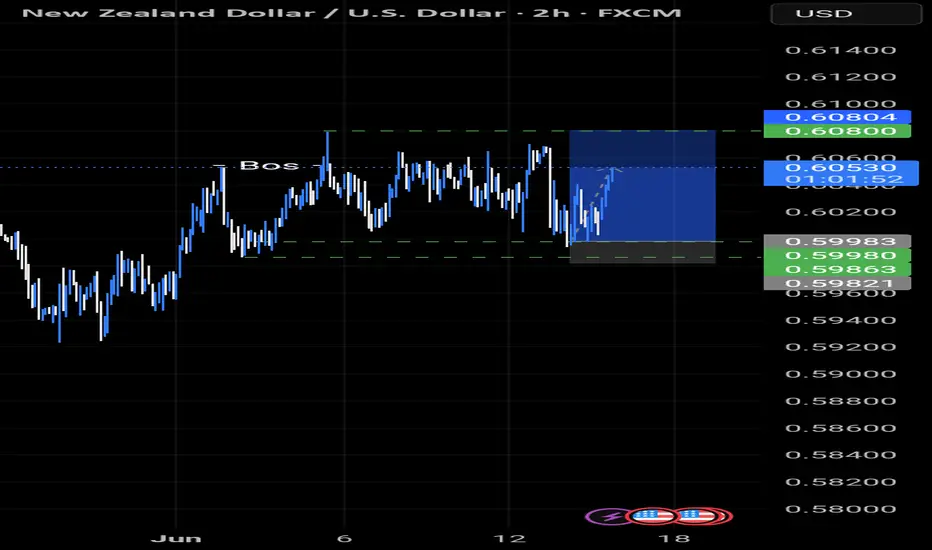
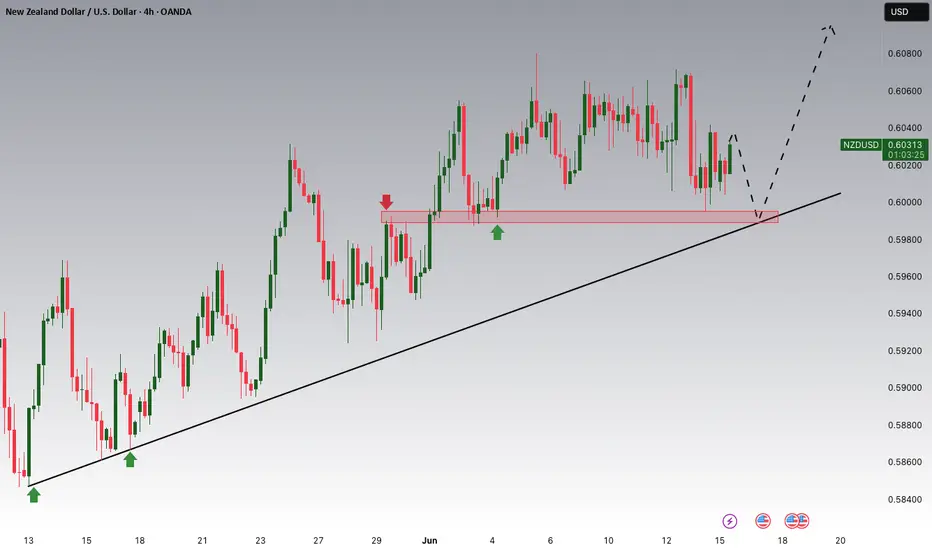
NZDUSD - BULLISH MOVE !Hello Traders !
On Monday 9 June, The NZDUSD broke the resistance level (0.60380 - 0.60072).
This key level becomes new support !
So, I expect a bullish move🚀
_________________
TARGET: 0.61050🎯

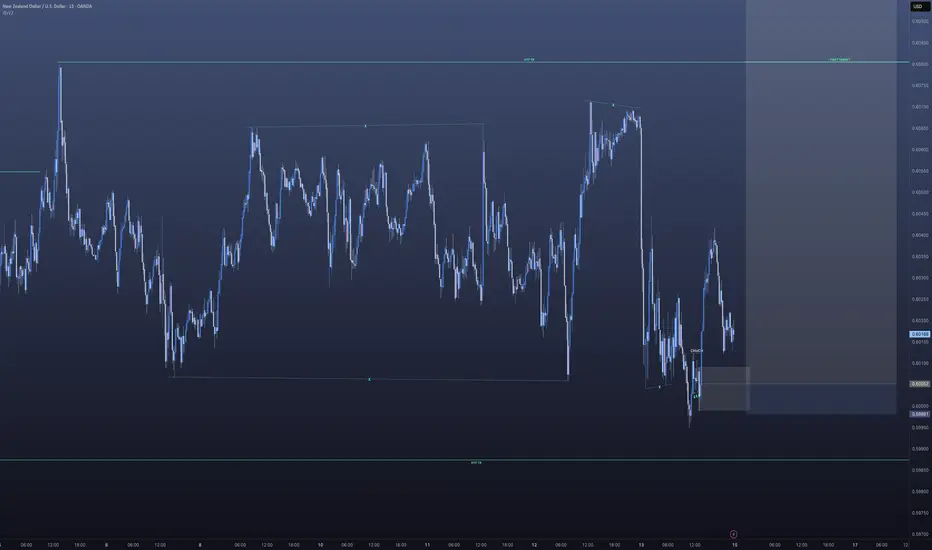
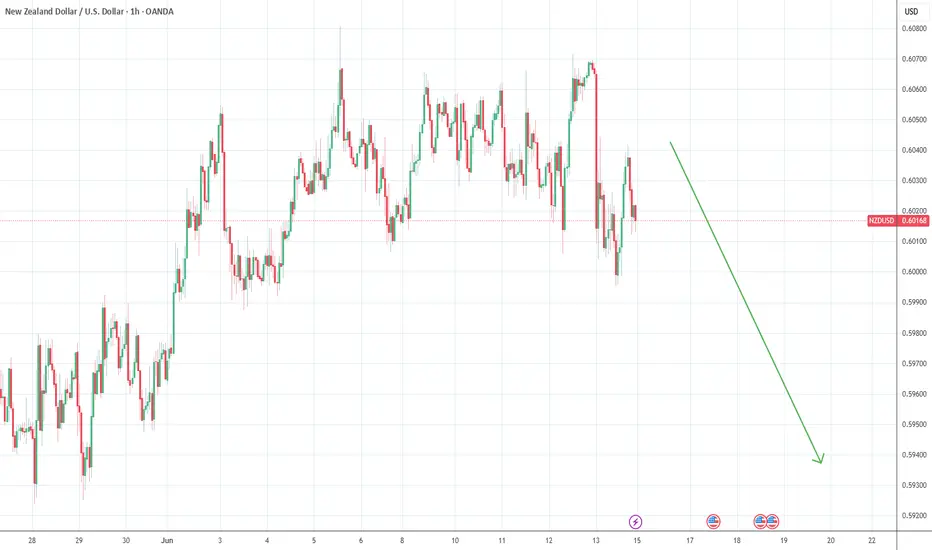
Nzdusd update On nzdusd, we're clear to the upside.
Trade management is key to ensure profits are maximized properly
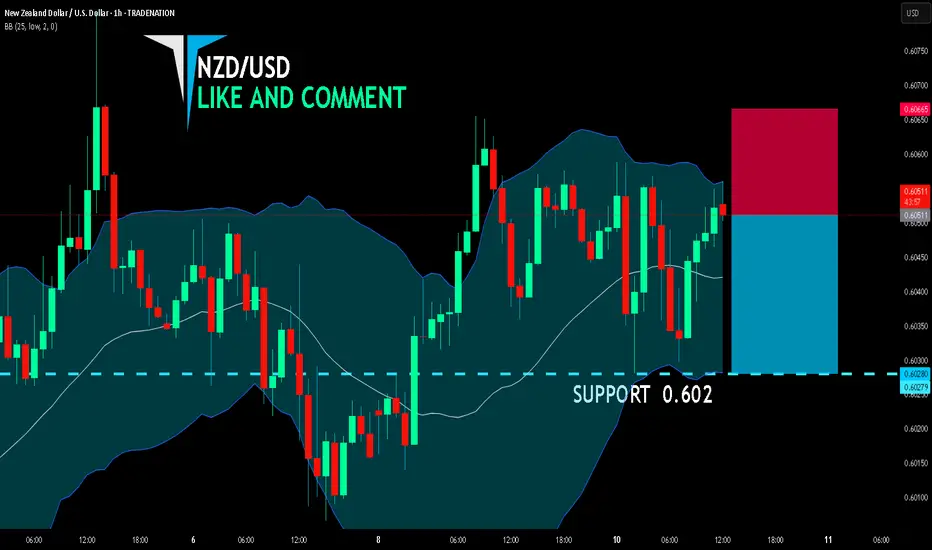
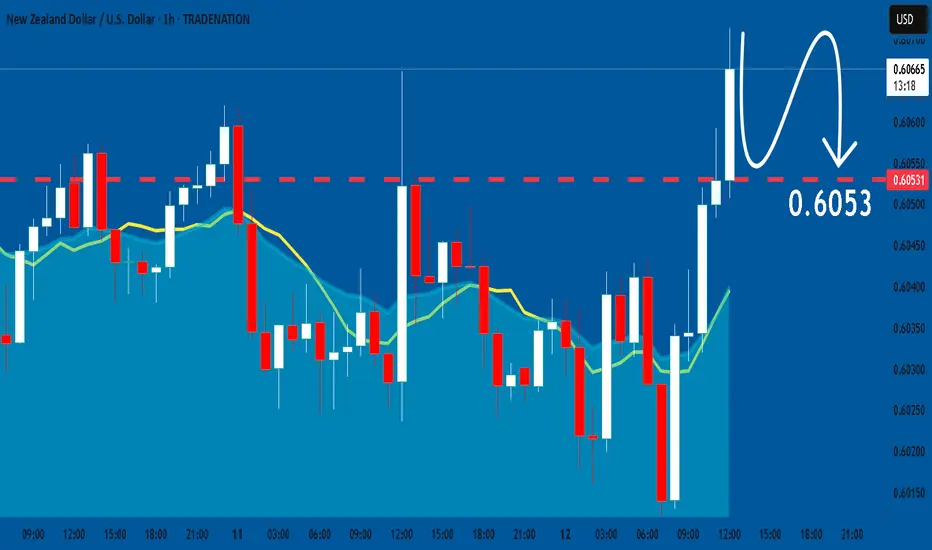
NZD/USD BEARS ARE STRONG HERE|SHORT
NZD/USD SIGNAL
Trade Direction: short
Entry Level: 0.605
Target Level: 0.602
Stop Loss: 0.606
RISK PROFILE
Risk level: medium
Suggested risk: 1%
Timeframe: 1h
Disclosure: I am part of Trade Nation's Influencer program and receive a monthly fee for using their TradingView charts in my analysis.
✅LIKE AND COMMENT MY IDEAS✅
NZDUSD Potential UpsidesHey Traders, in today's trading session we are monitoring NZDUSD for a buying opportunity around 0.60000 zone, NZDUSD is trading in an uptrend and currently is in a correction phase in which it is approaching the trend at 0.600000 support and resistance area.
Trade safe, Joe.

NZDUSD - LongWhen the market opens and the spreads die down. Will definitely be entering this trade to the upside.
We are still in a HTF bullish orderflow.
This is a great buy set up as we are at a very discounted price.
Lets see how It plays out
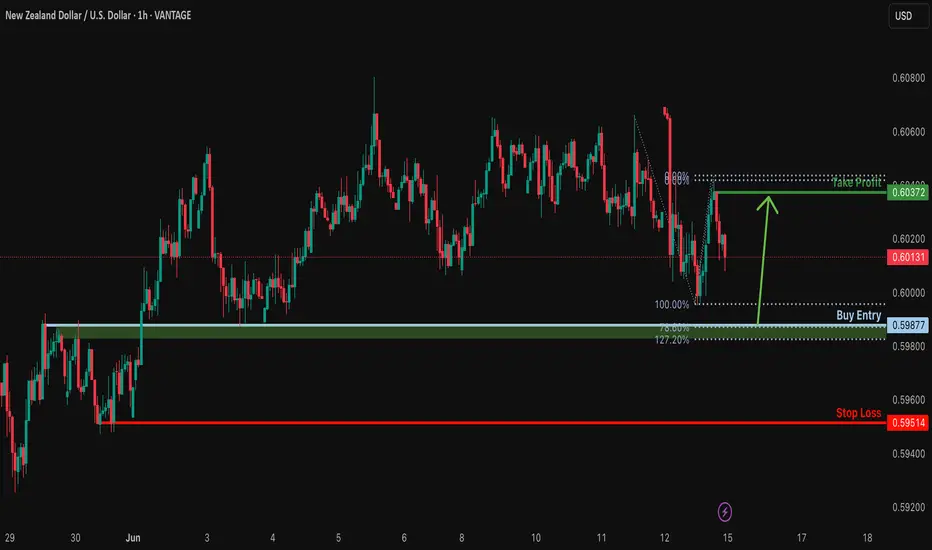
Falling towards major support level?NZD/USD is falling towards the support level which is an overlap support that aligns with the 78.6% Fibonacci projection and also slightly above the 127.2% Fibonacci extension and could bounce from this level to our take profit.
Entry: 0.5987
Why we like it:
There is an overlap support level that is slightly above the 127.2% Fibonacci extension and the also lines up with the 78.6% Fibonacci projection.
Stop loss: 0.5951
Why we like it:
There is a pullback support level.
Take profit: 0.6037
Why we like it:
There is a pullback resistance.
Enjoying your TradingView experience? Review us!
Please be advised that the information presented on TradingView is provided to Vantage (‘Vantage Global Limited’, ‘we’) by a third-party provider (‘Everest Fortune Group’). Please be reminded that you are solely responsible for the trading decisions on your account. There is a very high degree of risk involved in trading. Any information and/or content is intended entirely for research, educational and informational purposes only and does not constitute investment or consultation advice or investment strategy. The information is not tailored to the investment needs of any specific person and therefore does not involve a consideration of any of the investment objectives, financial situation or needs of any viewer that may receive it. Kindly also note that past performance is not a reliable indicator of future results. Actual results may differ materially from those anticipated in forward-looking or past performance statements. We assume no liability as to the accuracy or completeness of any of the information and/or content provided herein and the Company cannot be held responsible for any omission, mistake nor for any loss or damage including without limitation to any loss of profit which may arise from reliance on any information supplied by Everest Fortune Group.
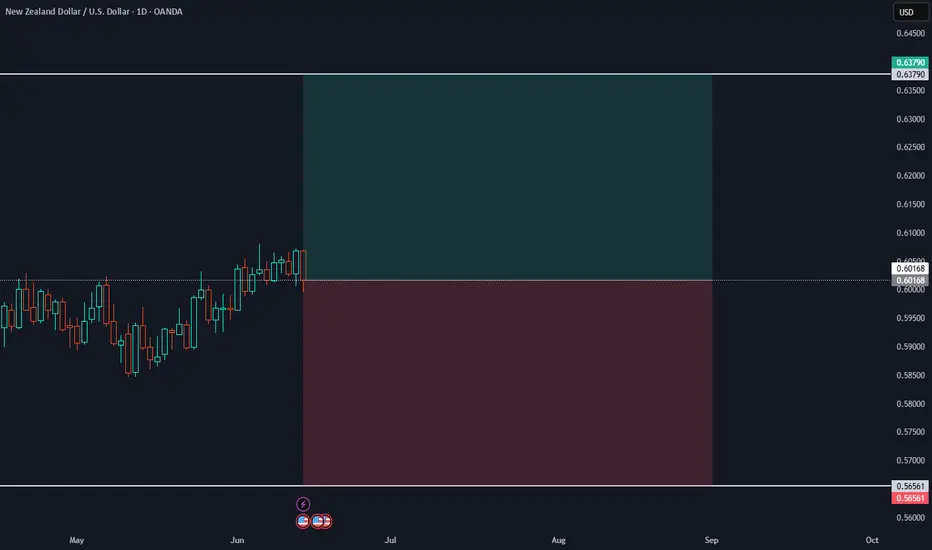
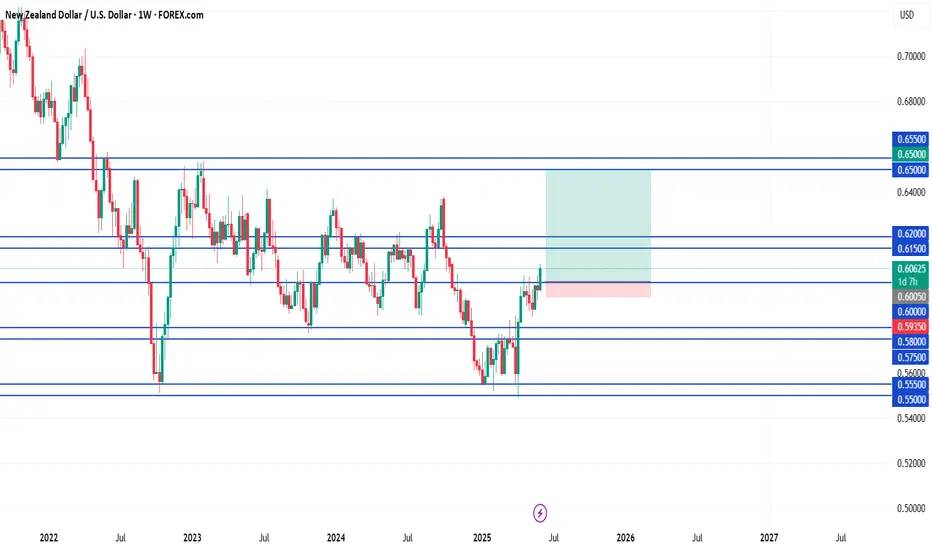
NZDUSD - Medium term prediction - 16/06/25For NZD/USD at 0.6017 here, I’d put the odds roughly at:
Rally above 0.6379 first ~60%
Drop below 0.5656 first ~40%
Why the slight tilt to the upside?
Higher‐low pattern: Since last autumn’s peak near 0.638, the lows have stepped up (≈0.550 → 0.565 → 0.582 → now 0.601), showing buyers pulling in earlier on each pullback.
Mid‐range flip: The 0.5656 zone held as support through April/May, and price has cleared the halfway mark of this range with follow-through buying.
Momentum: Daily candles on the advances have been clean, and there’s no obvious bearish divergence warning yet—leaving room for another leg up to 0.638.
That said, 0.6379 is a strong multi-month ceiling, so there remains a meaningful ~40% chance of rolling over back toward 0.5656 before tagging the top.
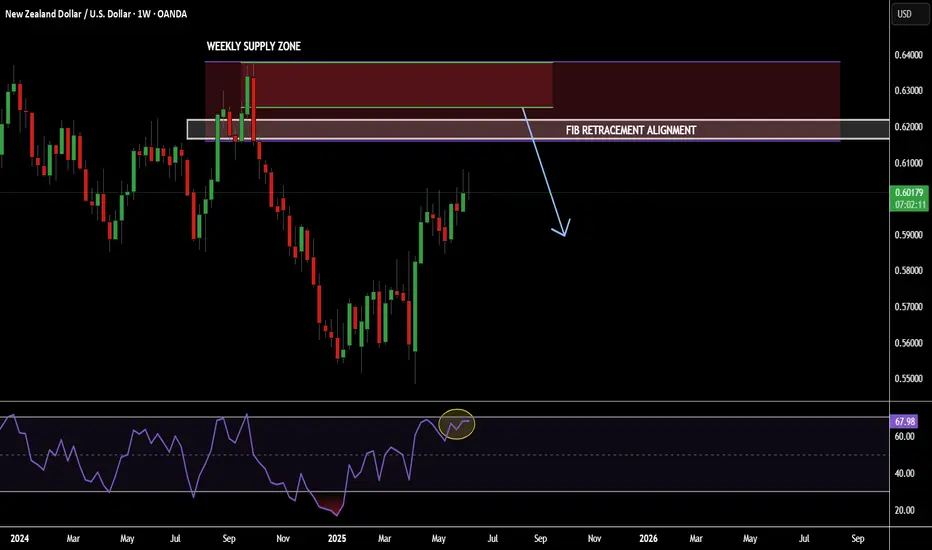
POTENTIAL SHORT OPPORTUNITY NZDUSD...SWING TRADE OPPORTUNITYHey hey TradingView fam! Hope you are all doing amazingly well! I just wanted to make another post on here for another currency pair that I see potential opportunity on for the upcoming weeks/months here. So let's dive in!
OK so NZDUSD as you can see has been trending higher on the hourly and daily timeframes for some time now. After a long move to the downside price got exhausted and has shown us some relief over the last 6 months or so! BUT...when doing my analysis I had seen a couple things that grabbed my attention for a potential trade
NOW to be 100% honest with you guys and just so you are prepared I'm seeing this as a reaction trade not continuation trade. Basically what I mean without going into to many details is the fact that I see this REACTING from the weekly supply I have marked, making a higher low, then actually continuing to the upside RATHER than coming all the way down to take out the 0.55000 lows that it created. You may ask..."Well what makes you think that?" and the simple answer is that 0.5500 was multi-year lows...usually when price comes off of those lows and shows that buying interest (unless it is on of the rare times) it usually doesn't revisit or make new lows beyond that for some time. Economies have to rebalance, rework & renew. So for any currency to be in multi-year extremes is just not sustainable for their economy.
OK so with that explanation done let's look for shorts starting around 0.61700-0.62500 reason for that range is that it is a higher timeframe zone so price may need some time to develop and breathe before moving to downside. But as you can see it is a decent sized supply zone so let it do it's thing. But as you can see there is a fib alignment based on the downward leg from years before aligning so that is a good zone to see a "bounce".
For targets I myself personally am aiming for 0.56500 since that is the last "strong demand" zone that I can see from that buyer push. So that is the next threat so to speak if we are shorting
Alright guys that is all I have for this hope this provides some value to you guys and you can pull some nuggets or even a trade from it! Trade at your own risk understanding that this is just speculative.
Cheers! Please boost this post & follow my page for more accurate trade breakdowns!
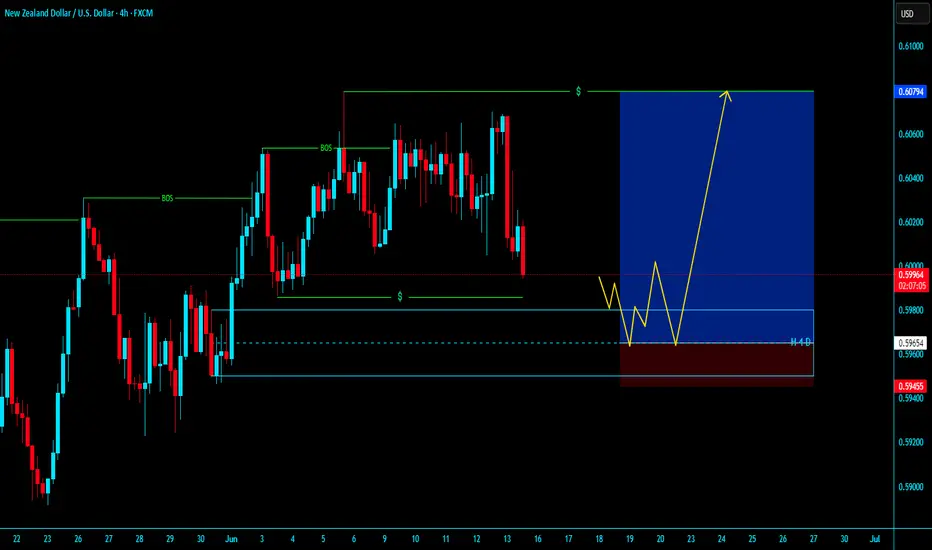
# NZDUSD H4 Demand with Proper Liquidity# NZDUSD H4 Demand with Proper Liquidity
* In LTF with valid mss confoormation then entry with proper SL and TARGET
* If Market will Enter in Demand without Reaction / Enter with 1st Candel with body close / Impulsive move then Don't enter , entry with LTF Valid Conformation with proper Valid Demand .
Be Patient's on Your Trade
~~* KGB Priyabrta Behera *~~
* ICT & Advance Mapping SMC Trader *
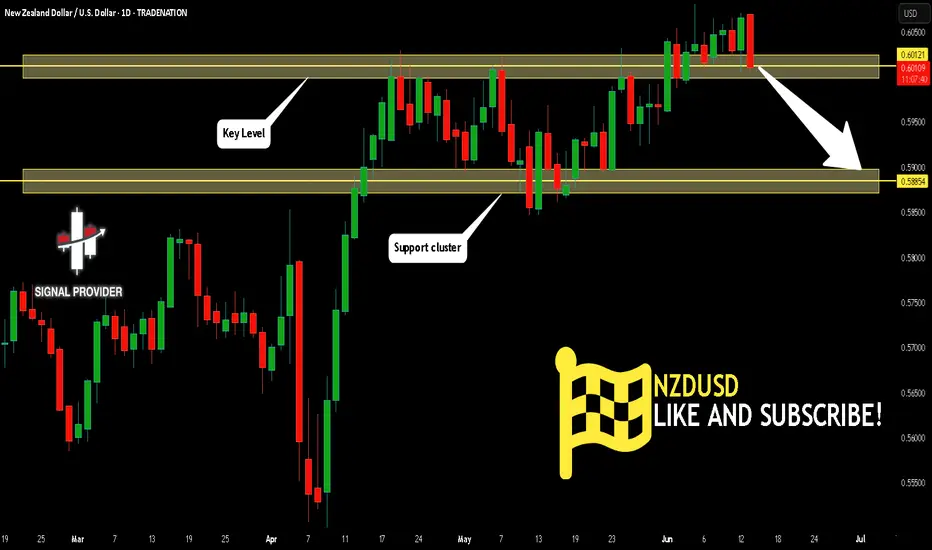
NZDUSD Is Very Bearish! Short!
Take a look at our analysis for NZDUSD.
Time Frame: 1D
Current Trend: Bearish
Sentiment: Overbought (based on 7-period RSI)
Forecast: Bearish
The market is on a crucial zone of supply 0.601.
The above-mentioned technicals clearly indicate the dominance of sellers on the market. I recommend shorting the instrument, aiming at 0.588 level.
P.S
We determine oversold/overbought condition with RSI indicator.
When it drops below 30 - the market is considered to be oversold.
When it bounces above 70 - the market is considered to be overbought.
Disclosure: I am part of Trade Nation's Influencer program and receive a monthly fee for using their TradingView charts in my analysis.
Like and subscribe and comment my ideas if you enjoy them!
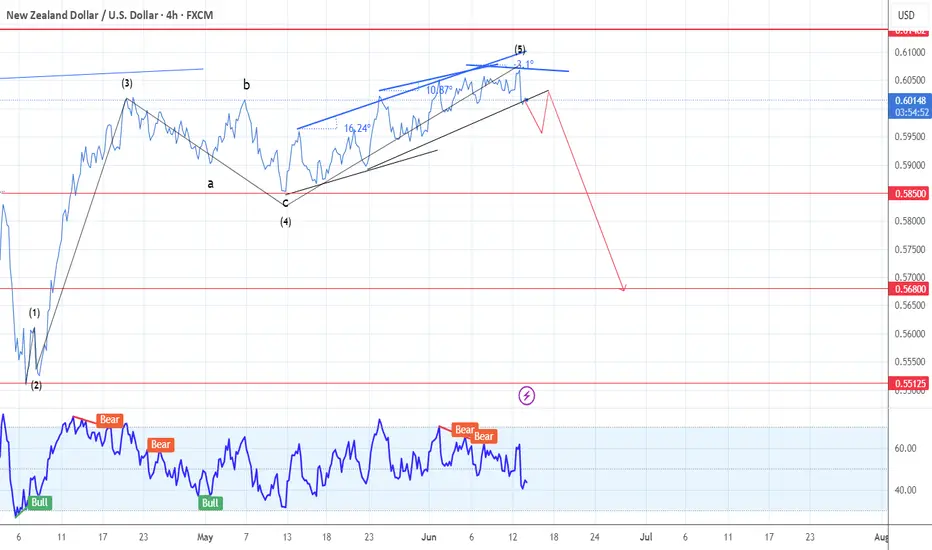
NZDUSD Elliott Wave A nalysisHello friends
In the NZDUSD chart, we are witnessing the formation of a complete Elliott wave pattern. These waves from 1 to 5 are quite clear and you can even count its sub-waves. Now wave 5 is completing and we are seeing multiple divergences in wave 5.
With the break of the trend line drawn at the bottom and a pullback to it, we can expect the price to fall to the specified support.
The first support is 0.58500 and then 0.56800.
Good luck and be profitable.
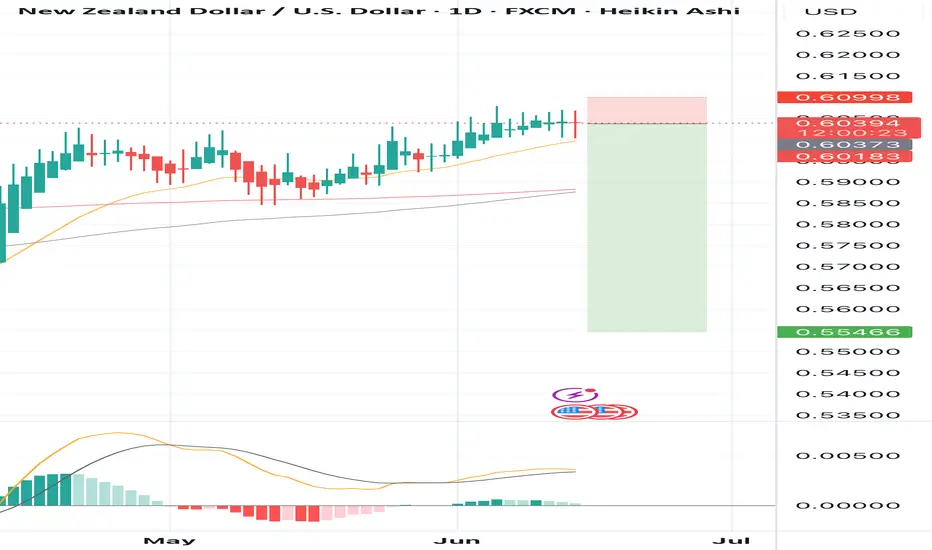
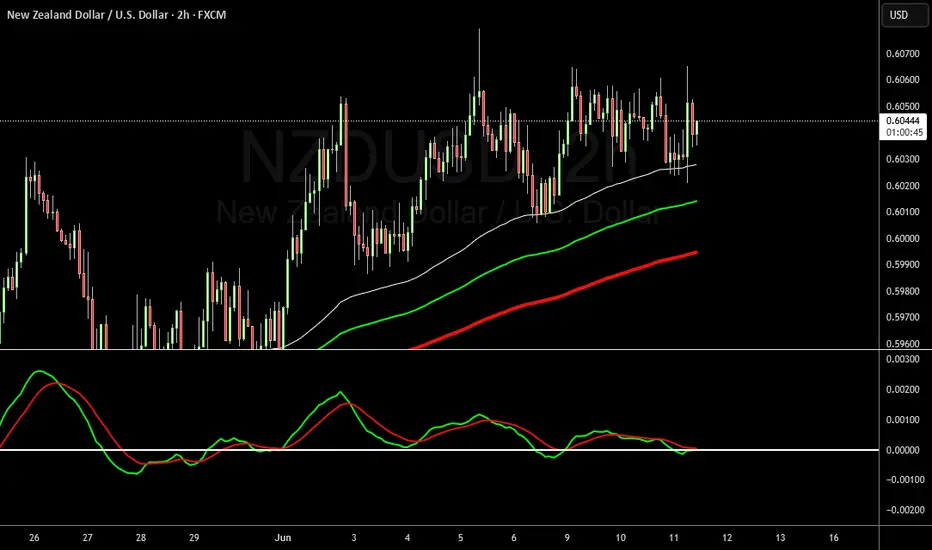
SELL NZDUSD for bullish trend reversal STOP LOSS: 0.6099SELL NZDUSD for bullish trend reversal
STOP LOSS: 0.6099
Regular Bearish Divergence
In case of Regular Bearish Divergence:
* The Indicator shows Lower Highs
* Actual Market Price shows Higher Highs
We can see a strong divergence on the MACD already and There is a strong trend reversal on the daily time frame chart.....
The daily time frame is showing strength of trend reversal from this level resistance so we
are looking for the trend reversal and correction push from here .....
TAKE PROFIT : take profit will be when the trend comes to an end, feel from to send me a direct DM if you have any question about take profit or anything
Remember to risk only what you are comfortable with….....trading with the trend, patient and good risk management is the key to success here
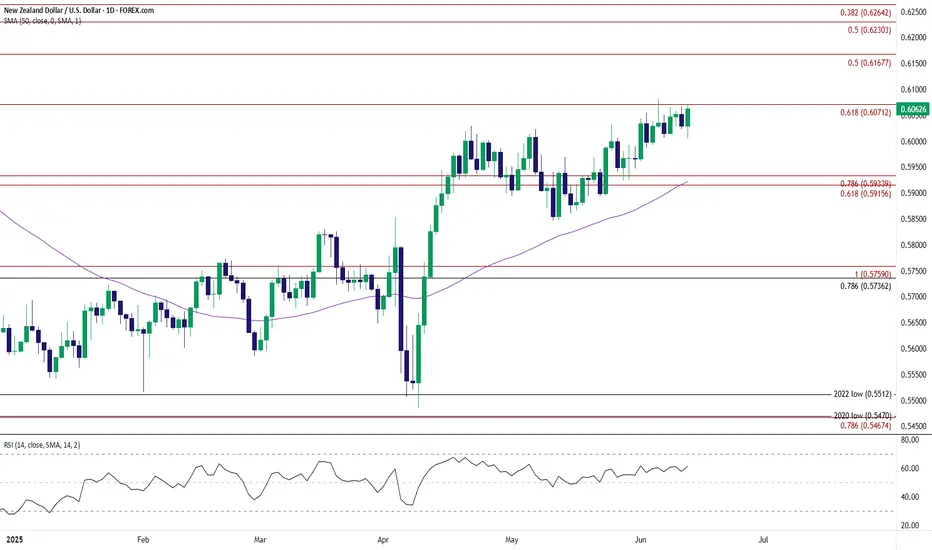
NZD/USD Coils within Opening Range for JuneNZD/USD seems to be coiling within the opening range for June as it bounces back ahead of the monthly low (0.5961).
In turn, a move/close above 0.6070 (61.8% Fibonacci extension) may push NZD/USD toward 0.6170 (50% Fibonacci extension), with the next area of interest coming in around 0.6230 (50% Fibonacci extension) to 0.6260 (38.2% Fibonacci extension).
At the same time, failure to defend the rebound from the weekly low (0.6006) may lead to a test of the monthly low (0.5961), with a move/close below the 0.5920 (61.8% Fibonacci extension) to 0.5930 (78.6% Fibonacci extension) region bringing the May low (0.5847) on the radar.
--- Written by David Song, Senior Strategist at FOREX.com
NZD/USD Buy Pullback Buy Setup
Entry Zone: 0.6000 – 0.6020
Retest of breakout + daily demand zone
Stop Loss: Below 0.5950 (ideally 0.5935 to avoid wickouts)
Target 1: 0.6150
Target 2: 0.6200
Target 3: (optional swing) 0.6500 if holding long-term
NZDUSD: Bearish Forecast & Outlook
The price of NZDUSD will most likely collapse soon enough, due to the supply beginning to exceed demand which we can see by looking at the chart of the pair.
Disclosure: I am part of Trade Nation's Influencer program and receive a monthly fee for using their TradingView charts in my analysis.
❤️ Please, support our work with like & comment! ❤️
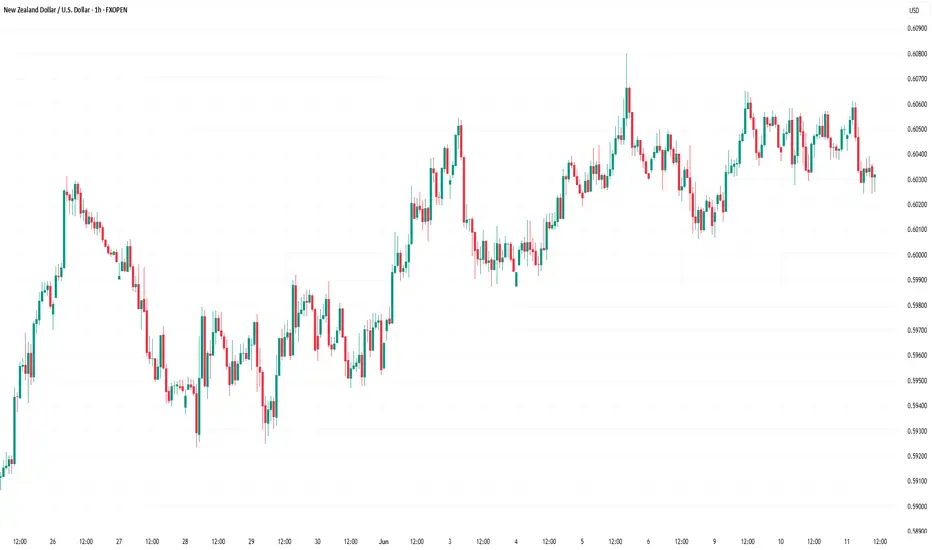
NZD/USD Aims Steady IncreaseNZD/USD Aims Steady Increase
NZD/USD is also rising and might aim for more gains above 0.6080.
Important Takeaways for NZD USD Analysis Today
- NZD/USD is consolidating gains above the 0.6030 zone.
- There is a key bullish trend line forming with support at 0.6030 on the hourly chart of NZD/USD at FXOpen.
NZD/USD Technical Analysis
On the hourly chart of NZD/USD on FXOpen, the pair started a steady increase from the 0.5990 zone. The New Zealand Dollar broke the 0.6020 resistance to start the recent increase against the US Dollar.
The pair settled above 0.6030 and the 50-hour simple moving average. It tested the 0.6065 zone and is currently consolidating gains. The pair corrected lower below the 0.6050 level and the 23.6% Fib retracement level of the upward move from the 0.6006 swing low to the 0.6064 high.
However, the bulls are active above the 0.6030 level. The NZD/USD chartsuggests that the RSI is stable near 50. On the upside, the pair might struggle near 0.6065. The next major resistance is near the 0.6080 level.
A clear move above the 0.6080 level might even push the pair toward the 0.6120 level. Any more gains might clear the path for a move toward the 0.6200 resistance zone in the coming days.
On the downside, immediate support is near the 0.6030 level. There is also a key bullish trend line forming with support at 0.6030. It is close to the 61.8% Fib retracement level of the upward move from the 0.6006 swing low to the 0.6064 high.
The first key support is near the 0.6005 level. The next major support is near the 0.5990 level. If there is a downside break below the 0.5990 support, the pair might slide toward the 0.5970 support. Any more losses could lead NZD/USD in a bearish zone to 0.5950.
This article represents the opinion of the Companies operating under the FXOpen brand only. It is not to be construed as an offer, solicitation, or recommendation with respect to products and services provided by the Companies operating under the FXOpen brand, nor is it to be considered financial advice.
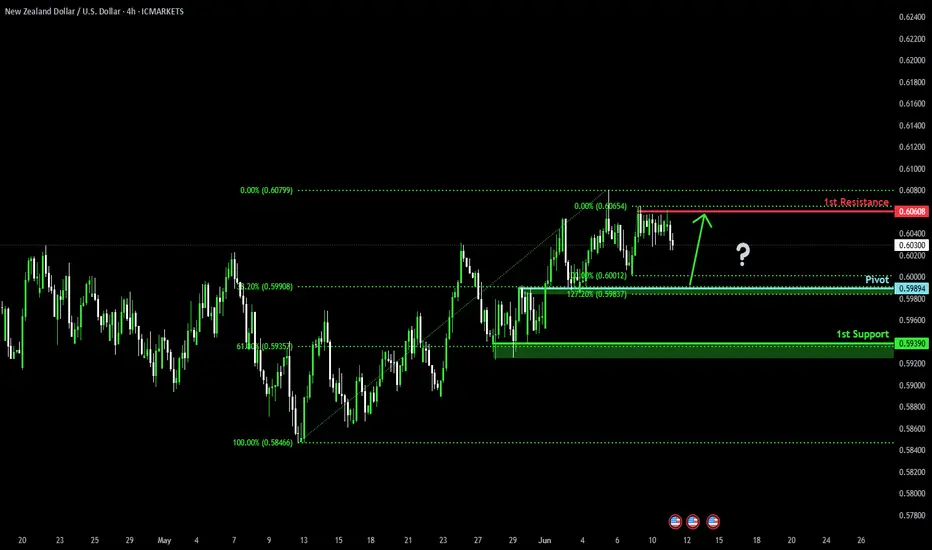
Bullish bounce?The Kiwi (NZD/USD) is falling towards the pivot which acts as an overlap support and could bounce to the 1st resistance.
Pivot: 0.5989
1st Support: 0.5939
1st Resistance: 0.6060
Risk Warning:
Trading Forex and CFDs carries a high level of risk to your capital and you should only trade with money you can afford to lose. Trading Forex and CFDs may not be suitable for all investors, so please ensure that you fully understand the risks involved and seek independent advice if necessary.
Disclaimer:
The above opinions given constitute general market commentary, and do not constitute the opinion or advice of IC Markets or any form of personal or investment advice.
Any opinions, news, research, analyses, prices, other information, or links to third-party sites contained on this website are provided on an "as-is" basis, are intended only to be informative, is not an advice nor a recommendation, nor research, or a record of our trading prices, or an offer of, or solicitation for a transaction in any financial instrument and thus should not be treated as such. The information provided does not involve any specific investment objectives, financial situation and needs of any specific person who may receive it. Please be aware, that past performance is not a reliable indicator of future performance and/or results. Past Performance or Forward-looking scenarios based upon the reasonable beliefs of the third-party provider are not a guarantee of future performance. Actual results may differ materially from those anticipated in forward-looking or past performance statements. IC Markets makes no representation or warranty and assumes no liability as to the accuracy or completeness of the information provided, nor any loss arising from any investment based on a recommendation, forecast or any information supplied by any third-party.
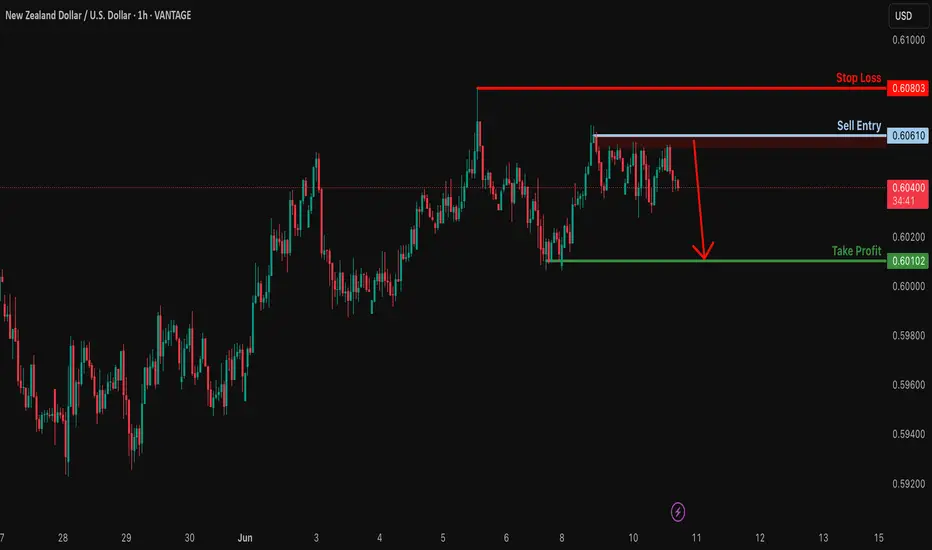
Potential bearish drop off major resistance?NZD/USD has rejected off the resistance level which is a pullback resistance and could drop from this level to our take profit.
Entry: 0.6061
Why we like it:
There is a pullback resistance level.
Stop loss: 0.6080
Why we like it:
There is a pullback resistance level.
Take profit: 0.6010
Why we like it:
There is a pullback support level.
Enjoying your TradingView experience? Review us!
Please be advised that the information presented on TradingView is provided to Vantage (‘Vantage Global Limited’, ‘we’) by a third-party provider (‘Everest Fortune Group’). Please be reminded that you are solely responsible for the trading decisions on your account. There is a very high degree of risk involved in trading. Any information and/or content is intended entirely for research, educational and informational purposes only and does not constitute investment or consultation advice or investment strategy. The information is not tailored to the investment needs of any specific person and therefore does not involve a consideration of any of the investment objectives, financial situation or needs of any viewer that may receive it. Kindly also note that past performance is not a reliable indicator of future results. Actual results may differ materially from those anticipated in forward-looking or past performance statements. We assume no liability as to the accuracy or completeness of any of the information and/or content provided herein and the Company cannot be held responsible for any omission, mistake nor for any loss or damage including without limitation to any loss of profit which may arise from reliance on any information supplied by Everest Fortune Group.