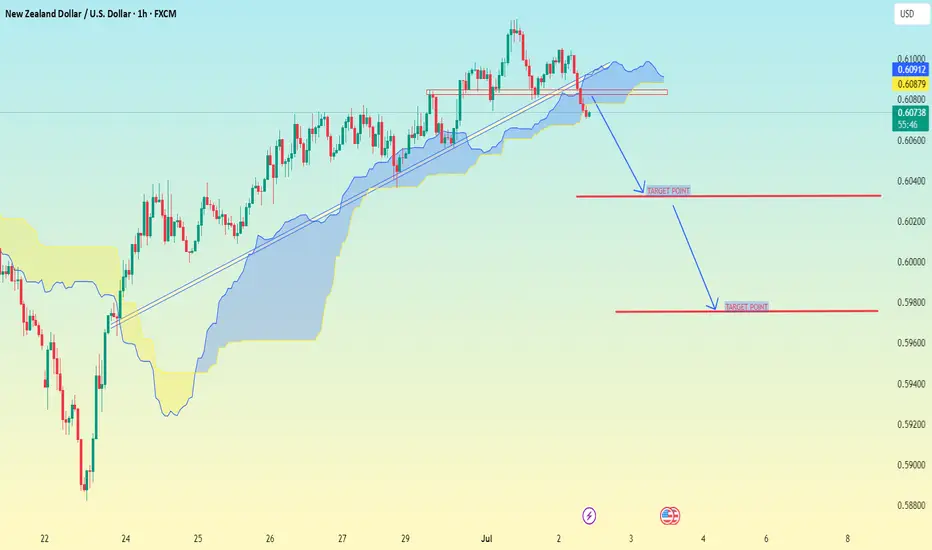
NZD/USD(New Zealand Dollar vs US Dollar) chart on the 1H timefrm NZD/USD (New Zealand Dollar vs US Dollar) chart on the 1H timeframe:
Price has broken below the ascending trendline and is now trading below the Ichimoku Cloud, confirming bearish momentum.
You already have clear two downside target levels marked on the chart.
Based on your chart:
✅ First Target: 0.60200
✅ Second Target: 0.59500
---
Quick Summary:
Bearish breakout confirmed.
Targets are positioned at 0.60200 and 0.59500.
As long as price stays below the Ichimoku Cloud, the bearish trend is valid.
Let me know if you want stop-loss or confirmation levels suggestions.
NZDUSD trade ideas
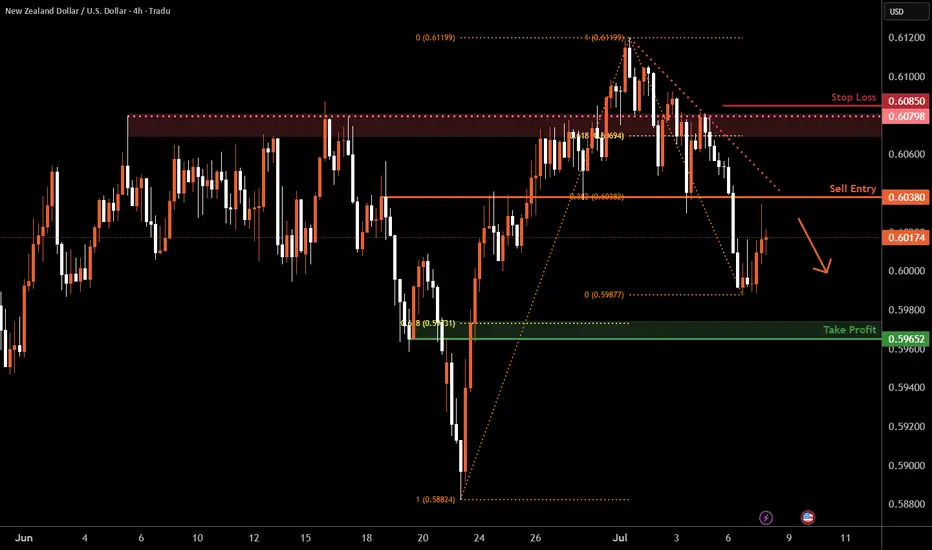
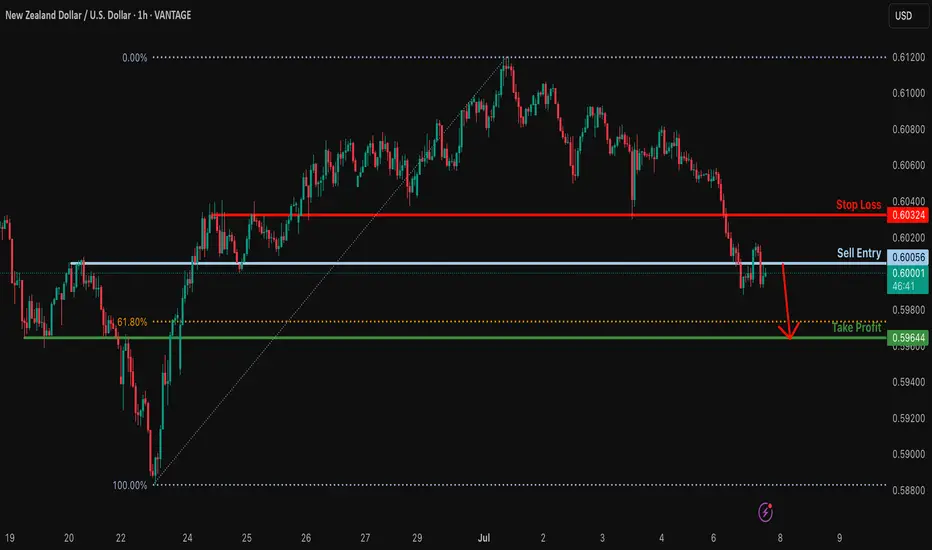
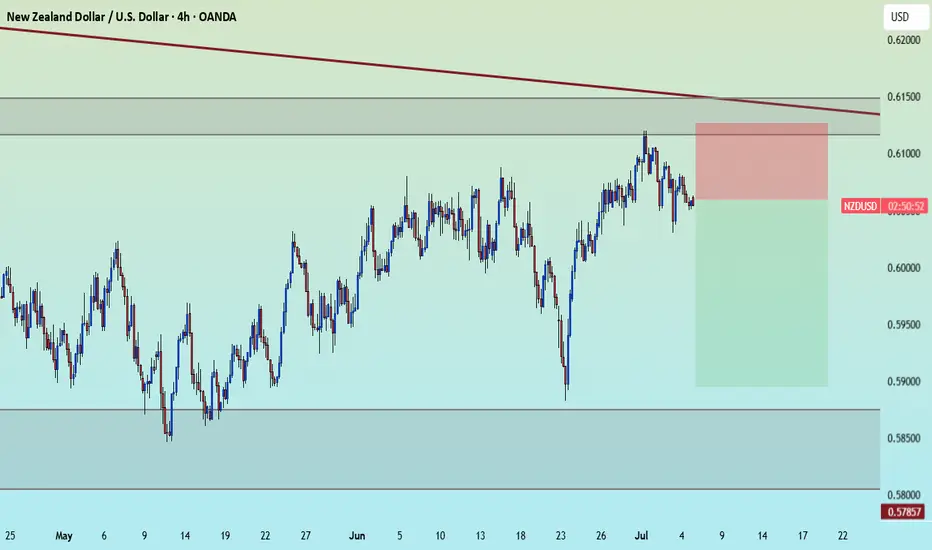
Kiwi H4 | Rising into an overlap resistanceThe Kiwi (NZD/USD) is rising towards an overlap resistance and could potentially reverse off this level to drop lower.
Sell entry is at 0.6038 which is an overlap resistance that aligns with the 38.2% Fibonacci retracement.
Stop loss is at 0.6085 which is a level that sits above the 61.8% Fibonacci retracement and an overlap resistance.
Take profit is at 0.5965 which is a pullback support that aligns closely with the 61.8% Fibonacci retracement.
High Risk Investment Warning
Trading Forex/CFDs on margin carries a high level of risk and may not be suitable for all investors. Leverage can work against you.
Stratos Markets Limited (tradu.com ):
CFDs are complex instruments and come with a high risk of losing money rapidly due to leverage. 63% of retail investor accounts lose money when trading CFDs with this provider. You should consider whether you understand how CFDs work and whether you can afford to take the high risk of losing your money.
Stratos Europe Ltd (tradu.com ):
CFDs are complex instruments and come with a high risk of losing money rapidly due to leverage. 63% of retail investor accounts lose money when trading CFDs with this provider. You should consider whether you understand how CFDs work and whether you can afford to take the high risk of losing your money.
Stratos Global LLC (tradu.com ):
Losses can exceed deposits.
Please be advised that the information presented on TradingView is provided to Tradu (‘Company’, ‘we’) by a third-party provider (‘TFA Global Pte Ltd’). Please be reminded that you are solely responsible for the trading decisions on your account. There is a very high degree of risk involved in trading. Any information and/or content is intended entirely for research, educational and informational purposes only and does not constitute investment or consultation advice or investment strategy. The information is not tailored to the investment needs of any specific person and therefore does not involve a consideration of any of the investment objectives, financial situation or needs of any viewer that may receive it. Kindly also note that past performance is not a reliable indicator of future results. Actual results may differ materially from those anticipated in forward-looking or past performance statements. We assume no liability as to the accuracy or completeness of any of the information and/or content provided herein and the Company cannot be held responsible for any omission, mistake nor for any loss or damage including without limitation to any loss of profit which may arise from reliance on any information supplied by TFA Global Pte Ltd.
The speaker(s) is neither an employee, agent nor representative of Tradu and is therefore acting independently. The opinions given are their own, constitute general market commentary, and do not constitute the opinion or advice of Tradu or any form of personal or investment advice. Tradu neither endorses nor guarantees offerings of third-party speakers, nor is Tradu responsible for the content, veracity or opinions of third-party speakers, presenters or participants.
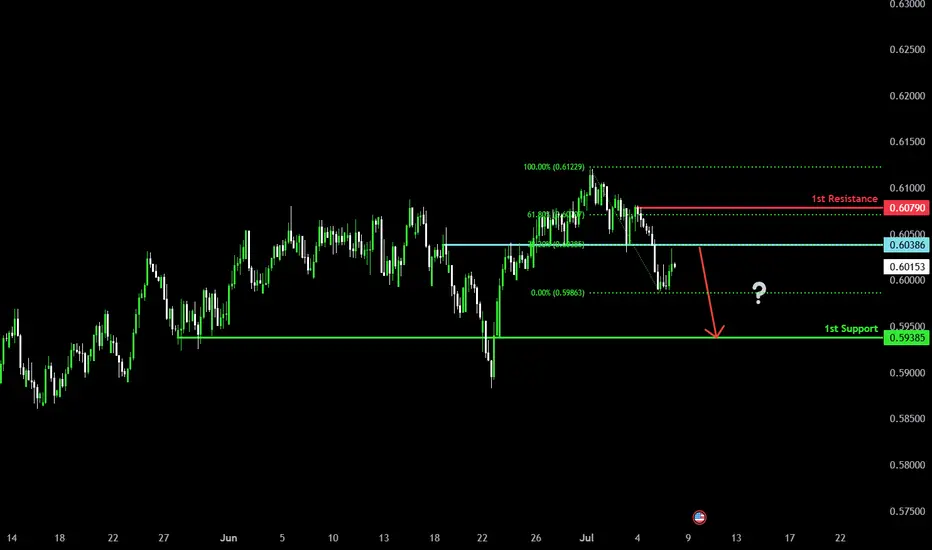
Bearish reversal for the Kiwi?The price has rejected off the pivot, which acts as an overlap resistance that lines up with the 38.2% Fibonacci retracement and could drop to the 1st support.
Pivot: 0.6038
1st Support: 0.5938
1st Resistance: 0.6079
Risk Warning:
Trading Forex and CFDs carries a high level of risk to your capital and you should only trade with money you can afford to lose. Trading Forex and CFDs may not be suitable for all investors, so please ensure that you fully understand the risks involved and seek independent advice if necessary.
Disclaimer:
The above opinions given constitute general market commentary, and do not constitute the opinion or advice of IC Markets or any form of personal or investment advice.
Any opinions, news, research, analyses, prices, other information, or links to third-party sites contained on this website are provided on an "as-is" basis, are intended only to be informative, is not an advice nor a recommendation, nor research, or a record of our trading prices, or an offer of, or solicitation for a transaction in any financial instrument and thus should not be treated as such. The information provided does not involve any specific investment objectives, financial situation and needs of any specific person who may receive it. Please be aware, that past performance is not a reliable indicator of future performance and/or results. Past Performance or Forward-looking scenarios based upon the reasonable beliefs of the third-party provider are not a guarantee of future performance. Actual results may differ materially from those anticipated in forward-looking or past performance statements. IC Markets makes no representation or warranty and assumes no liability as to the accuracy or completeness of the information provided, nor any loss arising from any investment based on a recommendation, forecast or any information supplied by any third-party.
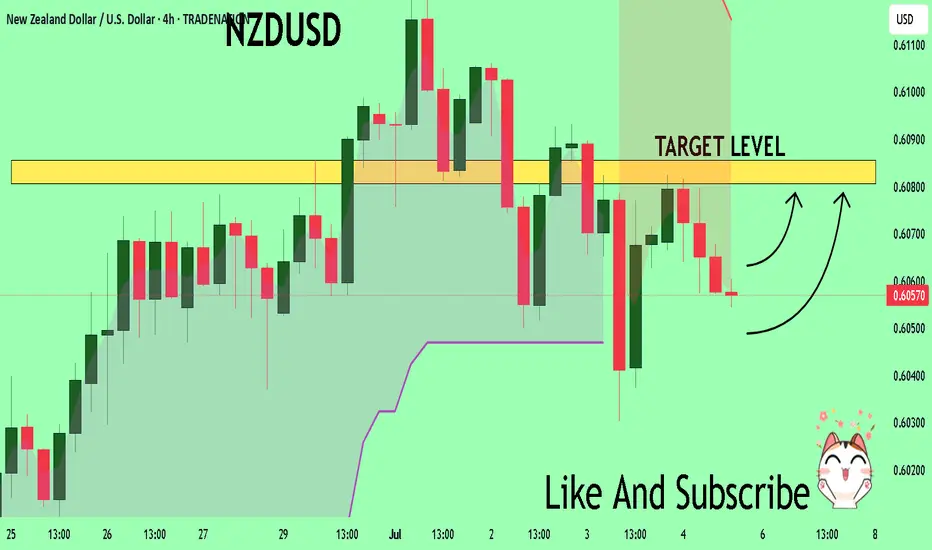
NZDUSD to find buyers at the current market price?NZDUSD - 24h expiry
The correction lower is assessed as being complete.
We expect a reversal in this move.
Risk/Reward would be poor to call a buy from current levels.
A move through 0.6025 will confirm the bullish momentum.
The measured move target is 0.6075.
We look to Buy at 0.6000 (stop at 0.5975)
Our profit targets will be 0.6050 and 0.6075
Resistance: 0.6025 / 0.6050 / 0.6075
Support: 0.6010 / 0.6000 / 0.5975
Risk Disclaimer
The trade ideas beyond this page are for informational purposes only and do not constitute investment advice or a solicitation to trade. This information is provided by Signal Centre, a third-party unaffiliated with OANDA, and is intended for general circulation only. OANDA does not guarantee the accuracy of this information and assumes no responsibilities for the information provided by the third party. The information does not take into account the specific investment objectives, financial situation, or particular needs of any particular person. You should take into account your specific investment objectives, financial situation, and particular needs before making a commitment to trade, including seeking advice from an independent financial adviser regarding the suitability of the investment, under a separate engagement, as you deem fit.
You accept that you assume all risks in independently viewing the contents and selecting a chosen strategy.
Where the research is distributed in Singapore to a person who is not an Accredited Investor, Expert Investor or an Institutional Investor, Oanda Asia Pacific Pte Ltd (“OAP“) accepts legal responsibility for the contents of the report to such persons only to the extent required by law. Singapore customers should contact OAP at 6579 8289 for matters arising from, or in connection with, the information/research distributed.
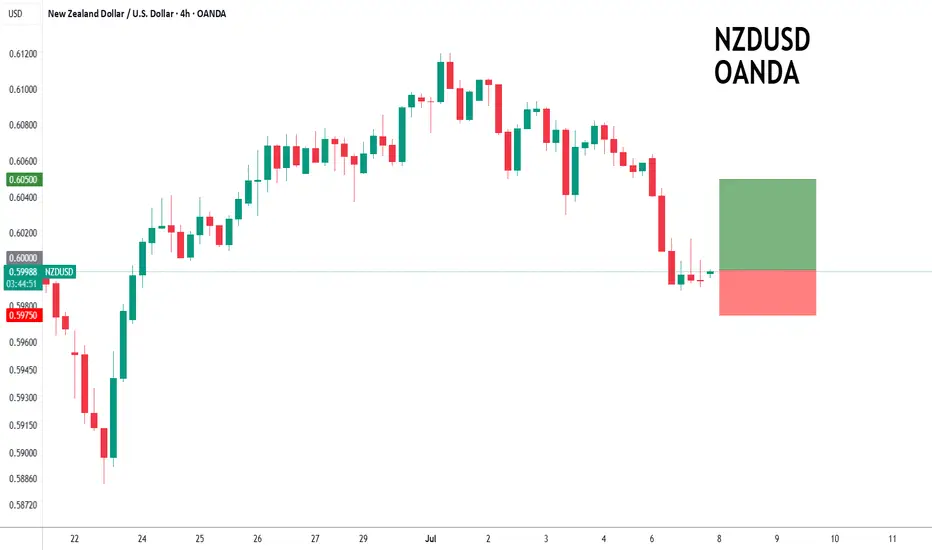
NZD/USD 2 moves away from wiping out June’s rallyThe RBNZ is widely expected to hold the Official Cash Rate at 3.25% this Wednesday.
NZIER’s Shadow Board advises against a cut, noting the economy remains weak but inflation pressures are mixed. Markets see just a 10–15% chance of a cut this week but still price for further easing by October.
NZD/USD has pulled back sharply from 0.6100, with price now possibly consolidating around 0.6000. This area coincides with a key support-turned-resistance level that capped price action in mid-June.
If the pair breaks below 0.5980, the next support sits near 0.5935 – a level that triggered a strong bounce on June 21. A break below that could open the way toward 0.5900 and 0.5860.
On the upside, if the 0.6000 handle holds, short-term resistance lies at 0.6030, with stronger pressure at 0.6065.
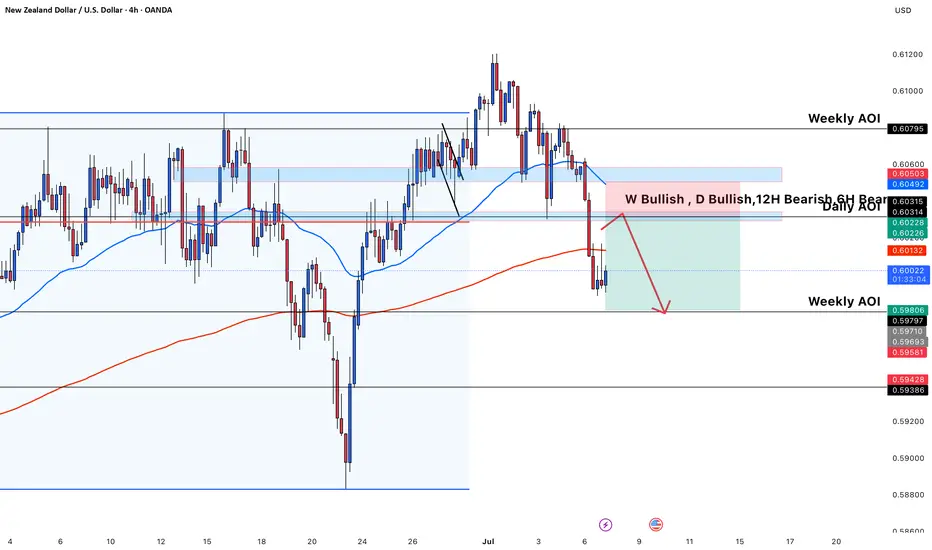
NZDUSD Clear Bearish Continuation🧠 Timeframe Sentiment Overview
Weekly (W): Bullish
Daily (D): Bullish
12H, 6H, 4H: Bearish
Bias: Weak bearish retracement inside HTF bullish trend. Caution advised—likely a counter-trend play or short-term pullback trade.
📉 Market Structure Analysis
Bearish BOS recently occurred on 4H with a sharp drop.
Red arrow forecasts a continuation lower if price respects the short-term supply zone.
📊 EMA Confluence
Price is currently below both the 50 EMA (blue) and 200 EMA (red) → indicates a bearish short-term trend.
EMAs act as dynamic resistance in the supply zone.
Risk-Reward Ratio: Approximately 2:1 or better.
🔁 Strategy Notes
Since HTF is bullish (W + D), this is a counter-trend move, so confirmation (e.g. on 1H or 15m) is important.
Text on chart suggests waiting for 1H structure shift before executing the trade for better timing and lower risk.
✅ Confluences Supporting the Short
Clear 4H BOS and bearish momentum.
Bearish EMAs alignment (50 < 200).
Price entering previous support turned resistance.
Weekly AOI (target) is a high-probability demand zone.
Bearish momentum from 12H/6H/4H despite higher TF bullishness.
⚠️ Caution
Since W and D are bullish, price could bounce aggressively from the Weekly AOI.
Monitor LTF reaction closely for exit/reversal.
Bearish continuation?The Kiwi is reacting off the resistance level which is a pullback resistance and could drop from this level to our take profit.
Entry: 0.6005
Why we like it:
There is a pullback resistance.
Stop loss: 0.6032
Why we like it:
There is an overlap resistance.
Take profit: 0.5964
Why we like it:
There is a pullback support that is slightly below the 78.6% Fibonacci retracement.
Enjoying your TradingView experience? Review us!
Please be advised that the information presented on TradingView is provided to Vantage (‘Vantage Global Limited’, ‘we’) by a third-party provider (‘Everest Fortune Group’). Please be reminded that you are solely responsible for the trading decisions on your account. There is a very high degree of risk involved in trading. Any information and/or content is intended entirely for research, educational and informational purposes only and does not constitute investment or consultation advice or investment strategy. The information is not tailored to the investment needs of any specific person and therefore does not involve a consideration of any of the investment objectives, financial situation or needs of any viewer that may receive it. Kindly also note that past performance is not a reliable indicator of future results. Actual results may differ materially from those anticipated in forward-looking or past performance statements. We assume no liability as to the accuracy or completeness of any of the information and/or content provided herein and the Company cannot be held responsible for any omission, mistake nor for any loss or damage including without limitation to any loss of profit which may arise from reliance on any information supplied by Everest Fortune Group.
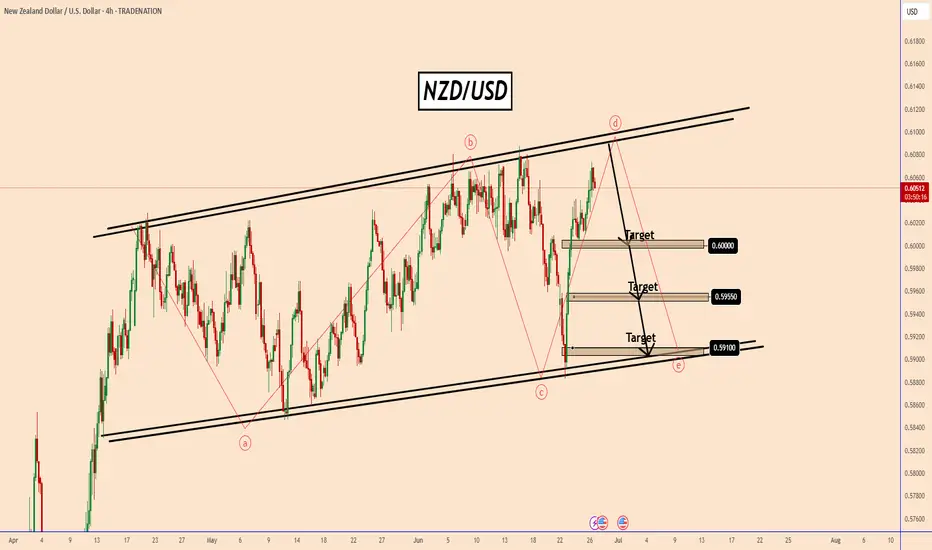
NZDUSD Inside a Large ABCDE PatternNZDUSD Inside a Large ABCDE Pattern
The US dollar is lower across the board today as President Trump may accelerate the announcement of a successor to Federal Reserve Chairman Jerome Powell, as reported by the WSJ.
Investors are wary of the lack of independence from the Federal Reserve and expect interest rates to move significantly lower.
It is strange that the market did not move up and down in a crazy way at a time when we were close to a possible World War III and it's really funny that all the charts are moving because Powell could be replaced.
We have to be careful because these are just rumors at the moment and no one can replace Powell if he doesn't want to. Otherwise, Trump would have made this decision a long time ago.
Technical Analysis:
The price is testing a strong resistance area near 0.6100 again
It looks like we are inside a larger pattern and potentially NZDUSD could move down again once these rumors disappear.
Key level zones: 0.6000, 0.5955, and 0.5910
You may find more details in the chart!
Thank you and Good Luck!
❤️PS: Please support with a like or comment if you find this analysis useful for your trading day❤️
Disclosure: I am part of Trade Nation's Influencer program and receive a monthly fee for using their TradingView charts in my analysis.
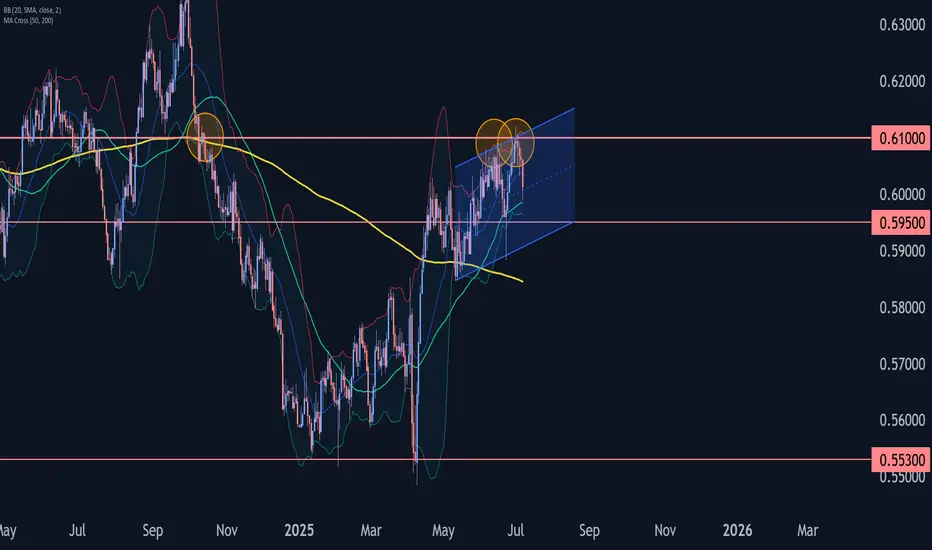
NZDUSD Wave Analysis – 7 July 2025
- NZDUSD reversed from resistance level 0.6100
- Likely to fall to support level 0.5950
NZDUSD currency pair recently reversed down from the key resistance level 0.6100 (which has been steadily reversing the price from October, as can be seen from the daily NZDUSD chart below) – intersecting with the upper daily Bollinger Band and the resistance trendline of the daily up channel from April.
The downward reversal from the resistance level 0.6100 stopped the previous medium-term impulse ABC correction (2) from the start of April.
Given the strength of the resistance level 0.6100, NZDUSD currency pair can be expected to fall to the next support level 0.5950.
NZDUSD support at 0.5980The NZDUSD remains in a bullish trend, with recent price action showing signs of a corrective pullback within the broader uptrend.
Support Zone: 0.5980 – a key level from previous consolidation. Price is currently testing or approaching this level.
A bullish rebound from 0.5980 would confirm ongoing upside momentum, with potential targets at:
0.6070 – initial resistance
0.6110 – psychological and structural level
0.6160 – extended resistance on the longer-term chart
Bearish Scenario:
A confirmed break and daily close below 0.5980 would weaken the bullish outlook and suggest deeper downside risk toward:
0.5950 – minor support
0.5920 – stronger support and potential demand zone
Outlook:
Bullish bias remains intact while the Gold holds above 0.5980. A sustained break below this level could shift momentum to the downside in the short term.
This communication is for informational purposes only and should not be viewed as any form of recommendation as to a particular course of action or as investment advice. It is not intended as an offer or solicitation for the purchase or sale of any financial instrument or as an official confirmation of any transaction. Opinions, estimates and assumptions expressed herein are made as of the date of this communication and are subject to change without notice. This communication has been prepared based upon information, including market prices, data and other information, believed to be reliable; however, Trade Nation does not warrant its completeness or accuracy. All market prices and market data contained in or attached to this communication are indicative and subject to change without notice.
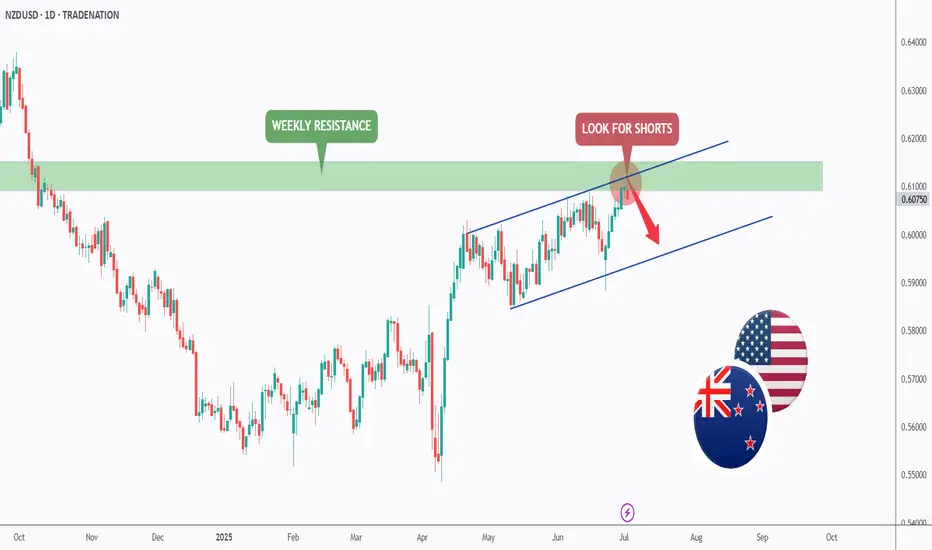
NZDUSD - The Bulls Are Exhausted! Hello TradingView Family / Fellow Traders. This is Richard, also known as theSignalyst.
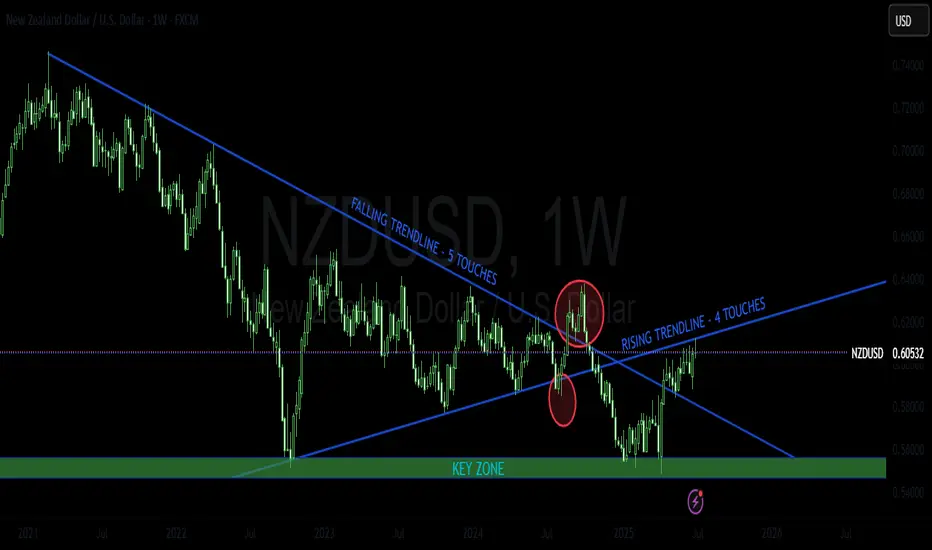
📈NZDUSD has been overall bullish trading within the rising channel marked in blue and it is currently retesting the upper bound of it.
Moreover, the green zone is a strong weekly resistance.
🏹 Thus, the highlighted red circle is a strong area to look for sell setups as it is the intersection of the upper blue trendline and green resistance.
📚 As per my trading style:
As #NZDUSD is hovering around the red circle zone, I will be looking for bearish reversal setups (like a double top pattern, trendline break , and so on...)
📚 Always follow your trading plan regarding entry, risk management, and trade management.
Good luck!
All Strategies Are Good; If Managed Properly!
~Rich
Disclosure: I am part of Trade Nation's Influencer program and receive a monthly fee for using their TradingView charts in my analysis.
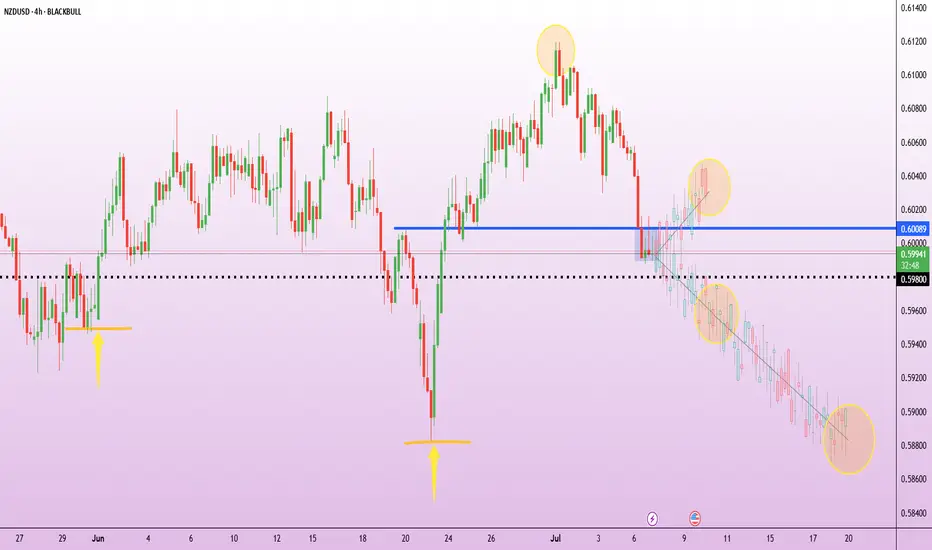
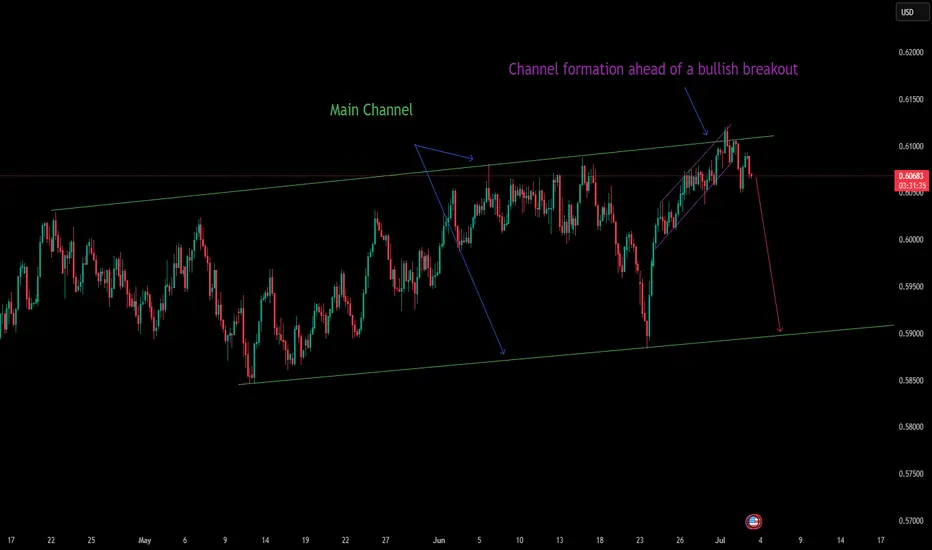
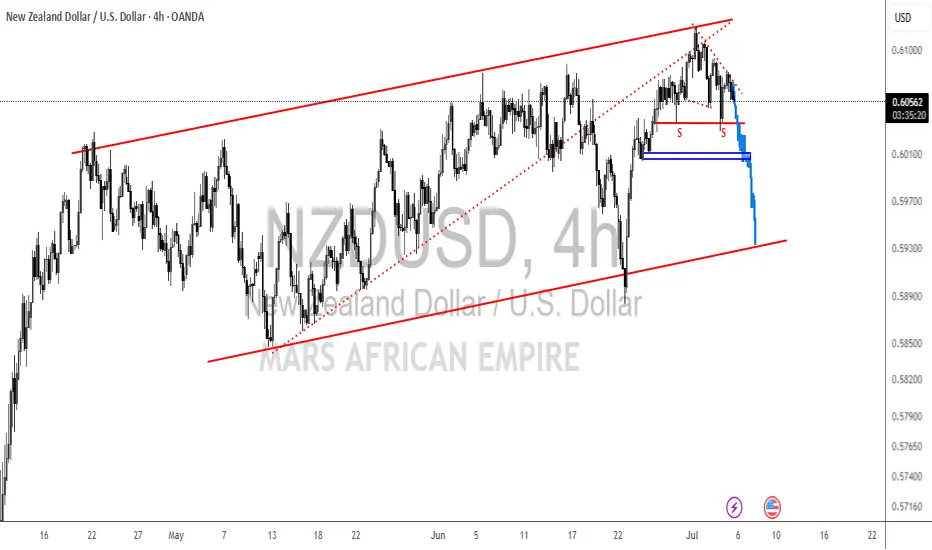
A fall is on the horizon — watch out!OANDA:NZDUSD
Channel breakout confirmed, with sellers showing interest.
The price is now ideal for shorts — I’m jumping in.
NZDUSD Trade Idea. Key Levels for a Potential NZD/USD Short📉 NZD/USD is trending strongly bearish, and I’ve just posted a new breakdown on TradingView 🎥. The current price action looks overextended, and the pair remains under heavy selling pressure 🔻.
I’m watching for a potential retracement into the Fibonacci 50%–61.8% zone 🔄 — the equilibrium area where I’ll be eyeing a possible short entry 🎯.
The video covers entry ideas, stop-loss placement, and target levels 🎯📍.
⚠️ This is not financial advice — for educational purposes only.

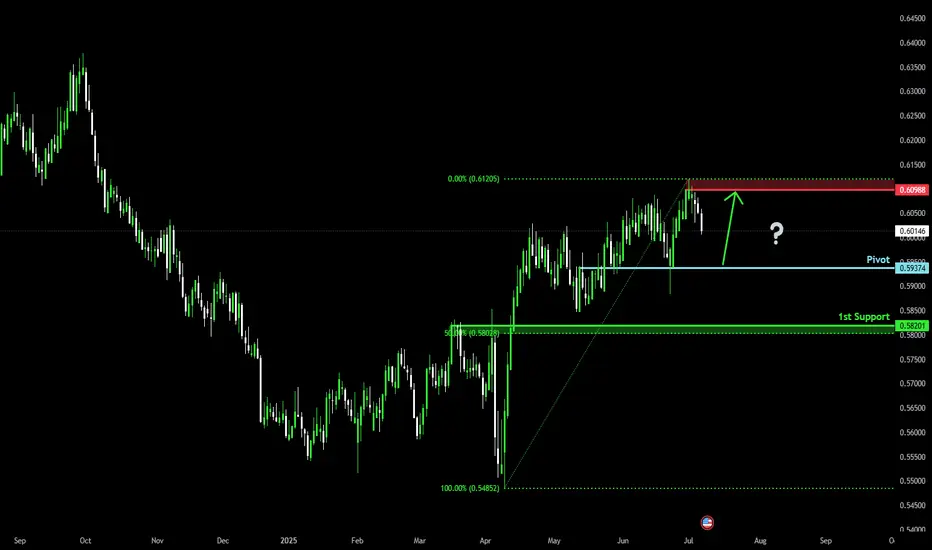
Bullish bounce?The Kiwi (NZD/USD) is falling towards the pivot and could bounce to the 1st support which has been identified as a pullback support.
Pivot: 0.5937
1st Support: 0.5820
1st Resistance: 0.6098
Risk Warning:
Trading Forex and CFDs carries a high level of risk to your capital and you should only trade with money you can afford to lose. Trading Forex and CFDs may not be suitable for all investors, so please ensure that you fully understand the risks involved and seek independent advice if necessary.
Disclaimer:
The above opinions given constitute general market commentary, and do not constitute the opinion or advice of IC Markets or any form of personal or investment advice.
Any opinions, news, research, analyses, prices, other information, or links to third-party sites contained on this website are provided on an "as-is" basis, are intended only to be informative, is not an advice nor a recommendation, nor research, or a record of our trading prices, or an offer of, or solicitation for a transaction in any financial instrument and thus should not be treated as such. The information provided does not involve any specific investment objectives, financial situation and needs of any specific person who may receive it. Please be aware, that past performance is not a reliable indicator of future performance and/or results. Past Performance or Forward-looking scenarios based upon the reasonable beliefs of the third-party provider are not a guarantee of future performance. Actual results may differ materially from those anticipated in forward-looking or past performance statements. IC Markets makes no representation or warranty and assumes no liability as to the accuracy or completeness of the information provided, nor any loss arising from any investment based on a recommendation, forecast or any information supplied by any third-party.
NZDUSD H4 ShortIt's a Down trend in the Weekly price under 200 EMA, Pin Par in the weekly time fram. strong Resistant to break to the upside.
NZDUSD - GLOBAL NEUTRAL VIEWLooking at classic trendline trading, the pair is trading between 2 strong trendline confluence areas. Looking at past movements, the pair completed both bull and bear traps. My view on this is to wait and see what will unfold in the coming weeks.
Please do your own analysis before placing any trades.
Cheers and Happy Trading !!!!
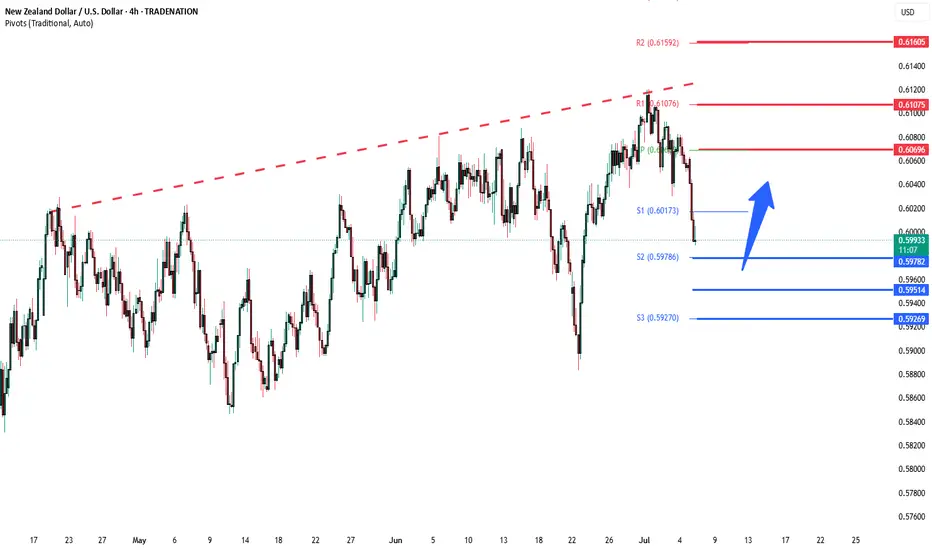
NZDUSD The Target Is UP! BUY!
My dear subscribers,
This is my opinion on the NZDUSD next move:
The instrument tests an important psychological level 0.6056
Bias - Bullish
Technical Indicators: Supper Trend gives a precise Bullish signal, while Pivot Point HL predicts price changes and potential reversals in the market.
Target - 0.6080
About Used Indicators:
On the subsequent day, trading above the pivot point is thought to indicate ongoing bullish sentiment, while trading below the pivot point indicates bearish sentiment.
Disclosure: I am part of Trade Nation's Influencer program and receive a monthly fee for using their TradingView charts in my analysis.
———————————
WISH YOU ALL LUCK
A huge FallThis pair is showing signs of reversal on that trend zone, we might see it continue to push down even more
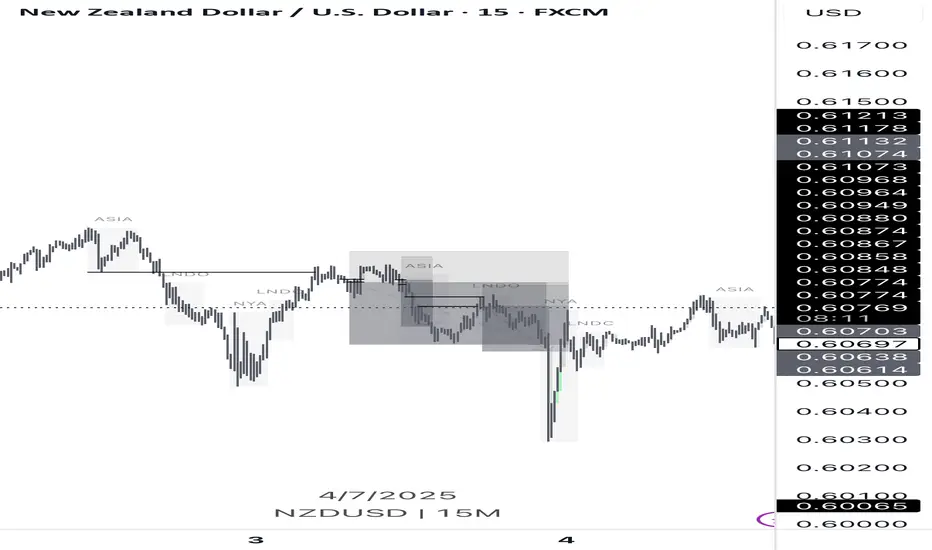
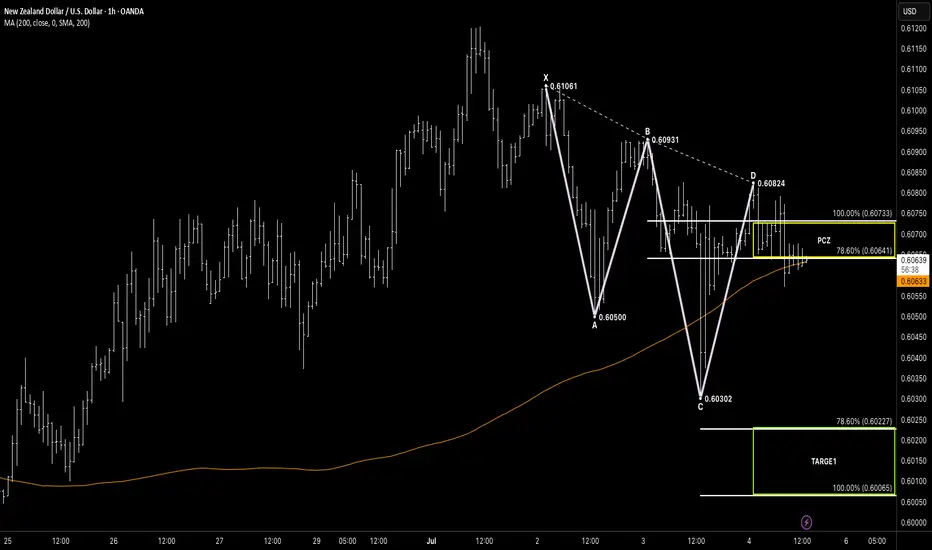
121Hello awesome traders! 👑✨
Hope you’ve enjoyed your trading week and caught some pips along the way! As we wrap up Friday, let’s spotlight NZD/USD (1H)—we’ve got a clean 121 Bearish Reversal forming on the hourly chart.
🧠 Setup Breakdown:
Price has built the 121 structure:
XA: 0.61061 → 0.60500
AB: 0.60500 → 0.60931
BC: 0.60931 → 0.60302
The Potential Completion Zone (PCZ) sits between:
78.6% BC retracement: 0.60641
100% XA extension: 0.60733
Price rallied into the PCZ, tagged D = 0.60824, and has since shown early signs of rejection under 0.60733.
🎯 Target in Sight:
TP1 Zone: 0.60065–0.60227 (100%–78.6% extension of BC)
Our playbook: Pattern → PCZ → Rejection → Measured Target. Risk is defined above D = 0.60824, with entry on a clear bearish candle close below 0.60641.
💡 What’s Next?
Entry: Short on bearish candle close < 0.60641 (lower PCZ boundary).
Stop: Above 0.60824 (just above D).
Take Profit: Scale into 0.60227–0.60065.
If price breaks back above 0.60733, we’ll stand aside and wait for the next high-probability setup.
Finish the week strong—stay disciplined, manage your risk like a pro, and let structure guide your decisions!
📊 Trade patterns like the pros.
📈 Let structure, not emotion, drive your trades.
— Your Friendly Harmonic Trading Guide
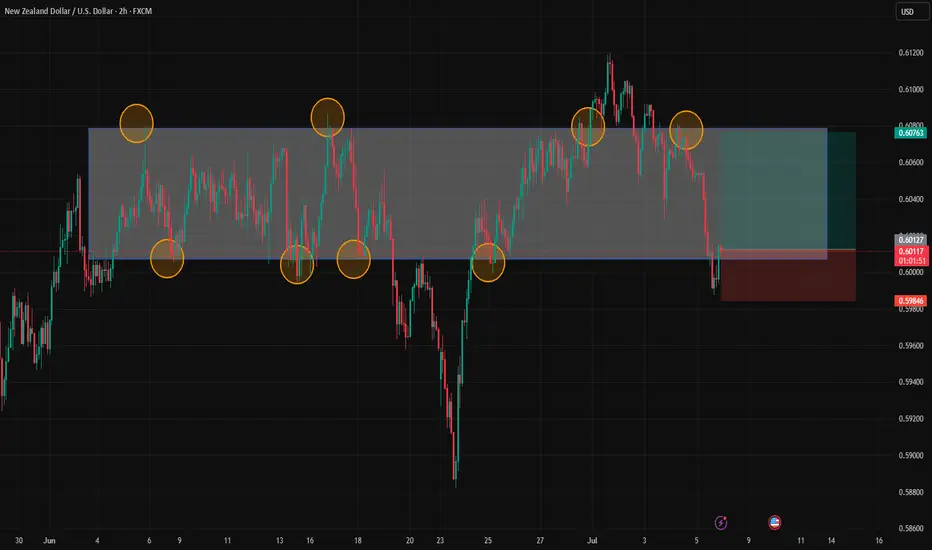
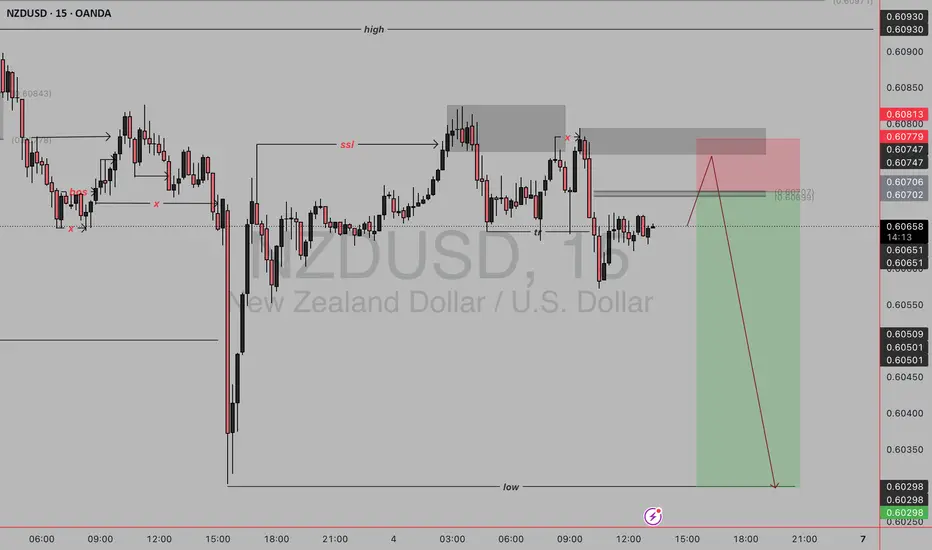
nzdusd sell entrySweep of liquidity above recent highs (SSL).
Return to a supply zone (gray box).
Fibonacci confluence around 0.618 level.
Expectation: Price will reject the zone and target previous low around 0.60298.
Bearish Confirmation Signals to Watch:
Rejection candles (wicks) at the red zone.
Bearish engulfing patterns or strong bearish candles.
Momentum divergence (e.g., RSI showing lower highs while price makes higher highs).
Volume drop after the sweep.
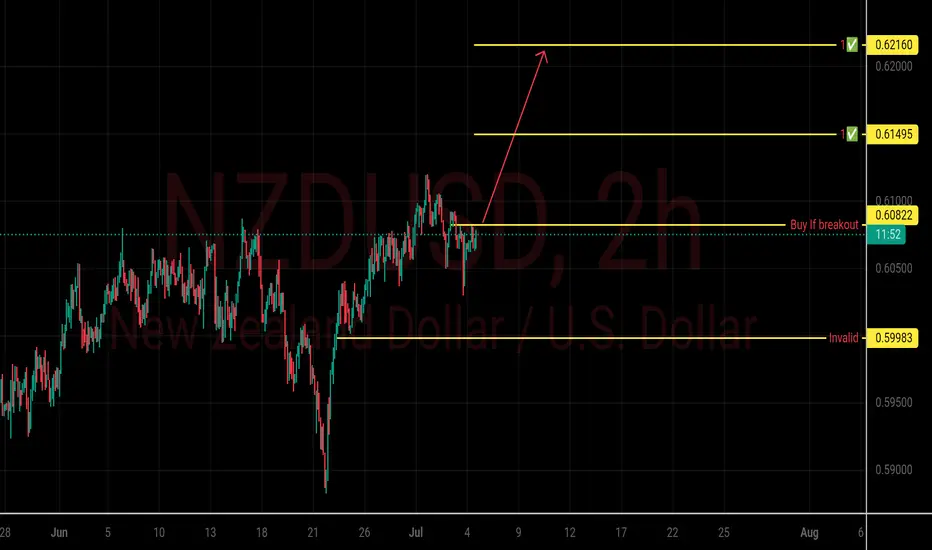
NZDUSD Buy Setup✅ Key Levels:
Buy if Breakout: 0.60822
Invalidation (Stop Loss): 0.59983
Target 1 (TP1): 0.61495
Target 2 (TP2): 0.62160
---
🔍 Analysis Summary:
Breakout Setup: Price is approaching the resistance level at 0.60822. A confirmed breakout above this level signals a potential bullish move.
Trend: Uptrend continuation expected if price holds above the breakout level.
Invalidation Point: If price breaks below 0.59983, the setup becomes invalid, suggesting bearish pressure resumes.
Targets:
First take profit at 0.61495 (safe/partial profit-taking zone)
Second take profit at 0.62160 (full target if momentum sustains)
---
⚠️ Disclaimer:
This is a technical analysis and not financial advice. Always combine with your own research and risk management strategy.
NZDUSD clapping cheeksit was such a good trade forex is so sexy hopefully this is enough words for the description