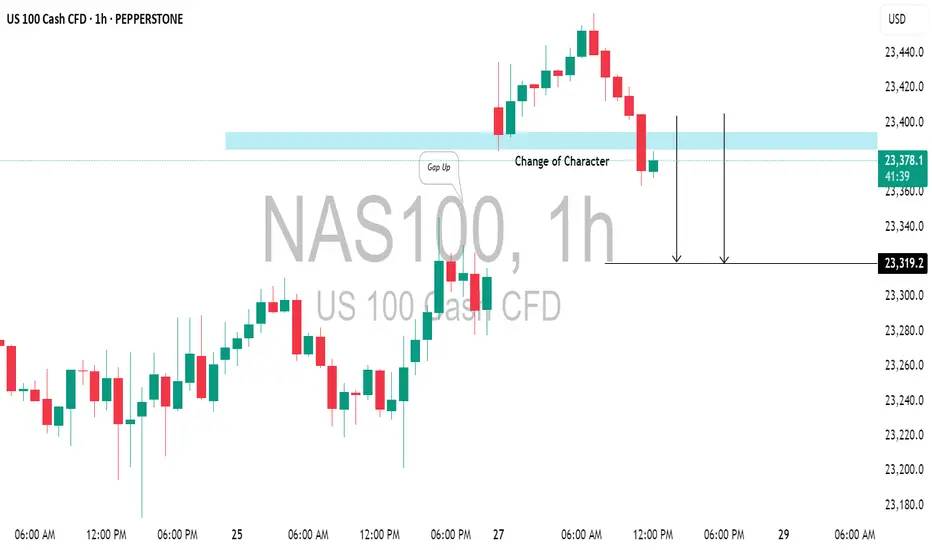
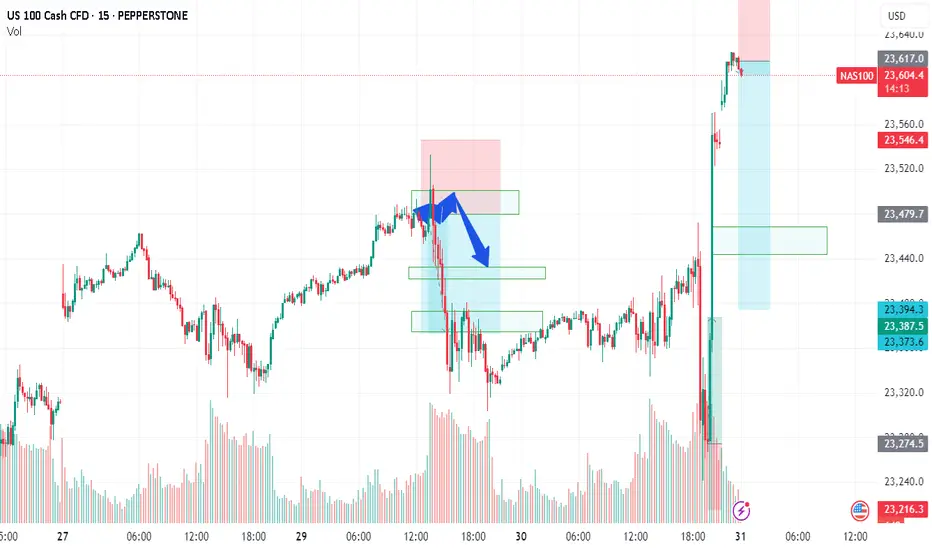
NASDAQ INDEX (US100): Another Gap For Today?I anticipate another gap up opening on the 📉US100 Index, which I believe will be filled today.
The formation of an intraday bearish change of character(CHOCH) on the hourly chart
This indicates a strong likelihood of continued bearish movement, with a target of 23319.
NAS100USD trade ideas
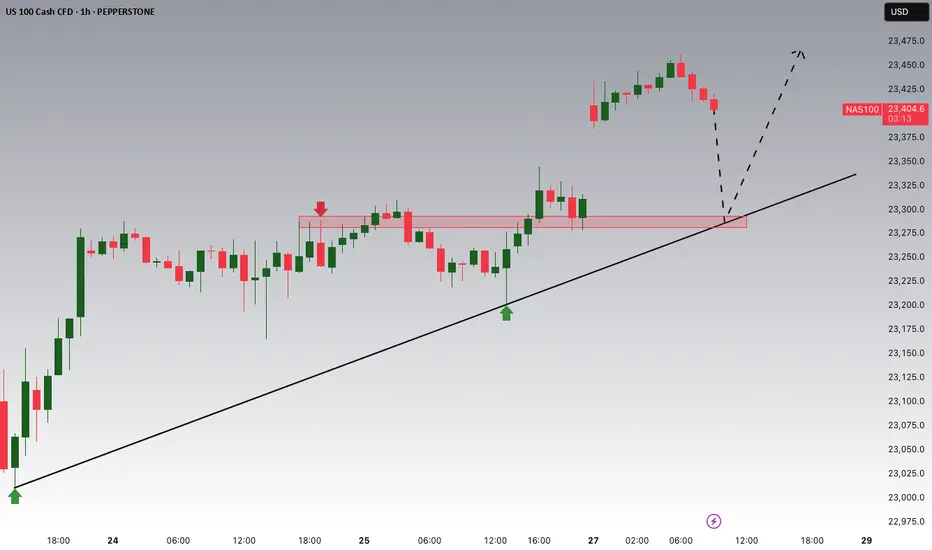
NASDAQ Potential UpsidesHey Traders, in today's trading session we are monitoring NAS100 for a buying opportunity around 23,300 zone, NASDAQ is trading in an uptrend and currently is in a correction phase in which it is approaching the trend at 23,300 support and resistance area.
Trade safe, Joe.
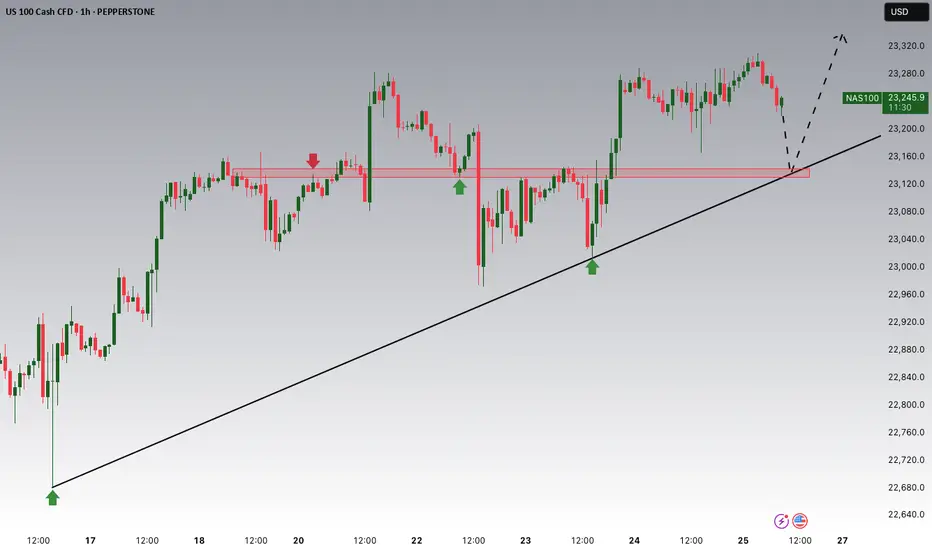
NASDAQ Potential UpsidesHey Traders, in today's trading session we are monitoring NAS100 for a buying opportunity around 23,140 zone, NASDAQ is trading in an uptrend and currently is in a correction phase in which it is approaching the trend 23,140 support and resistance area.
Trade safe, Joe.
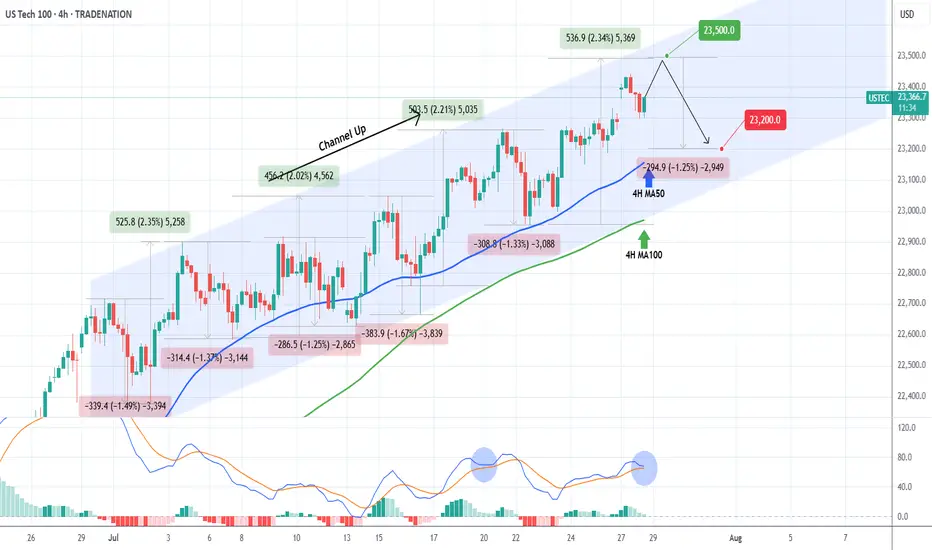
NASDAQ Channel Up to be rejected soon.Nasdaq (NDX) has been trading within a Channel Up since the start of the month. The primary Support level has been the 4H MA50 (blue trend-line), which hasn't closed a 4H candle below it since July 14.
Right now the index is on its latest Bullish Leg, which can technically extend by +2.35% (max such Leg within the Channel Up).
We expect a rejection targeting the 4H MA50 again at 23200, which would represent a -1.25% decline, the weakest such Bearish Leg we had within the Channel Up.
-------------------------------------------------------------------------------
** Please LIKE 👍, FOLLOW ✅, SHARE 🙌 and COMMENT ✍ if you enjoy this idea! Also share your ideas and charts in the comments section below! This is best way to keep it relevant, support us, keep the content here free and allow the idea to reach as many people as possible. **
-------------------------------------------------------------------------------
Disclosure: I am part of Trade Nation's Influencer program and receive a monthly fee for using their TradingView charts in my analysis.
💸💸💸💸💸💸
👇 👇 👇 👇 👇 👇
CASH100 (NASDAQ) CRASH - Head and shoulders Risk/reward = 3.7
Entry price = 23 430
Stop loss price = 23 503.2
Take profit level 1 (50%) = 23 202
Take profit level 2 (50%) = 23 099
Still waiting for some variables to confirm before entering the trade
NAS100 - Update Dear Friends in Trading,
How I see it,
I will be waiting for a clear and decisive break below the PIVOT.
Keynote:
I am not trading NASDAQ at all...just monitoring patiently!!
I will keep you in the loop as the stock market progress...
I sincerely hope my point of view offers a valued insight
Thank you for taking the time study my analysis.
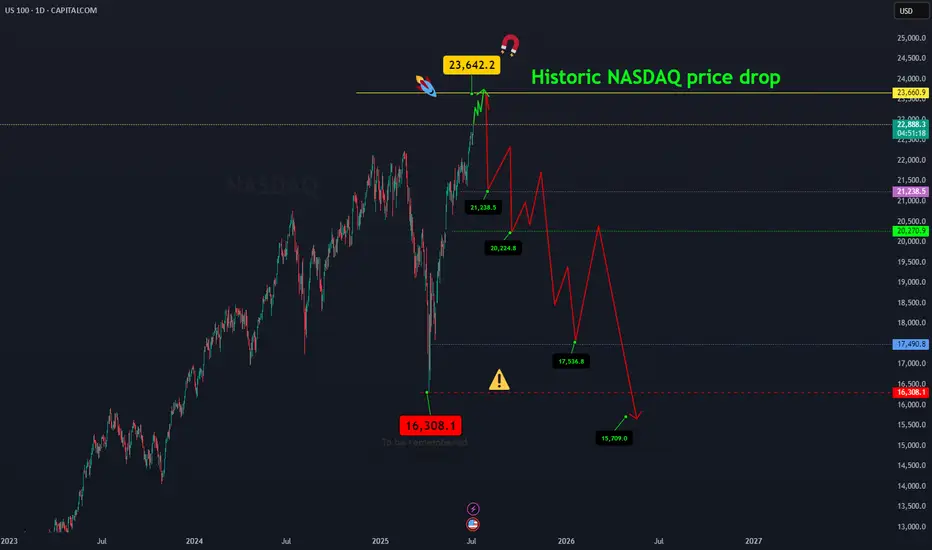
NASDAQ price dropAfter the Nasdaq price reaches around 23642.2, a historic drop will occur and the target is to drop to 16308.
Whatever happens at the highest price, the final destination is towards 16308.
I have identified the price levels in the middle of this expected drop that can cause the price to correct.
IG:NASDAQ
NAS - LET'S MAKE MILLIONS Team, last night NAS I was expect the FALL BACK as I predicted rate un-change will get NASTY on both DOW AND NAS.
So I have a set up entry LONG, i didnt expect the NAS flying to the moon.
both target hit so fast in 15 minutes
However, today is another opportunity to SHORT NAS on the current market at 23613-23625
STOP LOSS AT 23720
Once the NAS pull back toward 23580-65 - BRING STOP LOSS TO BE
TARGET 1: at 23540-20
TARGET 2: at 23480-65
LETS GO
NASDAQ (CASH100) SHORT - Double top H6Risk/reward = 4
Entry price = 23 463.1
Stop loss price = 23 534.2
Take profit level 1 (50%) = 23 169
Take profit level 2 (50%) = 23 169
All variables met. Now just need price to reach entry level and close back within range.
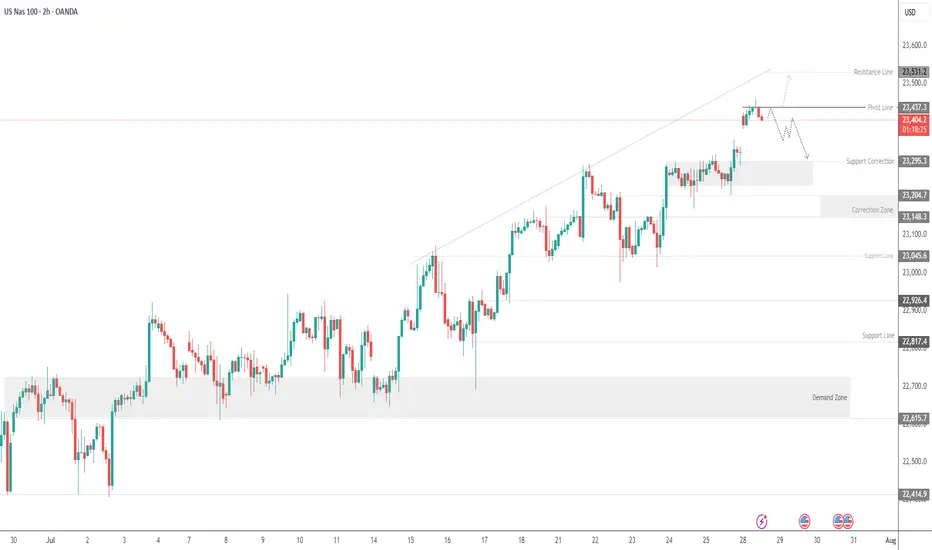
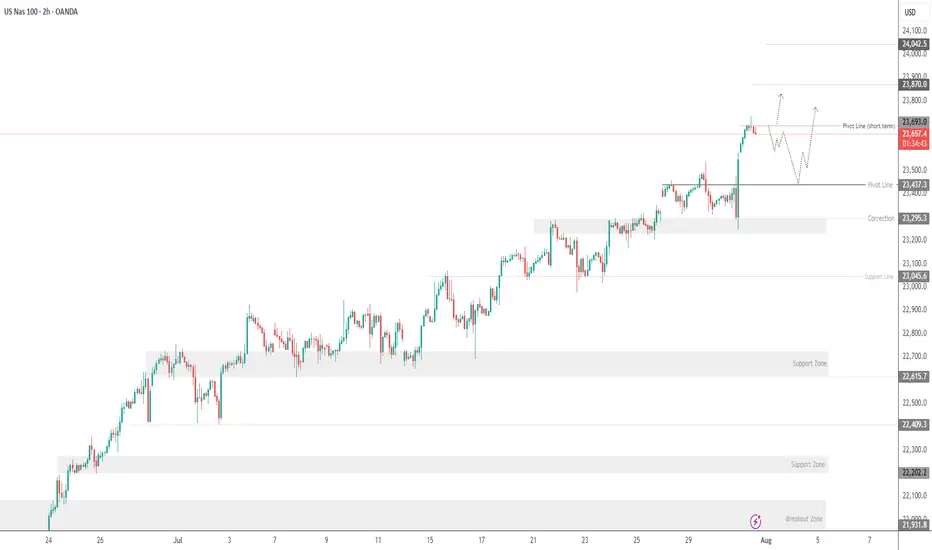
USNAS100 Correction in Play – Watching 23390 & 23440USNAS100
The price is undergoing a bearish correction while trading below 23440, with downside targets at 23300 and 23295, especially if a 1H candle closes below 23390.
A bullish scenario will be activated if price closes 1H above 23440, opening the path toward 23530 and potentially 23700.
At the moment, the market appears to be correcting toward 23295 before attempting a bullish rebound.
Support Levels: 23300 – 23210 – 23150
Resistance Levels: 23530 – 23700
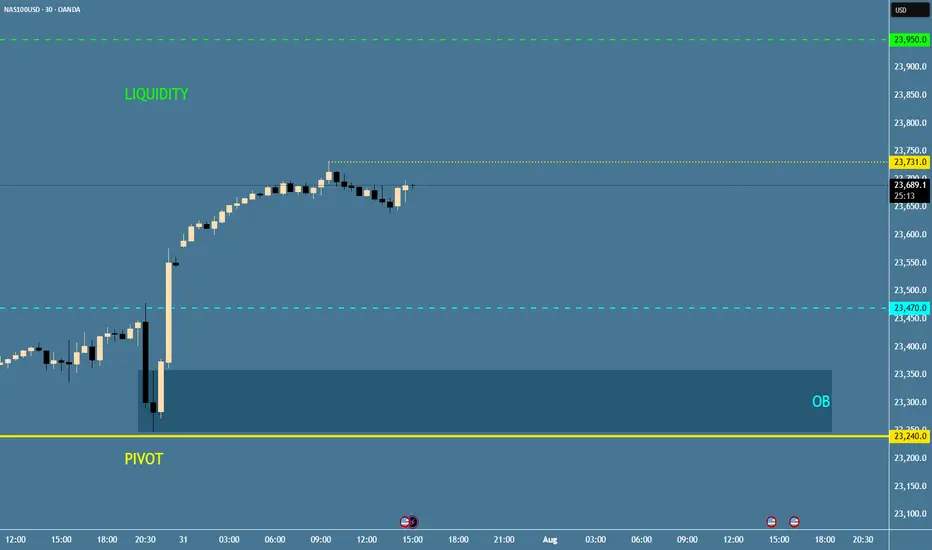
NAS100 Trade Idea: Liquidity Sweep & Bullish Reversal Potential📊 NASDAQ 100 (NAS100) Trade Outlook 📈
The NASDAQ 100 is holding a strong bullish trend on the higher timeframes 🟢. However, we’re currently seeing a notable pullback into a key support zone ⚠️ — price has dipped beneath previous lows, tapping into what appears to be an institutional accumulation range 🏦.
This move is likely targeting the liquidity resting below those lows 💧, where sell stops are positioned. Price is also reacting off a significant bullish order block 🧱 — a confluence area that could produce a strong reversal.
🎯 What to look for next:
Wait for a bullish break in market structure 🔁 to confirm a potential entry. If that occurs, consider a long setup with your stop loss below the swing low 🛑 and a 1:2 risk-to-reward target 🎯.
🚫 This is for educational purposes only and not financial advice.

Nasdaq Short: multiple reasonsOver here, I present to you the Nasdaq short idea again. For my previous idea, it was stopped out at 23500. This time, I changed the wave counts again, mainly merging the previous wave 5 into wave 3, allowing for the new high to be a wave 5.
On top of that, here are the few other reasons for the short:
1. Fibonacci extension levels: Wave 5 is slightly more than Wave 1.
2. RSI overbought for the 3rd time on the hourly timeframe.
3. Rising wedge false breakout.
4. Head-and-shoulders on the 1-min timeframe.
As usual, the stop for this idea is slightly above the recent high, around 23700.
Thank you.

NASDAQ LONG NOWDaily break of structure provided me a view of the daily support at 22,960.
My entry is also supported by the 50-MA at the left chart. Im targeting 23,800 with 1:6 risk reward.
NAS - TIME FOR JUICYTeam, hope you all making a killing on SHORT tonight.
as we expected. Thank you for asking and be patience
TIME TO MAKE NAS100 GREAT AGAIN.
Sorry my entry was 23240, but now the market is 23332
you should entry small volume at the current price 23332 - if a little pull back below 23300 add more
STOP LOSS at 23230-50
TARGET 1 at 23385-23400
TARGET 2 at 23475-23515
LETS go - time to make ACTIVE TRADER ROOM GREAT AGAIN.!
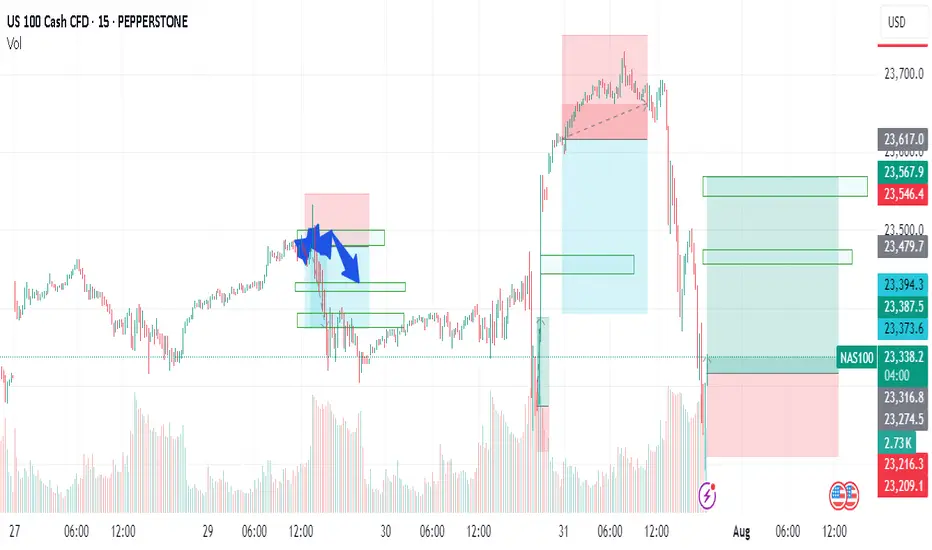
NAS100 shortElite analysis
Confirmed the entire checklist
Targeting lower liquidity pools.
Main Target NY Low.
This was confirmed from Daily all the way down to 1m.
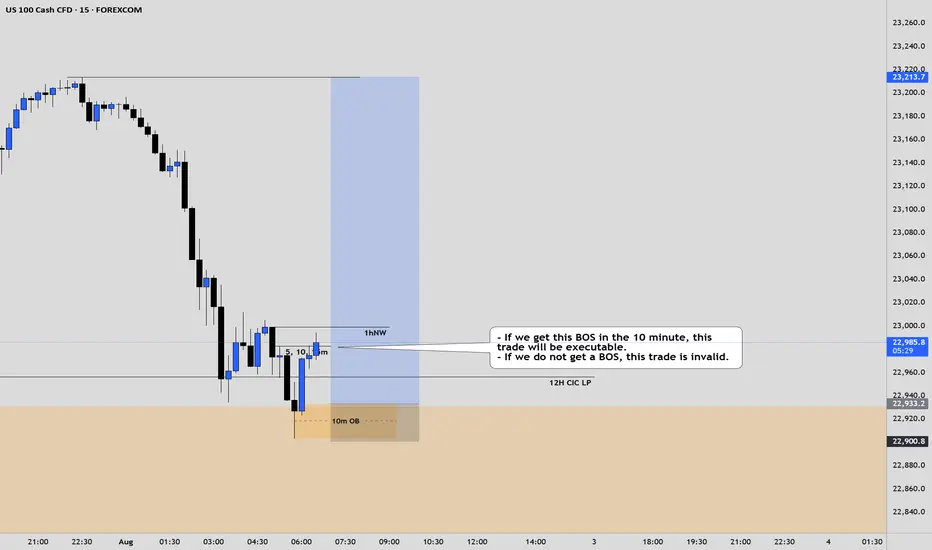
NAS100 LongElite Analysis
This analysis is not executable ONLY UNTIL we get a BOS on the 10m time frame.
(Potential BOS is identified on chart)
Once we get the BOS, we execute from the 10m OB.
Targeting upper liquidity pools.
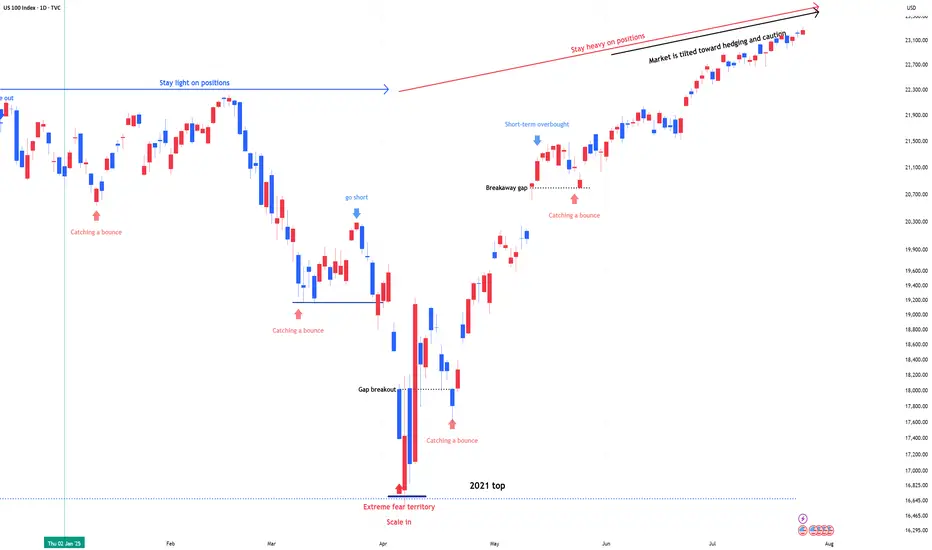
NDX & SPX , Stay heavy on positionsNDX & SPX , Stay heavy on positions (QLD, TQQQ)
Market sentiment is currently tilted toward betting on downside volatility, which ironically supports the case for the stock market to continue its upward trend.
The Markets, the Rabbi and the Goat...It’s funny how sometimes markets react like people in old jokes…
They scream when things get bad, then cheer wildly when things return to how they were — as if something amazing just happened.
Let me tell you one of those jokes.
It’s about a house, a rabbi… and a goat.
A man goes to the Rabbi:
“Rabbi, my house is too small. The kids are screaming, my wife’s yelling, I’m losing my mind!”
The Rabbi calmly replies:
“Bring in the chicken.”
Two days later:
“Rabbi, it’s worse!”
Rabbi:
“Now bring in the duck.
Then the pig.
And finally… the goat."
Now the house is in complete chaos. Smell, noise, no space to move or breathe.
The man returns, ready to break down:
“Rabbi, this is hell!”
The Rabbi smiles:
“Now take them all out.”
A few days later, the man comes back glowing:
“Rabbi… it’s incredible! So much space! So quiet! So fresh!”
📉 Now, 2025 markets
In April, Trump imposed tariffs.
Markets fall sharply. Analysts scream recession. Headlines go full drama.
Recently, “brand new deals” have been announced.
Markets explode to new all-time highs.
Applause. Celebration. “Stability is back.”
But if you read the fine print…
The deal is basically the same old deal. Renegotiated. Repackaged.
Just without the goat.

Top in Place? NASDAQ100 Signals Exhaustion After Incredible Run📈 The crazy run since April
NASDAQ100 has had a spectacular run since early April, when the index dipped to 16,300 amid rising tensions caused by Trump’s tax war. From that low, we’ve seen a mind-blowing rally of over 7,000 points, which translates to a 40% gain in just 4 months.
Such a rise is not just impressive— it’s overextended , especially by historical standards. Markets don’t move in straight lines forever, and this one might be showing signs of fatigue.
🕯️ Bearish signal at the top
Fast forward to this week: yesterday, the index marked a new all-time high at 23,700, but closed the day with a strong bearish engulfing candle — one that wipes out the gains of the previous 4 trading sessions.
This is not a small technical detail. Such candles, when appearing after an extended rally, often signal exhaustion and a potential shift in momentum.
❗ Top in place?
In my opinion, there's a high probability that a top has been set, at least temporarily. We might be looking at the beginning of a healthy correction, or even something more meaningful, depending on follow-through in the next sessions.
📉 Where to next?
The first major support to watch is the 22,200 level.
I expect that zone to be tested soon — and honestly, considering how much the index has gone up, this shouldn’t surprise anyone. It’s nothing more than a minor pullback, all things considered.
🧠 Stay smart!
When markets go vertical, it pays to stay disciplined and realistic. Tops rarely announce themselves, but when signals like this appear, it’s wise to listen.
Disclosure: I am part of TradeNation's Influencer program and receive a monthly fee for using their TradingView charts in my analyses and educational articles.

USNAS100 New ATH, looks a Correction...Wall Street Indices Hit Record Highs as AI Momentum Builds
Indices tied to the S&P 500 and Nasdaq reached fresh all-time highs on Thursday, driven by strong earnings reports from Meta and Microsoft. The results reinforced investor optimism that AI investments are delivering tangible returns and fueling future growth.
Meanwhile, Fed Chair Jerome Powell noted it's still too early to predict a rate cut in September, emphasizing that current monetary policy is not constraining economic activity. His comments followed a stronger-than-expected Q2 GDP reading, further supporting the Fed’s cautious stance.
Technical Outlook – USNAS100
After reaching recent highs, the index appears to be entering a corrective phase. A pullback toward 23470 is likely, with bullish momentum expected to resume if the price stabilizes above 23440. A sustained move above that level would target a new ATH near 23870.
However, a break below 23440 could trigger a deeper correction toward 23295.
Support: 23540 • 23440 • 23295
Resistance: 23870 • 24040
Nasdaq Short: Catching a rising knife. Stop loss at 23500.Hi everyone, here I am trying to catch the peak of Nasdaq again. As mentioned, the previous idea was stopped out at 23,320. Now, for this idea, I am attempting another short with a 30 points risk for Nasdaq. The stop for this idea is fixed at 23,500. The take profit is 22,650.
This is a positional trade and I will re-evaluate as the waves unfolds. So the strategy will mainly be trailing the stop periodically.
Thank you and good luck!

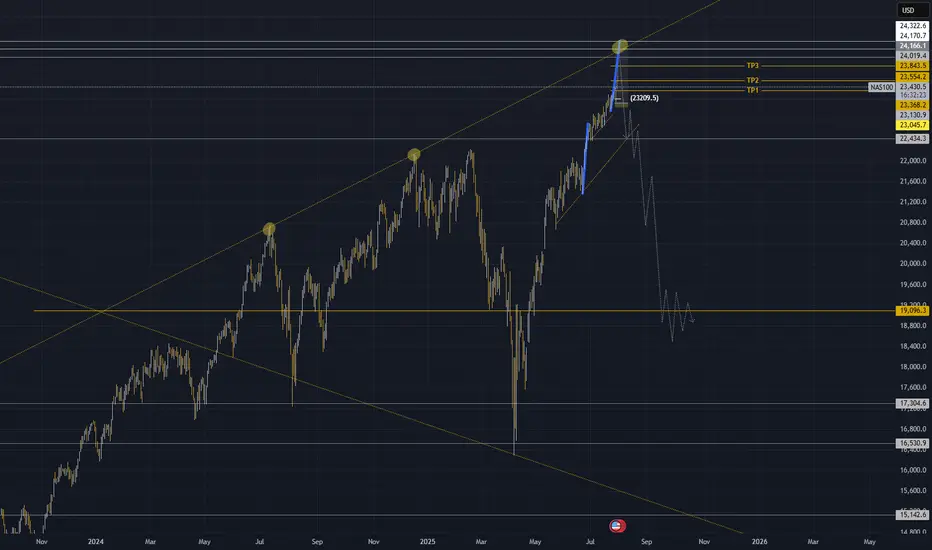
NAS100 Technical Outlook — Final Impulse Before the Fall?
The NAS100 has just completed its 5th touch on a long-term ascending trendline, forming a clear rising wedge pattern. Historically, each touch of this structure has triggered significant bearish reversals — and this time looks no different.
🔹 However, before the major drop, I'm expecting a final impulsive wave of around 1,000 pips— a last bullish move that could stretch toward the 24,300–24,400 zone. This would complete the wave structure and offer a strong sell opportunity.
🔻 After that, a deeper correction is likely, targeting the 19,000 area, which aligns perfectly with:
The midpoint of the wedge on the daily chart
A strong historical support zone
A potential area for medium-term consolidation
⚠️ As long as price remains below 24,400, the bearish scenario remains valid. Any daily close above that level would force a re-evaluation.
🧠 This setup reflects a classic distribution phase followed by a high-probability breakdown.
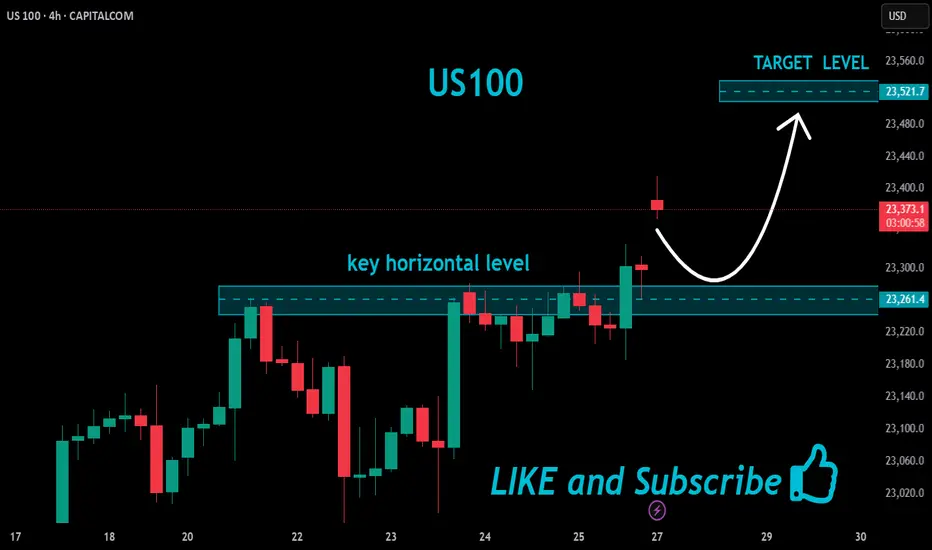
US100 Bullish Breakout!
HI,Traders !
#US100 is trading in a strong
Uptrend and the price made a
Bullish breakout of the key
Horizontal level of 23261.4
So we are bullish biased
And we will be expecting a
Further bullish move up !
Comment and subscribe to help us grow !