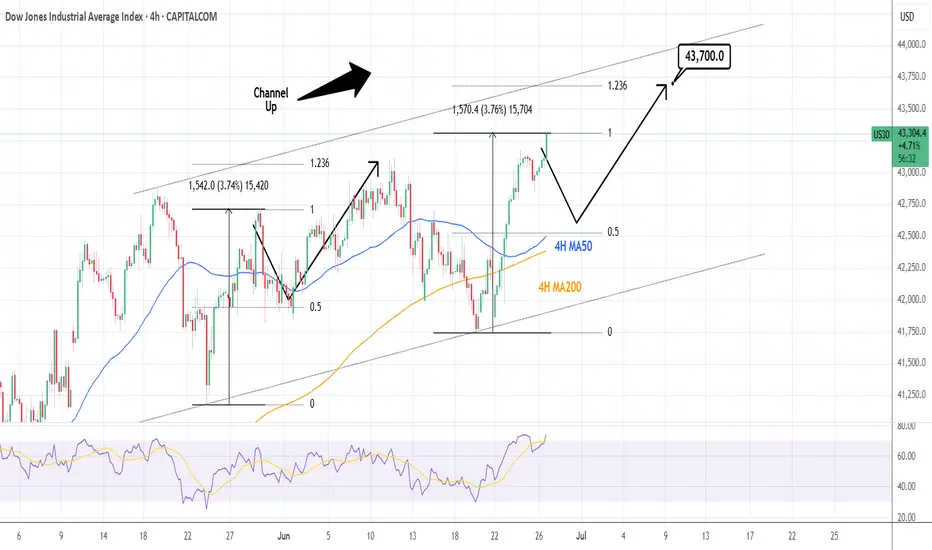
DOW JONES: Technical pullback possible but 43,700 target remainsDow Jones is bullish on its 1D technical outlook (RSI = 62.550, MACD = 276.720, ADX = 11.070), extending the bullish wave of the 1 month Channel Up. This is only the second such wave of this pattern and its first pulled back to the 0.5 Fiboancci retracement level after making a +3.75% rise. It is possible to see such a retrace start either now or tomorrow but on the medium term the bullish target on the 1.236 Fibonacci extension is intact (TP = 43,700).
## If you like our free content follow our profile to get more daily ideas. ##
## Comments and likes are greatly appreciated. ##
US30USD trade ideas
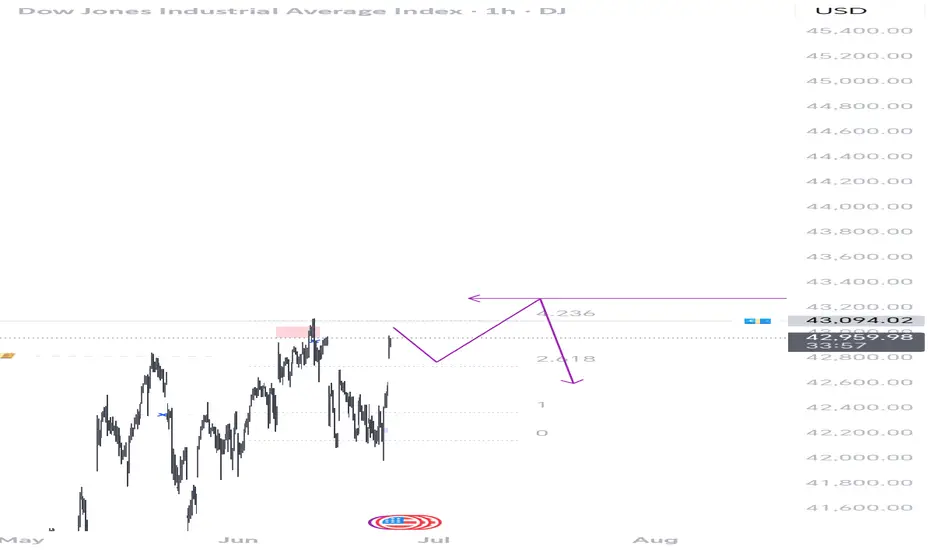
US30 - Final Push before PullbackPotentially another push to upper levels of supply potentially 43,150-43,200. Can see this retest before seeing a potential pull back based off larger time frame.
US30 Sell IdeaWe see price beginning to downtrend forming LL & LH. We also see price beginning to get closer to our daily low. Now we enter off of the 2nd mitigation of the bearish engulfing located at our point of interest on the 1hr. Really nice signature setup here. Overall I feel good I really took my time finding this setup!
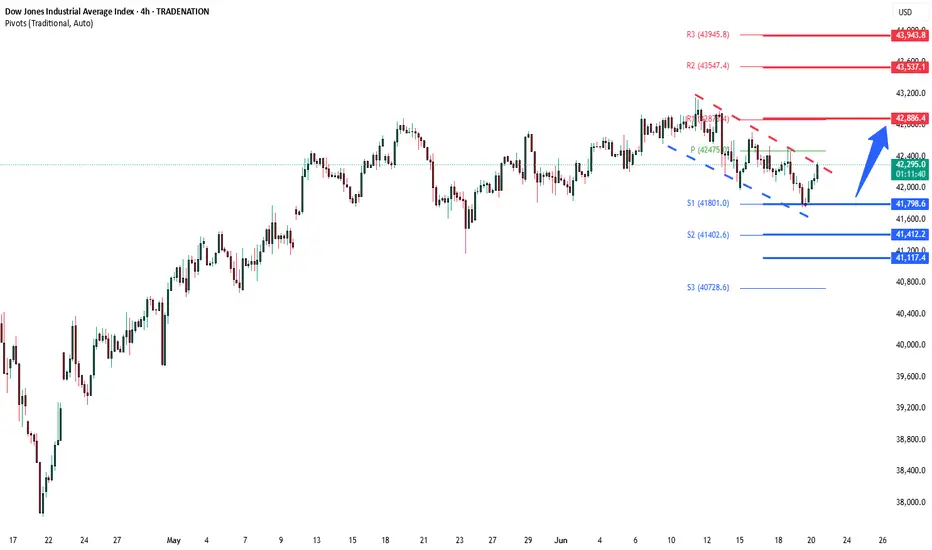
DowJones bullish consolidation supported at 41800Key Support and Resistance Levels
Resistance Level 1: 42890
Resistance Level 2: 43540
Resistance Level 3: 43940
Support Level 1: 41800
Support Level 2: 41400
Support Level 3: 41100
This communication is for informational purposes only and should not be viewed as any form of recommendation as to a particular course of action or as investment advice. It is not intended as an offer or solicitation for the purchase or sale of any financial instrument or as an official confirmation of any transaction. Opinions, estimates and assumptions expressed herein are made as of the date of this communication and are subject to change without notice. This communication has been prepared based upon information, including market prices, data and other information, believed to be reliable; however, Trade Nation does not warrant its completeness or accuracy. All market prices and market data contained in or attached to this communication are indicative and subject to change without notice.
SELL US30 - TO CLOSE GAPIn 5 min TF - retesting FVG.
There is also a H&S pattern forming - 5 min TF
Selling for the rest of the day

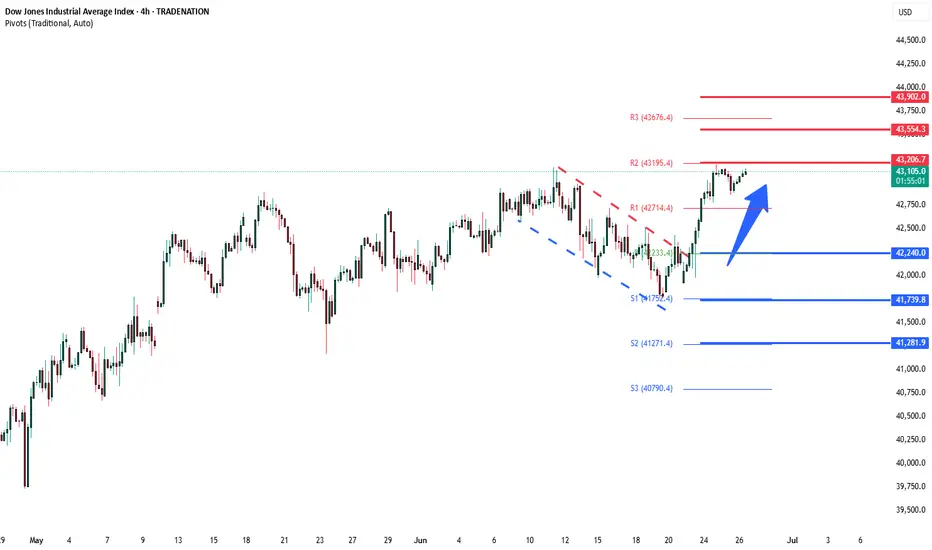
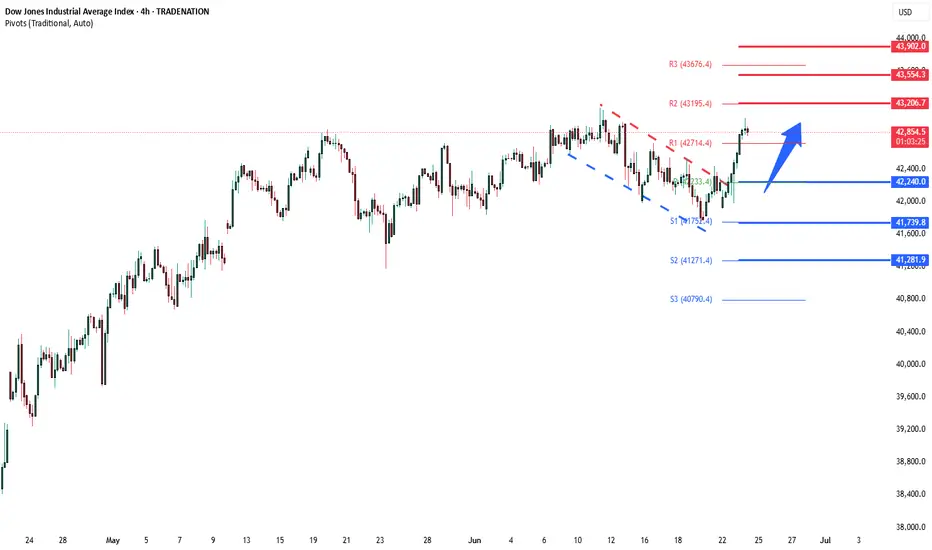
DowJones bullish breakout supported at 42240Key Support and Resistance Levels
Resistance Level 1: 43200
Resistance Level 2: 43544
Resistance Level 3: 43900
Support Level 1: 42240
Support Level 2: 41740
Support Level 3: 41280
This communication is for informational purposes only and should not be viewed as any form of recommendation as to a particular course of action or as investment advice. It is not intended as an offer or solicitation for the purchase or sale of any financial instrument or as an official confirmation of any transaction. Opinions, estimates and assumptions expressed herein are made as of the date of this communication and are subject to change without notice. This communication has been prepared based upon information, including market prices, data and other information, believed to be reliable; however, Trade Nation does not warrant its completeness or accuracy. All market prices and market data contained in or attached to this communication are indicative and subject to change without notice.
US30 POTENTIAL SETUPUS30 Analysis
Fundamental Analysis:
The US30 (Dow Jones Industrial Average) continues to face turbulence as global and domestic factors interplay. Recently, several key macroeconomic and geopolitical developments have influenced sentiment:
FOMC Outlook: The Federal Reserve’s decision to pause interest rate hikes amidst easing inflation suggests a more dovish stance. However, labor market resilience and retail sales indicate lingering strength in consumer demand.
Geopolitical Risk – Iran-Israel Conflict: The renewed tensions in the Middle East—especially between Iran and Israel—have heightened risk sentiment. Oil prices are sensitive to the conflict, indirectly pressuring inflation and causing volatility in equity markets.
US Economic Indicators:
CPI (Consumer Price Index): Showed moderate deceleration, aligning with the Fed’s inflation target.
Unemployment Rate: Remains low, strengthening confidence in the soft-landing narrative.
Manufacturing and PMI Data: Indicate a slowdown, showing a mild contraction phase in industrial activity.
These mixed signals are feeding into a cautious yet opportunity-laden market environment for indices like US30.
Technical Analysis (SMC - Smart Money Concepts):
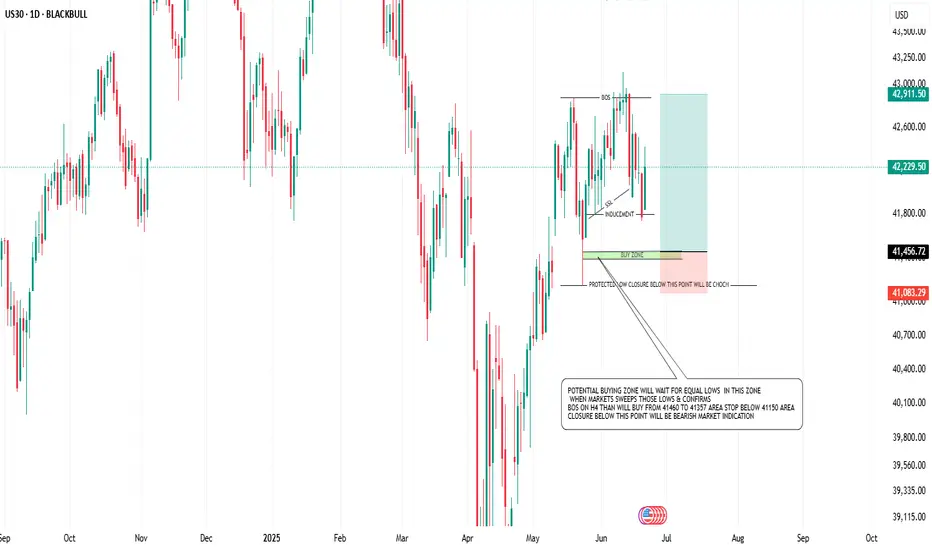
Current Market Structure:
The price recently broke structure (BOS) to the upside after a series of higher lows and equal highs.
It’s now in a pullback phase, showing a classic inducement pattern where early liquidity is grabbed below recent equal lows.
Key Zones:
Buy Zone: Marked between 41,460 to 41,357 (H1 FVG) , which lies just above the protected low at 41,150.
A sweep of equal lows followed by confirmation (e.g., BOS on lower timeframe like H4) would validate a long entry.
Risk Management:
Stop-loss: Below 41,150, signaling bearish intent if broken (CHOCH – Change of Character).
Take-profit Target: Upwards toward 42,911, aligning with previous highs and order block inefficiencies.
Bearish Scenario: A daily closure below 41,150 would invalidate the bullish setup and suggest a deeper retracement toward the next key support near 40,636.
NOTE: Not a financial advice only for educational purpose
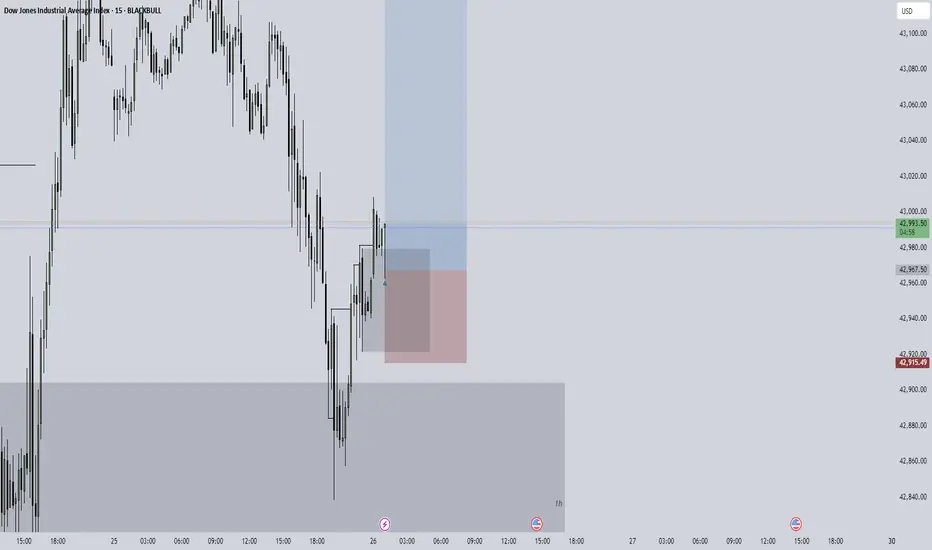
Dow Jones Entry - Riskier this one trade keep the SL way tighter than the other, guarantees a much better RRR but it is more risky
TOP IS NOT IN YET (MORE UPSIDE AFTER THE MINOR CORRECTIONS)We discussed the 5-year bull cycle that starts off every 20-year cycle. We identified that the current 5-year bull cycle will be one of the wildest in the history of the DJIA market by virtue of the current energy level within the log expansion. We will start a new progressive series to discuss the current 20-year cycle in motion.
First we will look closely at these three different 20-year cycles
From the three cycles we can identify a peculiar recurring structure, that is, after the approximately 5th year top we have a wild decline that averagely bottoms below the starting price. We will not dwell much on this cycle as it's not the current cycle in progress. Between these cycles is an (Alternate Cycle) that also has a similar fractal construction.
The first two alternate cycles directly lie between the cycles identified earlier and have a similar fractal. The most striking identity of these alternate cycles is that the origin point is the lowest point within the 20 year trend. The correction from the 5th year top is not so steep and never goes below the origin
The 1942/1962 cycle lies between the 1921/1942 and 1962/1982 cycles
The 1982/2002 cycle lies between the 1962/1982 and 2002/2022 cycles
This means the next alternate 20-year cycle is the 2022/2042 cycle which will lie between 2002/2022 and 2042/2062 cycles. From the internal construction of this cycle we can dive deeper and model the structure forward in both price and time. Example, the vertical price axis for the 1942/1962 cycle was (+648.61 pts) and total horizontal time elapsed was (+1052 wks).
We have a (648.61 x 1052) structure showing a perfect golden ratio of price and time
(1052 / 648.61) = 1.6219
1982/2002 cycle had price axis = 1098.03 pts and time = 1052 wks
We have approximately a 1098.03 x 1052 square of price and time
By observing the cumulative growth pattern we can make projection of the current cycle in progress. We would go through the growth gradually and identify price and time resistances as price action progresses. Please check back as we build step by step the growth structure of the current cycle.
Trade safe

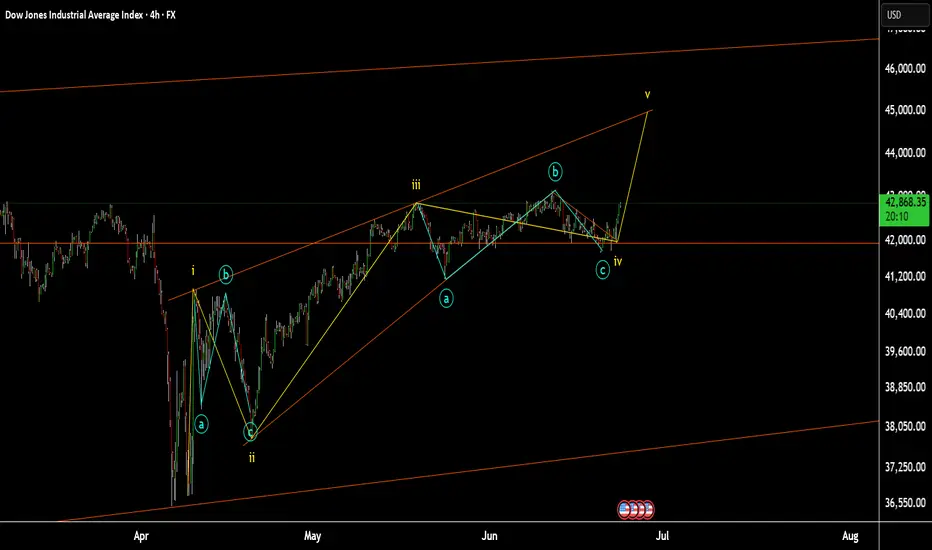
US 30 the 5th wave US 30 the 5th wave this is not an impulse wave totally.
just the conflict of is going to be peace so if we look at OIL we can see everything is good.
DowJones INTRADAY key trading levelsKey Support and Resistance Levels
Resistance Level 1: 43200
Resistance Level 2: 43550
Resistance Level 3: 43900
Support Level 1: 42240
Support Level 2: 41740
Support Level 3: 41280
This communication is for informational purposes only and should not be viewed as any form of recommendation as to a particular course of action or as investment advice. It is not intended as an offer or solicitation for the purchase or sale of any financial instrument or as an official confirmation of any transaction. Opinions, estimates and assumptions expressed herein are made as of the date of this communication and are subject to change without notice. This communication has been prepared based upon information, including market prices, data and other information, believed to be reliable; however, Trade Nation does not warrant its completeness or accuracy. All market prices and market data contained in or attached to this communication are indicative and subject to change without notice.
short within and without rangesbasicly i dont know what will happen
do i predict?
yes
do i react?
maybe
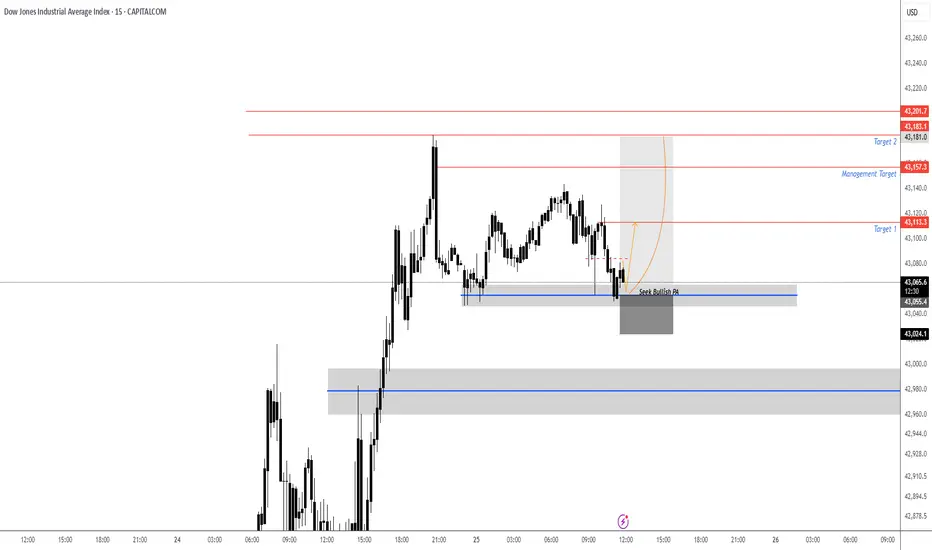
US30 next target releasedNo comment needed. All information is in the chart analysis.
Steps to follow:
Analyze yourself.
Take the position with SL and Take Profits.
Wait, it may take a couple of days, so take a break and step away from the screen from time to time, just like I do :)
Get the result.
I will update the trade every day.
Like, comment with your good mood or viewpoint, share with your circle. It’s together that we get stronger!
Good trades, Traders!
The golden bear
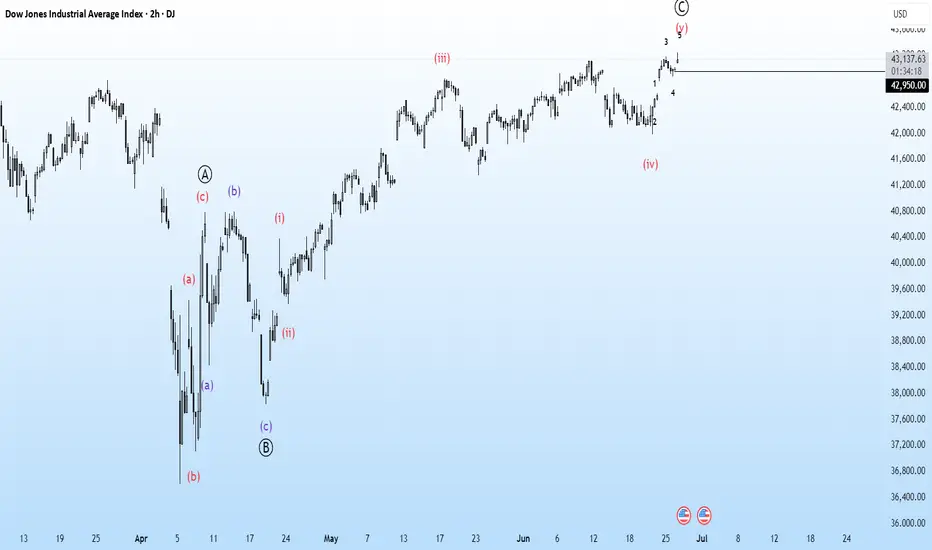
DJI This is 2hrly chart of DJI
looking at the chart ,
I sense this structure of EW ...
and looks this whole move has been corrective wave...
going forward...
DJI is 43185
below 42950, I would be looking for 36.5k as my target with recent high as my sl ...
Just a View!!
Vedang:)
Discliamer: Chart is for study purpose only!!
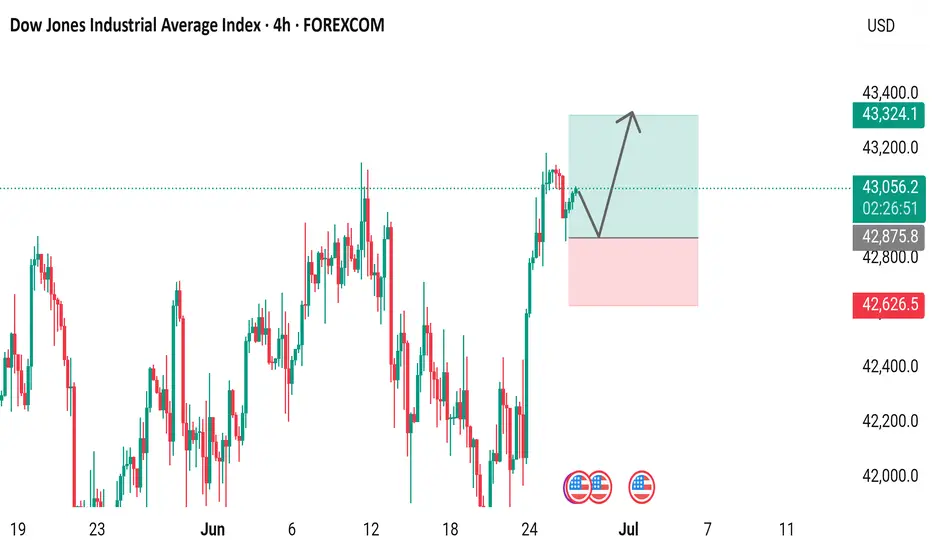
Dow Jones Industrial Average Index - 4h Chart (FOREXCOM)4-hour chart of the Dow Jones Industrial Average Index (US30) shows the price movement from late June to early July 2025. The current value is 43,057.7, reflecting a slight increase of +78.0 (+0.18%). The chart highlights key price levels, including a resistance zone around 43,324.1 and a support zone near 42,875.8, with recent price action showing a breakout above the resistance level.
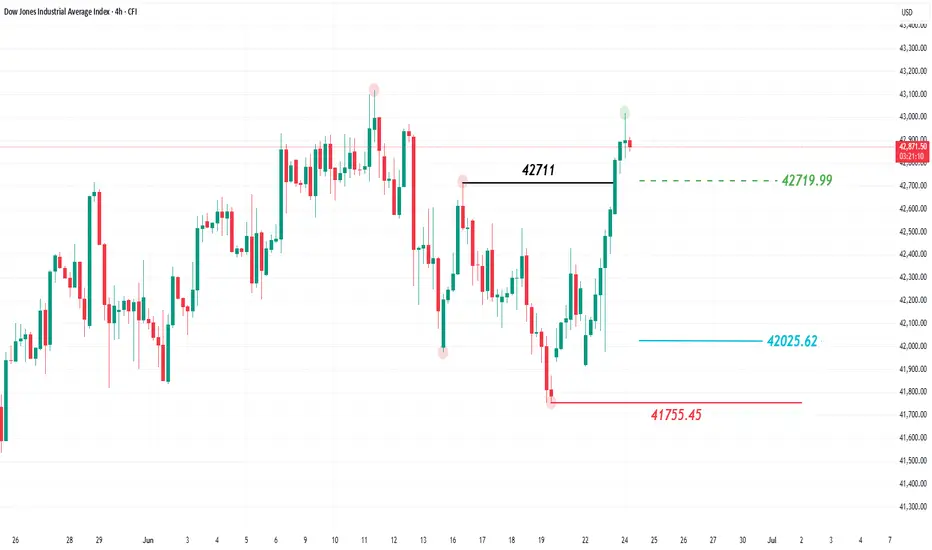
The Dow Jones Index reboundsUS indices rebounded following the US president’s announcing a ceasefire deal in the Middle East, which brought some optimism to the markets and among investors, positively impacting US markets in particular.
The Dow Jones Index rose at the start of this week by approximately 2.62%, reaching a new high above the 42,711 level, which represents the last lower high recorded by the market. A breakout above this level could indicate a shift in trend from bearish to bullish.
If the price pulls back to the 42,025.62 level, it would be considered a corrective move, with a possible upward rebound from that level aiming to target 42,719.99 and potentially continue the bullish trend in the long term.
However, if the price falls below the 41,755.45 level and a four-hour candle closes below it, the positive scenario mentioned above would be invalidated.
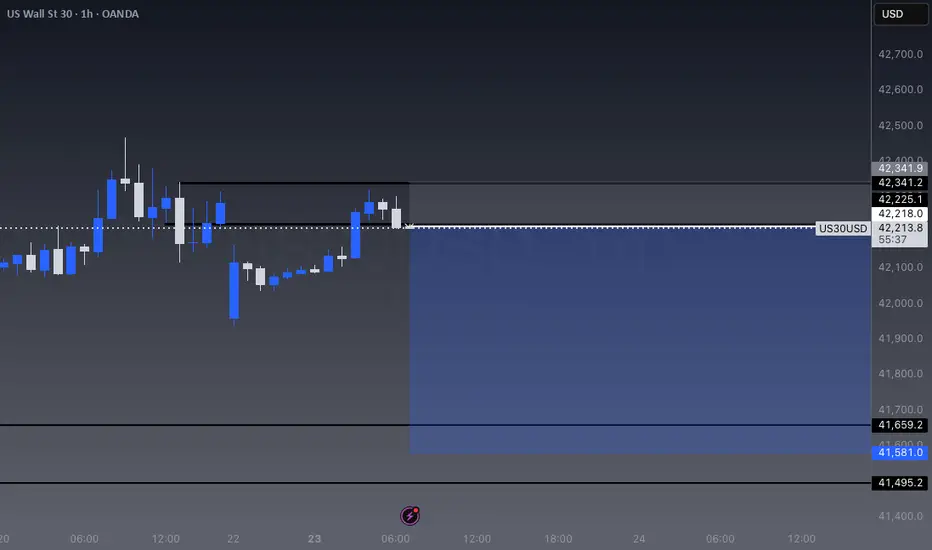
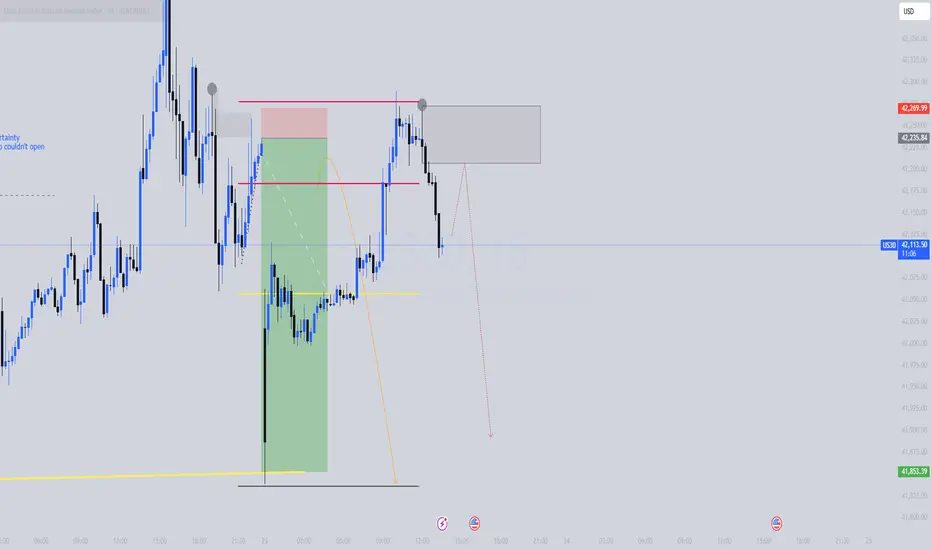
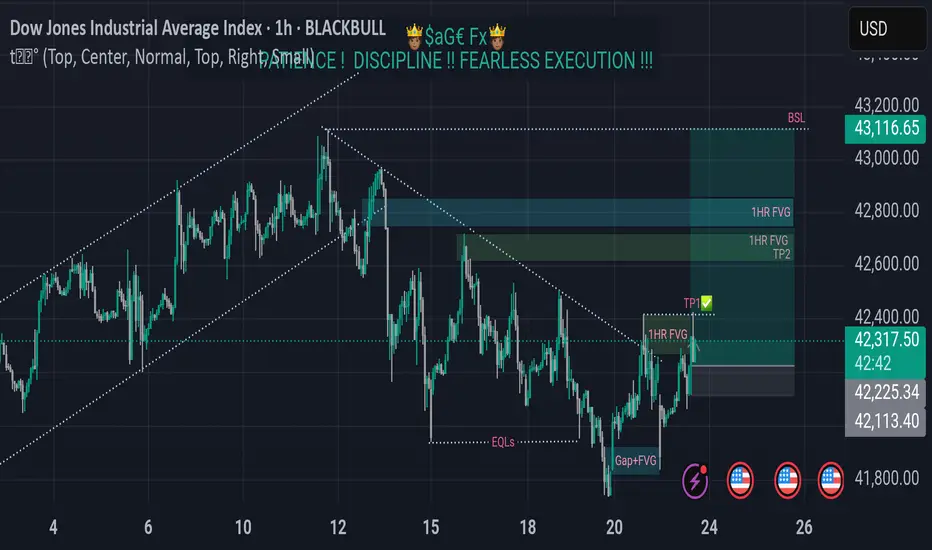
US30 | FLUSHPOINTto keep it simple we missed our first trade on US30 due to the open gap
therefore we are attempting to re-enter trade as we a back at our POI
US30 Technical Overview – 06/20/2025📍 US30 Technical Overview – 06/20/2025
After dropping below the 42,472 support zone, US30 is attempting a minor bounce from the 42,000 region. Momentum remains weak with EMA pressure overhead.
🧠 Key Observations:
Clean breakdown below 42,472 📉
EMA resistance still intact (42,085)
Weak recovery after tapping 41,900 area
📊 Price Zones:
🔼 Resistance: 42,472 → 42,600
🔽 Support: 41,900 → 40,983
📈 Trade Setup Ideas:
🔹 Long Bias:
Only if price breaks & holds above 42,472
→ Target: 42,700+
🔻 Short Bias:
Rejection from 42,085–42,100
→ Target: 41,900 → 41,200 → 40,983
🕵️♂️ Still inside a potential distribution phase. Stay patient — let price pick direction before sizing in!

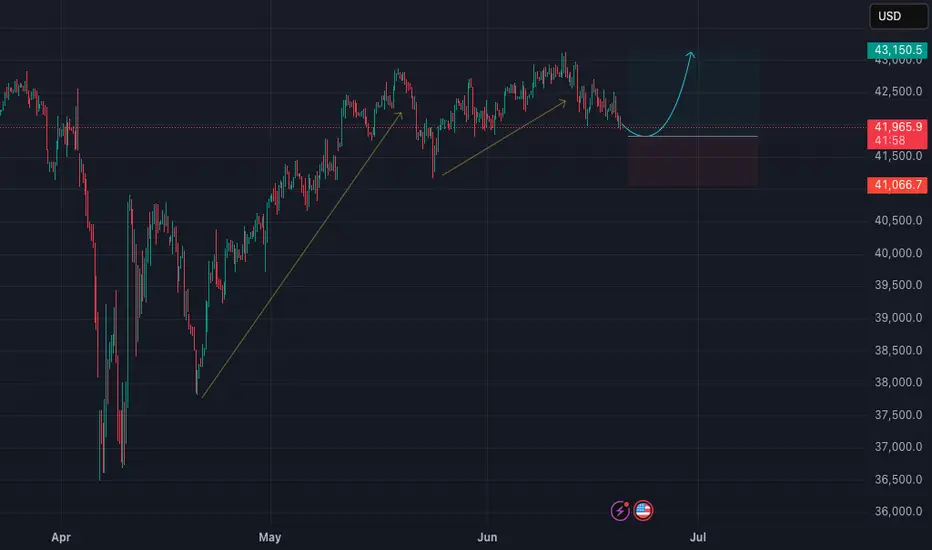
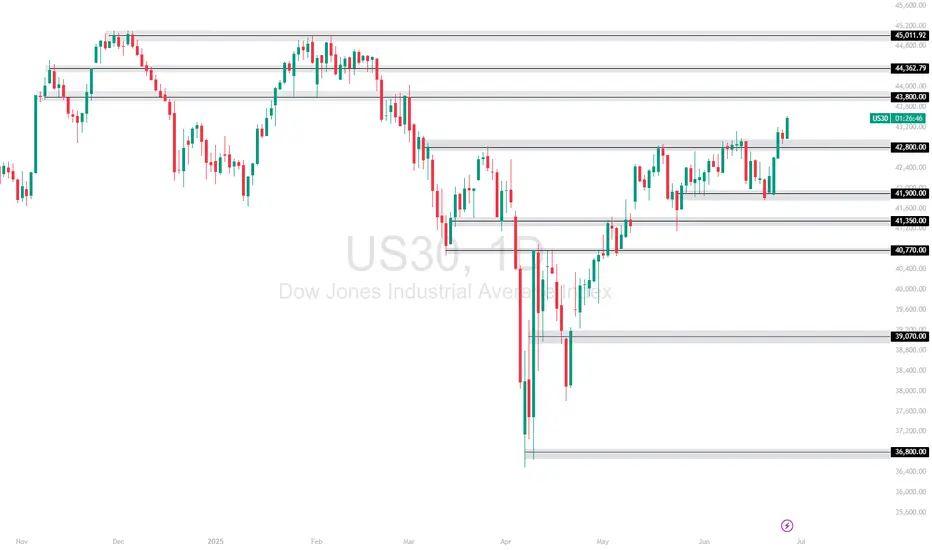
US30 Testing Key Resistance ZonesUS30 has shown renewed bullish momentum with a strong breakout candle above the 42,800.00 resistance. After consolidating for several sessions, price surged upward, now hovering near the 43,800.00 zone—an important resistance level from prior highs.
Support at: 42,800.00 🔽 | 41,900.00 🔽
Resistance at: 43,800.00 🔼 | 44,362.79 🔼 | 45,011.92 🔼
🔎 Bias:
🔼 Bullish: A daily close above 43,800.00 opens the path to test 44,362.79 and potentially 45,011.92.
🔽 Bearish: Rejection from current level and a break below 42,800.00 may trigger a pullback toward 41,900.00.
📛 Disclaimer: This is not financial advice. Trade at your own risk.
US30 - ShortLooking for the Short on US30 final pull back before we see extension to the upside 45,000.
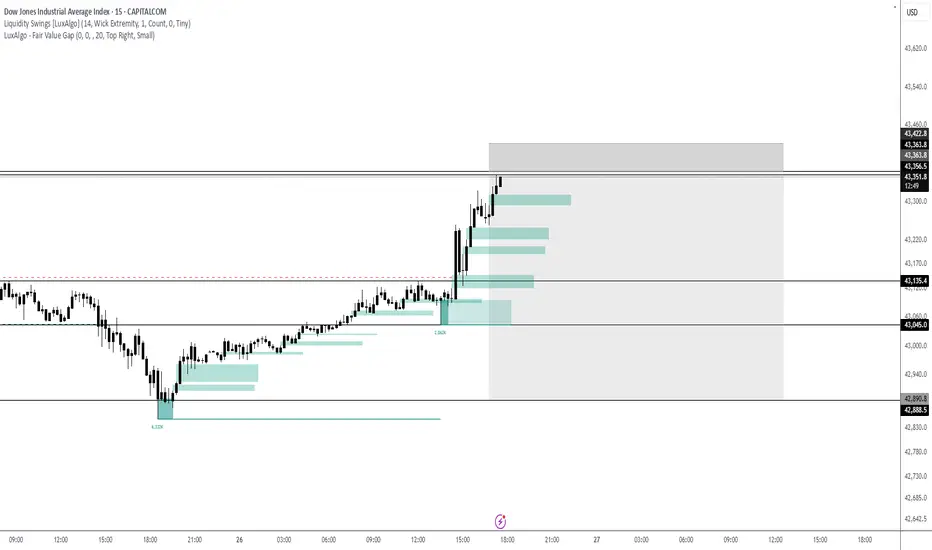
Lets See How It Plays out. TP1 Secured.Break of trenline and rejection from GAP+FVG.
Sweep of $$$ Liquidity from and Equal Lows.
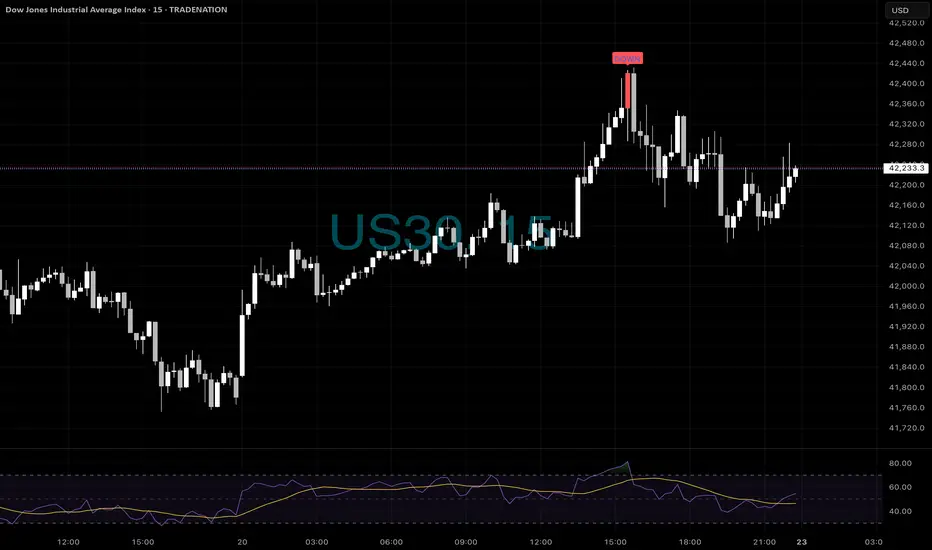
DOW - Shorts as well📉 US30 Top Called to the Point – Friday 15min Reversal
It doesn’t get much cleaner than this.
Our ELFIEDT – X-REVERSION system printed a precise “DOWN” signal right as price exhausted into its session high.
That wasn’t guesswork — it was quantified mean reversion + RSI divergence, confirming loss of momentum at a stretched level.
💡 Look below: RSI divergence already warned us…
💣 Add our signal = high-confidence short with a defined stop just above the bar.
🧠 This is what happens when price structure, statistics, and momentum all agree — you get in where it matters.
📲 Want to trade smarter and get setups like this in real time?
Message us now to start using our indicator suite — it’s already helping traders catch tops, bottoms, and reversals with confidence.
⸻
#US30 #DowJones #TopReversal #ELFIEDT #TradeSmarter #TechnicalAnalysis #PriceActionSignals #ReversionTrading #ShortSetup #MomentumTrading #RSIDivergence #TradingViewIndicators #ProfitFromPrecision #XReversionTool
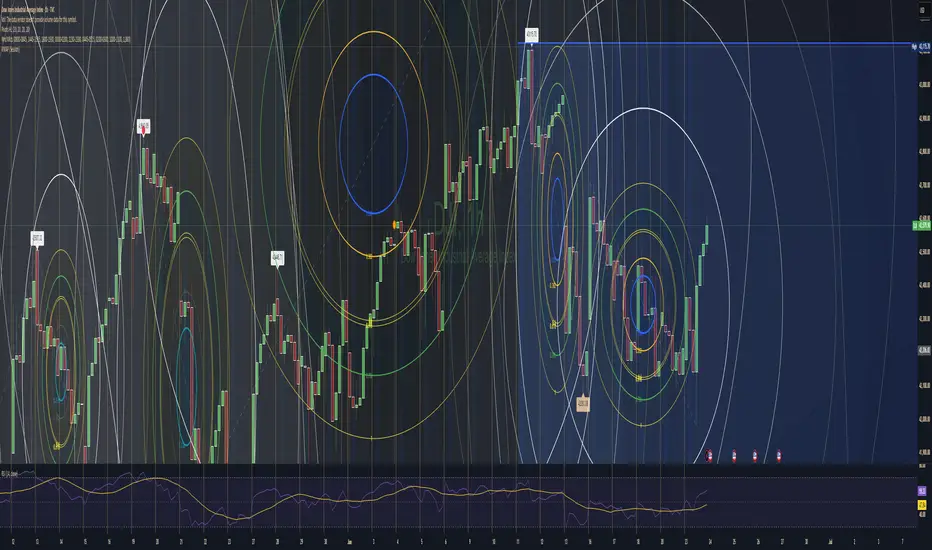
dji looking to rebound after 2 days on the rough marketThe fib circle looks to be showing an upward trend. Notice how the blue circle is completely overtaken and the drop yesterday. Showing that a potential reversal is within both levels. Seeing how this formation is. Looking to be on a continuous volatility for the djia.
If someone could look at this and if you would, I ask for an opinion?